
Market Overview
| Study Period | 2021 - 2031 |
|---|---|
| Forecast Data Period | 2026 - 2031 |
| Historical Data Period | 2021 - 2024 |
| Market Volume (2026) | 1.95 Terawatt |
| Market Volume (2031) | 2.49 Terawatt |
| Growth Rate (2026 - 2031) | 5.06 % |
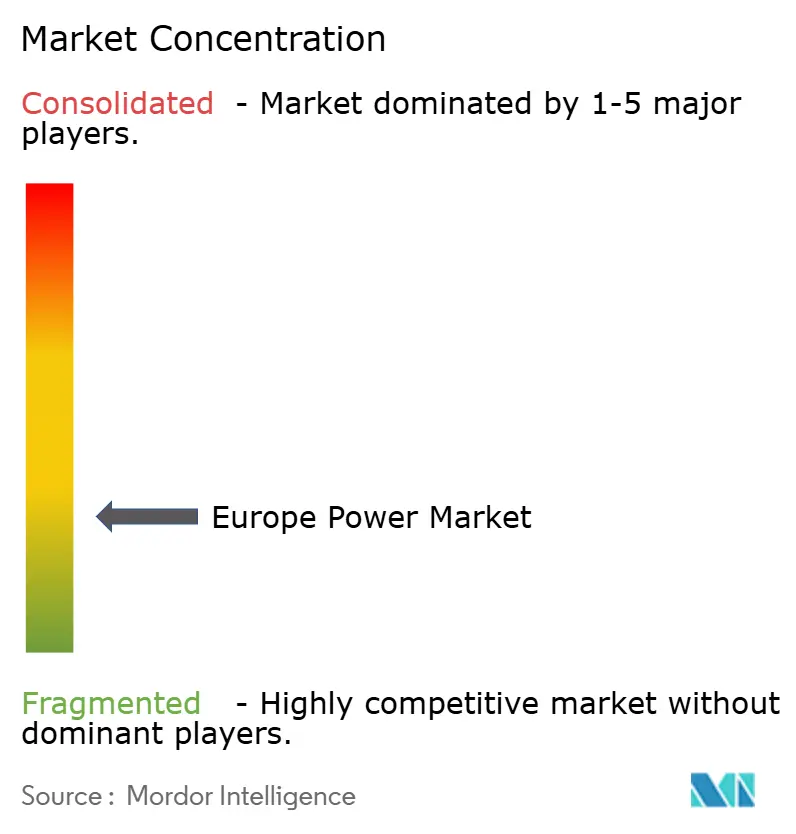
| Market Concentration | Low |
Major Players *Disclaimer: Major Players sorted in no particular order Image © Mordor Intelligence. Reuse requires attribution under CC BY 4.0. | |
Europe Power Market Analysis by Mordor Intelligence
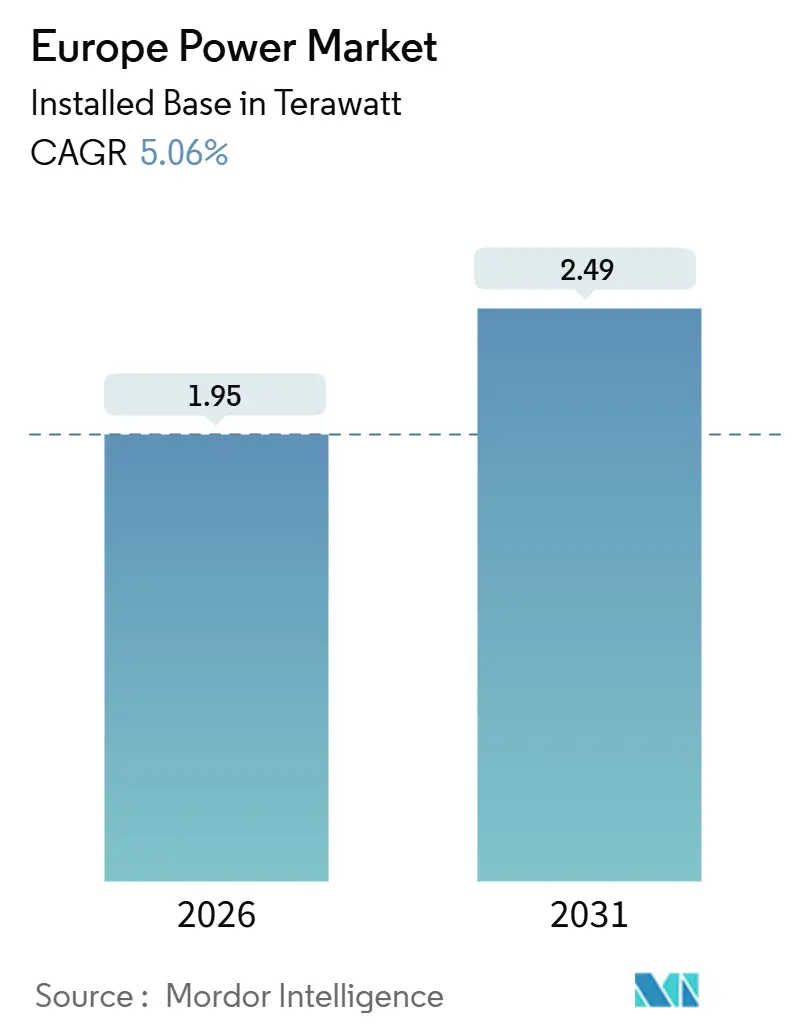
The Europe Power Market size in terms of installed base is expected to grow from 1.95 Terawatt in 2026 to 2.49 Terawatt by 2031, at a CAGR of 5.06% during the forecast period (2026-2031).
Strong policy momentum under Fit-for-55 and REPowerEU is pushing utilities to replace retiring coal and nuclear plants with low-cost wind and solar, whose levelized costs dropped to EUR 35 per MWh and EUR 40 per MWh respectively in 2024. Offshore wind pipelines, hydrogen-ready gas retrofits, and AI-enabled grid upgrades are converging to neutralize intermittency concerns, while corporate power-purchase agreements (PPAs) give developers an additional funding channel that now rivals traditional utility procurement. Grid-edge technologies, including virtual power plants and residential batteries, are expanding the addressable flexibility pool and tempering wholesale price volatility. At a regional level, Germany remains the capacity heavyweight, yet Denmark’s acceleration toward 100% renewable electricity is reshaping the competitive balance.
Key Report Takeaways
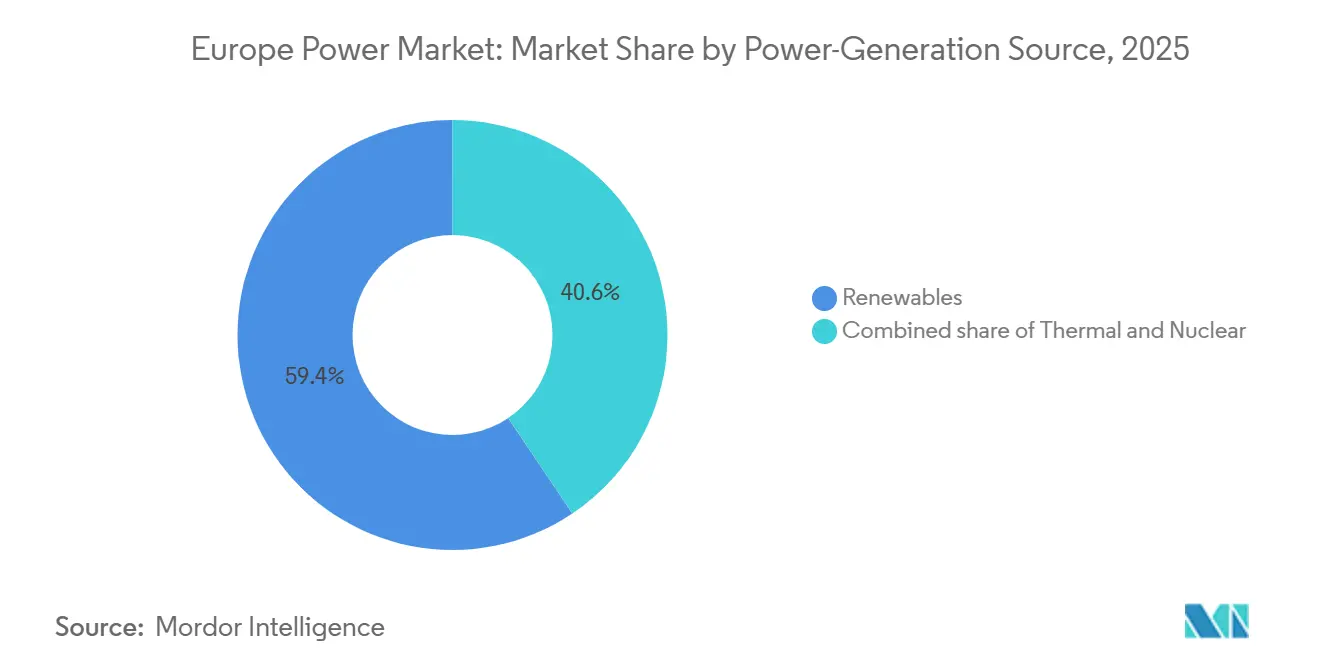
- By power-generation source, renewables captured 59.40% of Europe's power market share in 2025; offshore wind capacity is projected to advance at an 8.51% CAGR to 2031.
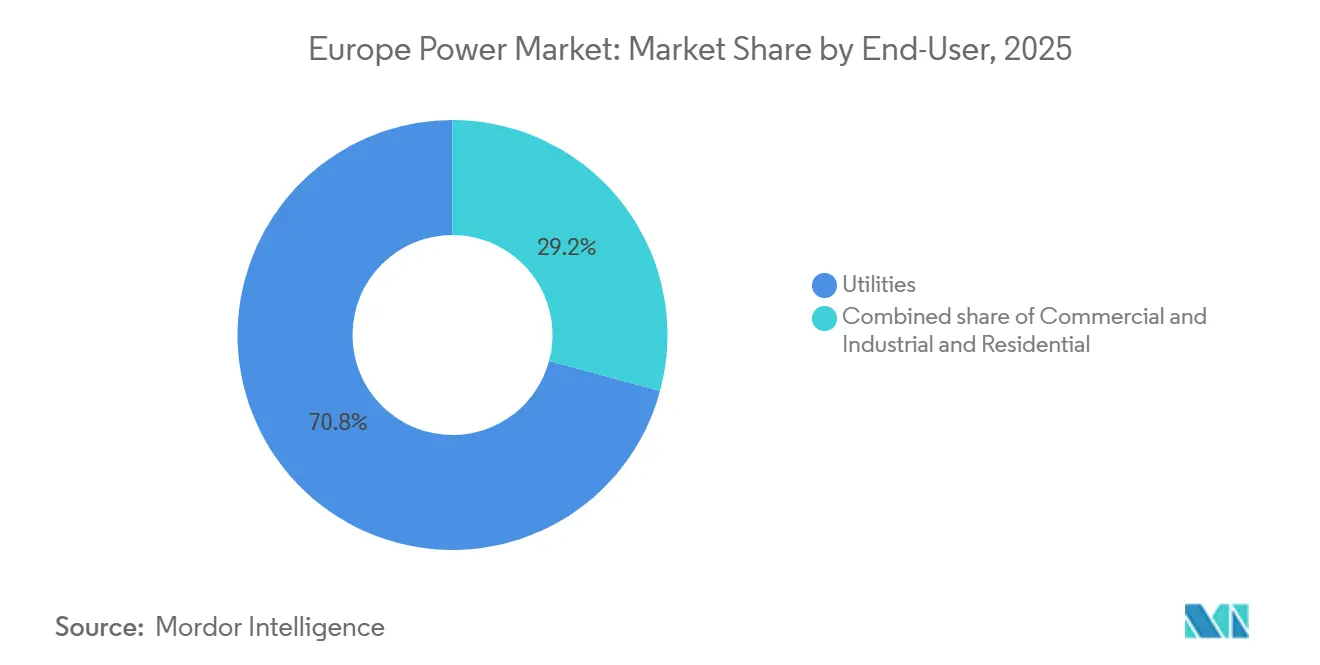
- By end-user, utilities commanded 70.8% of the European power market size in 2025, while the residential segment is expanding at a 10.4% CAGR through 2031.
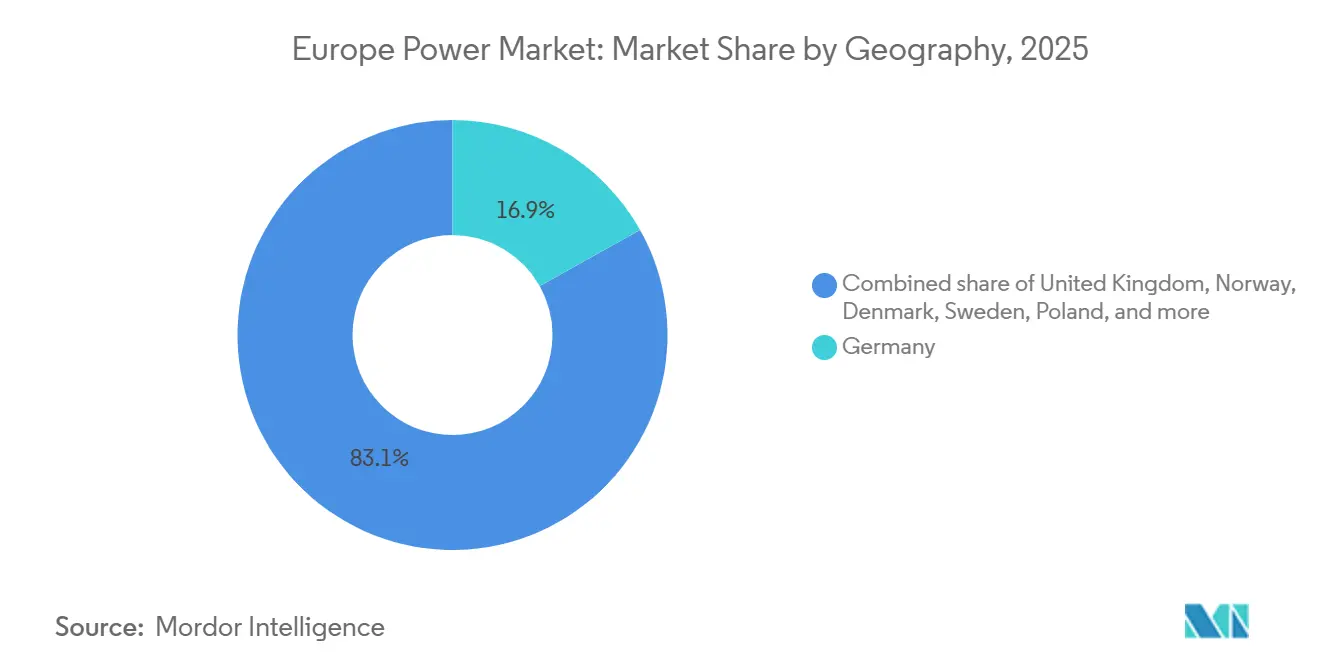
- By geography, Germany held 16.87% of the European power market in 2025; Denmark records the fastest forecast pace with a 9.5% CAGR to 2031.
Note: Market size and forecast figures in this report are generated using Mordor Intelligence’s proprietary estimation framework, updated with the latest available data and insights as of January 2026.
Europe Power Market Trends and Insights
Drivers Impact Analysis*
| Driver | (~) % Impact on CAGR Forecast | Geographic Relevance | Impact Timeline |
|---|---|---|---|
| EU Fit-for-55 & REPowerEU decarbonization mandates | +1.2% | EU-wide, strongest in Germany, Denmark, Spain | Long term (≥ 4 years) |
| Record-low LCOE of onshore wind & utility-scale solar | +1.0% | Global, with highest impact in Spain, Germany, Nordics | Medium term (2-4 years) |
| Accelerated coal & nuclear phase-outs post-2025 | +0.8% | Germany, France, Poland, Belgium | Medium term (2-4 years) |
| Digitalisation of grids (AI-enabled predictive O&M) | +0.5% | UK, Germany, France, Netherlands | Short term (≤ 2 years) |
| Data-centre electricity demand surge (>20 TWh by 2030) | +0.7% | Ireland, Germany, Netherlands, Nordics | Long term (≥ 4 years) |
| Hydrogen-ready CCGT retrofits unlocking flexible backup | +0.4% | Germany, Netherlands, UK, Italy | Medium term (2-4 years) |
| Source: Mordor Intelligence | |||
EU Fit-for-55 & REPowerEU Decarbonization Mandates
Mandated renewable shares of 42.5% by 2030 and net-zero by 2050 have anchored long-term revenue visibility in the european power market for developers, pushing annual solar additions in Germany to 15 GW and onshore wind to 10 GW, triple the 2020-2023 run-rate.[1]European Commission, “Renewable Energy Directive III,” ec.europa.eu Streamlined permitting that caps approvals at 12 months in priority zones is easing deployment backlogs that once stretched five years, while EUR 300 billion of REPowerEU funds redirects recovery spending toward grid reinforcement and battery co-location. Utility investment portfolios are shifting in tandem, allocating more than 50% of 2026 budgets to renewables and digital networks. Grid codes now reward fast-acting battery storage, spurring 10 GWh of additions in 2024. The taxonomy framework is equally influential because “do-no-significant-harm” rules favor projects with recycling or circular-economy plans, leading turbine makers to announce blade-recycling lines in France and Spain.
Record-Low LCOE of Onshore Wind & Utility-Scale Solar
Onshore wind at EUR 35 per MWh and utility solar at EUR 40 per MWh undercut 2024 coal and gas benchmarks by more than 50%, turning renewables into the default capacity choice in the european power market. Efficiency gains are material: 6 MW onshore turbines yield 30% more output than 2020 machines, and bifacial panels raise solar yields by up to 15%.[2]IRENA, “Future of Solar Photovoltaic,” irena.org Spain’s 2024 tender cleared at EUR 28 per MWh, while the United Kingdom’s latest Contracts-for-Difference round delivered offshore wind at GBP 44 per MWh (USD 56). LCOE deflation has a price-paradox, though; high solar penetration in Denmark triggered midday negative wholesale prices on 42 days in 2024, accelerating power-to-X electrolyzer uptake that reached 2 GW that year. Project economics now embed ancillary-service revenue, adding new valuation levers for investors.
Accelerated Coal & Nuclear Phase-Outs Post-2025
Germany’s April 2023 nuclear exit and planned 2030 coal retirement strip 19 GW of baseload, requiring a doubling of annual renewable installations and grid-scale storage across the european power market. France is rebalancing after fleet corrosion cut nuclear availability to 54% in 2022, while Poland committed to removing 5 GW of coal by 2030 under EU pressure. Life-extension decisions remain contentious: Belgium extended Doel 3 and Tihange 2 for ten years to safeguard winter adequacy. Flexible hydrogen-ready combined-cycle gas turbines (CCGTs) are bridging the gap, capturing capacity payments and ensuring inertia, with RWE planning 3 GW of retrofits through 2028. Net cross-border electricity imports into Germany rose to 15 TWh in 2024, signaling wider reliance on interconnectors during tight periods.
Digitalisation of Grids (AI-Enabled Predictive O&M)
Machine-learning platforms reduced unplanned outages by 20%-30% when National Grid rolled out predictive analytics across 7,000 transmission substations in 2024. Digital twins from Siemens are now in service with 15 transmission operators, allowing stress-testing of high-renewable dispatch scenarios and minimizing curtailment. Artificial-intelligence controls also unlock distributed flexibility; Germany aggregated 2 GW of residential batteries and EV chargers into frequency-response markets in 2024. Cyber-security oversight tightened through the NIS2 Directive, which imposes 24-hour incident reporting and EUR 10 million fines, pushing smaller utilities to adopt edge-computing designs that degrade gracefully under attack. Taken together, digitalisation is compressing operations and maintenance outlays by 15%-20%, freeing capital for new build.
Restraints Impact Analysis*
| Restraint | (~) % Impact on CAGR Forecast | Geographic Relevance | Impact Timeline |
|---|---|---|---|
| Congested cross-border interconnector capacity | -0.6% | Germany-France, Iberia-France, Nordics-Continental Europe | Medium term (2-4 years) |
| Lengthy grid permitting & NIMBY opposition | -0.5% | Germany, UK, France, Spain | Long term (≥ 4 years) |
| Volatile wholesale prices eroding utility margins | -0.4% | EU-wide, most acute in Germany, Spain, Denmark | Short term (≤ 2 years) |
| Critical-mineral supply-chain exposure for renewables | -0.3% | Global, with highest impact on solar and battery projects | Medium term (2-4 years) |
| Source: Mordor Intelligence | |||
Lengthy Grid Permitting & NIMBY Opposition
Grid build-times average 7-10 years, with local challenges adding two to three years, evident in Germany’s 700 km SuedLink that will be 13 years old by first power in 2028, highlighting a key challenge for the european power market. France’s TSO reports that 40% of projects face lawsuits, especially near coastal landing points for offshore wind connections. In the United Kingdom, a connection queue of 739 GW stretches out to 15 years for some projects, prompting new “first ready, first connected” rules. Spain cut approval windows to 18 months in designated zones, yet implementation lags in Catalonia and Andalusia, keeping uncertainty high. The delays stranded 12 GW of German wind and solar proposals between 2022 and 2024, equal to EUR 15 billion of stalled capital.
Congested Cross-Border Interconnector Capacity
Fourteen corridors highlighted by ACER’s 2025 monitoring report operate near saturation, suppressing efficient dispatch and inflating redispatch costs that hit EUR 4.2 billion in Germany during 2024.[3]Agency for the Cooperation of Energy Regulators, “Electricity Wholesale Market Monitoring Report 2025,” acer.europa.eu The France-Spain interconnector’s 2.8 GW ceiling prevents 15 GW of surplus Iberian solar from relieving French mid-day demand spikes. Nordic-to-Continental cables also choke during winter, curtailing Norwegian hydro exports and forcing the Baltic states toward pricier gas imports. The 1.4 GW Viking Link, finally commissioned in 2023 after an eight-year gestation, underscores the slow approval pipeline. Developers facing frequent negative pricing are curtailing output, trimming capacity factors by up to 8% in Spain and Denmark.
*Our forecasts treat driver/restraint impacts as directional, not additive. The impact forecasts reflect baseline growth, mix effects, and variable interactions.
Segment Analysis
By Power-Generation Source: Renewables Dominate Capacity Additions
Renewables contributed 59.40% of the European power market in 2025, and their installed base is advancing at an 8.51% CAGR through 2031.[4]WindEurope, “Offshore Wind in Europe: Key Trends and Statistics 2024,” windeurope.org Offshore wind is taking the lead, with 5 GW installed in 2024 and a 25 GW construction queue led by Denmark’s 3.5 GW Hornsea Three and several North Sea clusters. Onshore wind added 12 GW in 2024, mainly in Spain, Germany, and Sweden, while utility solar added 18 GW, reflecting Spain’s record 6 GW contribution. Hydro remains steady at roughly 200 GW, though Austria’s 1 GW pumped-storage commissioning in 2024 highlighted renewed interest in long-duration storage. Biomass, waste-to-energy, geothermal, and tidal together stay below 5% of capacity but meet niche circular-economy and island-mode needs. The influx of low-variable-cost renewables is altering dispatch order, pushing thermal plants into peaker roles with 30%-40% capacity factors versus 60% in 2015.
Conventional generation still anchors system stability. Natural-gas turbines provide about 200 GW of flexible backup, and hydrogen-ready models are emerging to cut residual carbon. Nuclear remains prominent in France and the United Kingdom at 120 GW region-wide, despite Germany’s exit. Retiring coal blocks free emissions headroom but leave adequacy gaps until sufficient storage comes online. The Europe power market size for flexible backup technologies is therefore gaining investor attention, with pumped-storage, battery farms, and hydrogen-ready gas expected to command more than 15% of new-build spending by 2031.


By End-User: Residential Electrification Outpaces Utility Growth
Utilities still represented 70.8% of Europe's power market size in 2025. Their central role covers large-scale generation, transmission, and cross-border trade. Yet residential electrification is scaling quicker than any other end-user category at 10.4% CAGR, powered by more than 3.5 million heat pumps installed by 2023 and 8 GW of rooftop solar that came online in 2024. Residential EV charging is multiplying after 500,000 public chargers were added in 2024, and behind-the-meter batteries smooth evening peaks. These assets now participate in ancillary markets via aggregators, expanding income streams while deferring distribution upgrades.
Commercial and industrial customers are hedging volatility through long-term PPAs worth 12.7 GW in 2023, with tech multinationals dominating contract volumes. Factory-site solar and battery systems improve uptime in energy-intensive sectors, and the green-steel pivot is evident in Thyssenkrupp's on-site electrolyzer that trims emissions by 30%. Utilities are seeking stable earnings by overweighting regulated networks; Iberdrola reallocated 60% of 2024-2026 capex toward grids, up from 40% four years earlier. Consequently, European power industry players are realigning business models around data, digital services, and flexibility instead of pure commodity sales.
Geography Analysis
Germany, France, Spain, and the Nordics together contributed more than 50% of aggregate capacity in 2025, underlining the geographic concentration of dispatchable and variable generation assets. Germany’s grid congestion costs climbed to EUR 4.2 billion in 2024, a stark rise from EUR 1.5 billion in 2020, emphasizing the monetary strain of balancing a north-south renewables mismatch. Denmark, despite representing less than 2% of the European power market size, delivers outsize technology leadership in offshore wind design and hybrid interconnectors. France’s fleet modernization plan will extend 32 reactors by another decade, preserving 50 GW of nuclear baseload through 2040. Spain retains the lowest solar LCOEs in Europe, catalyzing corporate PPA demand and positioning the country as a merchant-solar exporter once interconnector limits ease.
In Northern Europe, Norway’s 33 GW of hydro and Sweden’s 16 GW offer the continent a strategic battery that fills supply gaps during wind lulls. The United Kingdom is marching toward 50 GW of offshore wind by 2030, and Crown Estate seabed auctions in 2024 released 8 GW of new zones. Ireland faces grid constraints as data-center demand already accounts for 31% of national load, prompting connection moratoria near Dublin. Poland’s transition dilemma underscores a broader Eastern European challenge: legacy coal fleets face rising EU Emissions Trading Scheme costs, yet financing for renewables and storage has lagged.
The rest of Europe, including Italy, the Netherlands, Belgium, Austria, and the Balkans, makes up roughly 35% of installed capacity. Italy leads in distributed solar at 25 GW, the Netherlands excels in North Sea wind at 3 GW, and Austria added the continent’s largest pumped-storage plant in 2024. Interconnection investments are beginning to stitch these disparate resources together, yet ACER warns that EUR 150 billion in new lines is still required by 2030 to unlock full regional synergies.
Regulatory Landscape
EU power regulation is being reshaped by the Electricity Market Design reform, with Directive (EU) 2024/1711 and Regulation (EU) 2024/1747 entering into force on 16 July 2024. The reform steers public support for new renewables and other low-carbon capacity toward long-term instruments (including two-way contracts for difference) and strengthens consumer protections, aligning price formation and investment incentives with the decarbonization agenda under Fit-for-55 and REPowerEU.
In 2026, implementation focus broadened to market integrity, retail switching, and cross-border coordination. Commission Implementing Regulation (EU) 2026/256 (adopted 30 January 2026) updated REMIT-related data reporting rules, while Commission Implementing Regulation (EU) 2026/855 (April 2026) set interoperability requirements intended to enable 24-hour customer switching and standardized data access. At the regional level, ACER intensified oversight of cross-zonal capacity and long-term transmission rights, issuing Recommendation 02/2026 (27 March 2026) and Decision 09-2026 (16 July 2026) on the Core capacity calculation region methodology, alongside 2026 work on infrastructure cost-sharing and measures to raise cross-zonal capacities in Southeast Europe.
Competitive Landscape
The European power market exhibits moderate concentration: the top five utilities, EDF, Enel, Iberdrola, RWE, and Engie, control roughly 35% of installed capacity, leaving considerable headroom for regional specialists and technology disruptors. EDF channels EUR 50 billion into nuclear life extensions while simultaneously exploring hydrogen production on brownfield sites, whereas Enel and Iberdrola divest legacy fossil plants to finance solar-plus-storage portfolios. Ørsted expanded offshore wind holdings to 9 GW after Gode Wind 3’s 1.5 GW commissioning in January 2026, underscoring the growth of pure-play renewable developers. Transmission and system operators, TenneT, Terna, National Grid, and Red Eléctrica, compete for interconnector mandates that now garner regulatory priority, illustrated by TenneT’s EUR 20 billion financing for SuedLink.
Battery storage and virtual power plants present fertile white space. Fluence deployed 2 GWh of grid-scale batteries in 2024, and Next Kraftwerke aggregated 10 GW of distributed assets into real-time balancing markets. AI ranks as a strategic differentiator: utilities with predictive maintenance suites cut unscheduled downtime and narrow customer-churn risks, while laggards incur higher opex. M&A activity remains brisk; RWE’s USD 3.2 billion Northland Power acquisition raised its offshore wind pipeline to 10 GW, and Engie exited all coal generation in 2025 to pivot fully toward hydrogen and flexible gas. Retail disruption by Octopus Energy’s Kraken platform, which onboarded 5 million customers by 2024, exemplifies the competitive pressure now spilling over into customer-facing services.
Policy presents both challenges and opportunities. The EU Electricity Market Design reform formalizes capacity remuneration mechanisms that reward flexibility over traditional baseload, reshaping revenue models. Separate unbundling rules compel transmission owners to grant non-discriminatory access, further leveling the playing field for new entrants. As digital tools proliferate, market boundaries between generation, storage, and demand response blur, catalyzing partnerships that combine data analytics with hardware expertise.
Europe Power Industry Leaders
Electricité de France S.A. (E.D.F.)
Enel S.p.A.
Iberdrola SA
RWE AG
Engie SA
- *Disclaimer: Major Players sorted in no particular order

Market Opportunities and Future Outlook
Grid and flexibility build-out remains the main whitespace as variable renewables expand and congestion and redispatch costs stay elevated in key hubs such as Germany (EUR 4.2 billion in 2024). EU-level actions in 2026 add clearer demand signals for storage and network investment: the European Commission reported EU operating energy storage capacity at 55 GW in 2026, while the July 2026 Electrification Action Plan reaffirmed the need for 200 GW of energy storage by 2030 and set an economy-wide electrification direction. A June 2026 tripartite agreement also committed member states to lift annual storage deployment to around 45 GW between 2026 and 2028, creating a runway for utility-scale batteries, hybrid renewable-plus-storage projects, and aggregator-led flexibility services.
Opportunities extend to faster, more bankable demand-side procurement and adequacy solutions. Corporate PPAs already form a material funding channel (12.7 GW signed in 2023), and 2026 market design measures that emphasize longer-term contracting support developers and large electricity buyers seeking price hedges. On the supply side, firming and replacement capacity needs are being addressed through efficiency and flexibility upgrades and selective new builds, illustrated by Romania's Mintia combined-cycle gas turbine project surpassing 83% completion in June 2026, with initial production targeted for late 2026, which helps system adequacy where coal retirements and interconnector bottlenecks constrain balancing. Network-planning reforms also open implementation space: EU energy ministers agreed a compromise on the Grids Package in June 2026, including a requirement to allocate 10% of unspent annual congestion income to interconnection projects starting January 2028, supporting a larger pipeline for cross-border capacity, grid reinforcement, and digital solutions aimed at reducing curtailment and speeding connection timelines.
Recent Industry Developments
- July 2026: EDF Energy signed Heads of Terms with the UK Government for a Contract for Difference to extend the operational life of the Sizewell B nuclear power station to 2055, backed by an 800 million pound refurbishment program. The agreement reinforces the role of long-duration, dispatchable low-carbon capacity in the UK generation mix while providing a clearer revenue framework for life-extension investments.
- January 2026: RWE secured 20-year Contracts for Difference for 6.9 GW of offshore wind capacity in the United Kingdom's Allocation Round 7. The awards improve project bankability and accelerate buildout of large offshore wind clusters, tightening the linkage between policy-backed revenue stabilization and new renewable capacity additions.
- November 2025: Ingrid partnered with Energiequelle GmbH to co-develop and deploy 200 MW of grid-scale battery energy storage systems across Germany, with Energiequelle leading development and Ingrid handling financing, operations, and optimization. The partnership expands the pool of market-participating flexibility assets in a congested system, supporting ancillary services and mitigating volatility from higher renewable penetration.


Research Methodology Framework and Report Scope
Market Definition and Coverage
We size the Europe power market as the installed electricity generation capacity connected to the grid across European countries, measured in GW and summarized in TW for the total market.
Scope exclusions: Off grid captive generation, behind the meter rooftop systems that are not grid connected, and transmission and distribution network assets are excluded from this sizing.
Segmentation Overview
- By Power Source
- Thermal (Coal, Natural Gas, Oil and Diesel)
- Nuclear
- Renewables (Solar, Wind, Hydro, Geothermal, Biomass & Waste, Tidal)
- By End User
- Utilities
- Commercial and Industrial
- Residential
- By T&D Voltage Level (Qualitative Analysis only)
- High-Voltage Transmission (Above 230 kV)
- Sub-Transmission (69 to 161 kV)
- Medium-Voltage Distribution (13.2 to 34.5 kV)
- Low-Voltage Distribution (Up to 1 kV)
- By Geography
- United Kingdom
- Germany
- France
- Spain
- Norway
- Denmark
- Sweden
- Poland
- Russia
- Rest of Europe
Data Sources, Market Sizing, and Validation
Desk Research
Desk work was used to lock the market boundary and to build the historical capacity timeline by technology and country, before the model was stress tested. Public sources were prioritized for consistency, such as Eurostat energy statistics, ENTSO E transparency data, IEA electricity and capacity series, and European Commission energy market and policy publications.
Along with these, we reviewed national regulator and system operator releases, project commissioning announcements, and company annual reports and investor presentations to understand the timing of additions and retirements. Select paid subscriptions were used only for company financials and intelligence and for cross checking large project pipelines where public visibility is uneven. The sources listed here are illustrative only, and many other documents were referred to for data collection, validation, and research clarification.
Primary Interviews and Surveys
Primary work focused on interviews and surveys with utilities, independent power producers, EPC and O and M service providers, and grid adjacent experts who track buildout timelines. We used these discussions to confirm capacity additions by fuel type, typical commissioning slippages, retirement triggers, and how repowering is counted, and then we checked that the inputs align with country specific market conditions across Europe.
Distribution of primary research fieldwork respondents
| Company type | Respondent position |
|---|---|
| Top tier: 38% | CXOs: 14% |
| Mid tier: 44% | Functional/Unit leaders: 32% |
| Smaller Players: 18% | Managers: 54% |
Market-Sizing & Forecasting
Our sizing starts from a top-down reconstruction of installed capacity by country and by generation type, where official capacity registries and grid reporting are used to rebuild the demand pool for connected generation assets. That total is then corroborated with selective bottom-up checks, such as sampled project level additions, retirement lists, and simple capacity roll ups from public company disclosures, which are used to correct gaps where reporting lags.
Inputs used in the model include the historical net capacity additions (additions minus retirements), technology mix shifts between thermal, nuclear, and renewables, commissioning and permitting lead times, repowering behavior for wind and solar fleets, and country level policy signals that affect closures or extensions. Forecasts were built using scenario analysis so that timing uncertainty in large projects and policy driven retirements can be handled transparently, and then the final path was aligned to the consensus ranges heard in expert calls. Where bottom-up visibility is incomplete, conservative assumptions are applied and then revisited during validation so the total still reconciles with the country capacity series.
Data Validation & Update Cycle
Validation was done by triangulating the modeled capacity totals against independent signals, including country level installed capacity releases, technology specific buildout trends, and known commissioning and retirement events. Variances are flagged for analyst review, followed by a second pass where assumptions are challenged, and interviews are re opened when the mismatch cannot be explained by timing or definitional differences.
The report is refreshed annually, and interim updates are made when there are material events such as policy shifts, major project delays, or accelerated plant retirements. Before delivery, we perform a final update pass so the market numbers reflect the latest public releases and the most recent primary inputs.
Mordor Intelligence's Europe Power Market Size Compared Against Other Published Estimates
Published market sizes for Europe power can look far apart because some sources size value (revenue) while others size physical scale (capacity), and country coverage and timing assumptions also vary. Even when the topic is similar, differences in what is counted and when it is counted can move the final number.
The table below shows how the spread is often linked to unit choice, like USD versus GW, plus differences in whether the scope follows installed capacity or electricity market revenues. Another frequent driver is the handling of repowering, mothballed plants, and cross border definitions, which can inflate totals if the same asset base is interpreted in different ways.
Benchmark comparison
| Source | Market Size | Gaps in Research Methodology |
|---|---|---|
| Mordor Intelligence | USD 1.95 T (2026) | |
| Trade Data Publisher A | USD 299.40 B (2024) | This estimate is value based and is closer to electricity sector revenues, so it is not directly comparable to installed capacity totals and can shift with price cycles and currency timing. |
| Industry Compendium B | USD 2.80 T (2026) | This estimate appears to reflect utility industry revenues and can include transmission, distribution, and retail supply activities, which expands the scope beyond generation capacity. |
The benchmark table shows that the biggest gap comes from mixing revenue based sizing with capacity based sizing, and then layering in wider utility activities. In Mordor Intelligence's model, the market is sized as installed generation capacity in Europe, which is why revenue oriented estimates and broader utility definitions do not line up one to one.


Key Questions Answered in the Report
How large is the Europe power market in 2026?
The Europe power market size is 1.95 terawatt in 2026, and it is forecast to reach 2.49 terawatt by 2031.
What is driving capacity growth across Europe?
EU Fit-for-55 and REPowerEU mandates, record-low renewable costs, and accelerated coal and nuclear retirements are key growth catalysts.
Which segment is expanding fastest by end-user?
Residential demand grows at 10.4% CAGR because of heat pumps, rooftop solar, and EV charging, outpacing utility and industrial segments.
Why are interconnectors critical for the region?
Congested cross-border lines block surplus renewable power from moving between countries, raising redispatch costs and curtailing output.
Who are the leading companies?
EDF, Enel, Iberdrola, RWE, and Engie top the capacity rankings, while Ørsted and Statkraft dominate offshore wind and hydro niches.
Page last updated on:


 Your data is secure and never sold or shared.


