
Market Overview
| Study Period | 2020 - 2031 |
|---|---|
| Forecast Data Period | 2026 - 2031 |
| Base Year Market Size (2025) | USD 70 Billion |
| Market Size (2026) | USD 73.73 Billion |
| Market Size (2031) | USD 95.56 Billion |
| Growth Rate (2026 - 2031) | 5.33 % |
| Market Concentration | Low |
Major Players *Disclaimer: Major Players sorted in no particular order Image © Mordor Intelligence. Reuse requires attribution under CC BY 4.0. | |
Europe Plastic Packaging Market Analysis by Mordor Intelligence
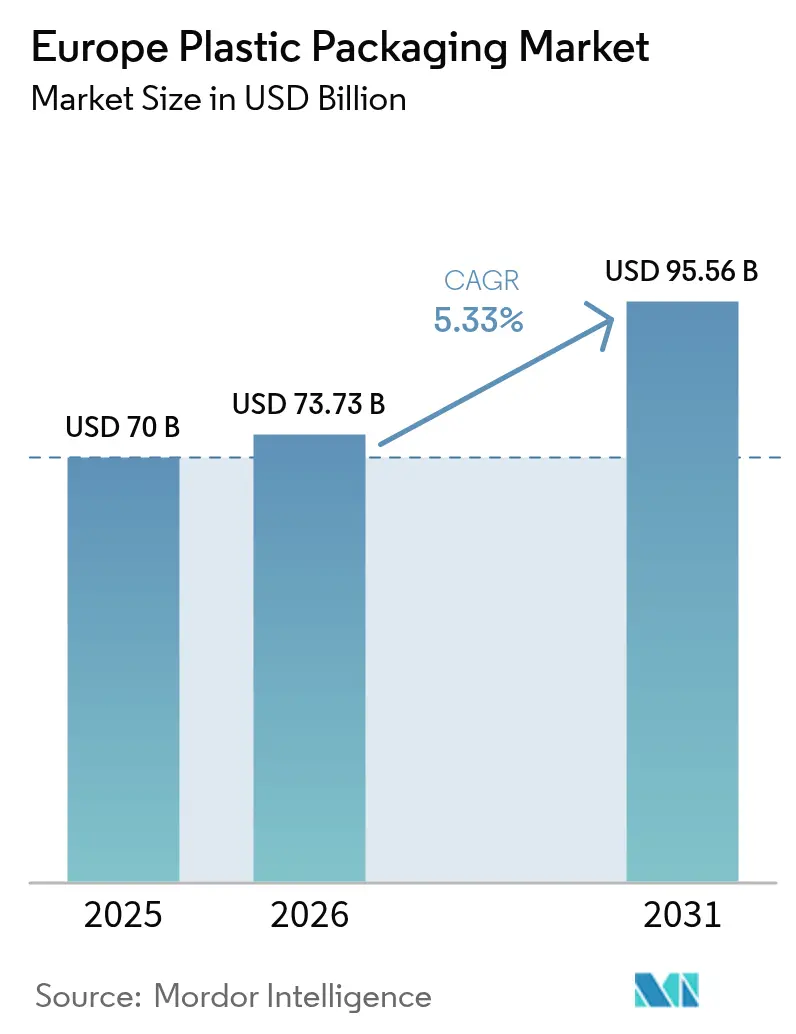
The Europe plastic packaging market size is expected to grow from USD 70 billion in 2025 to USD 73.73 billion in 2026 and is forecast to reach USD 95.56 billion by 2031 at 5.33% CAGR over 2026-2031. This trajectory highlights the sector’s ability to withstand new regulatory costs, energy price shocks, and supply chain volatility while unlocking opportunities through e-commerce expansion, increased recycling capacity, and stable food demand. Heightened EU mandates on recycled content now reward companies that can secure high-quality rPET at scale, giving vertically integrated players a cost edge. E-commerce parcel growth has increased demand for lightweight, protective packaging formats that strike a balance between material reduction and product safety. Rapid investment in AI-enabled sorting systems is narrowing the gap between recycled-material supply and brand-owner targets, while bio-based polymers attract capital as FMCG groups pursue fossil-free packaging. At the same time, volatile virgin-resin prices and differing national tax regimes oblige manufacturers to revise pricing strategies quickly or risk margin erosion.
Key Report Takeaways
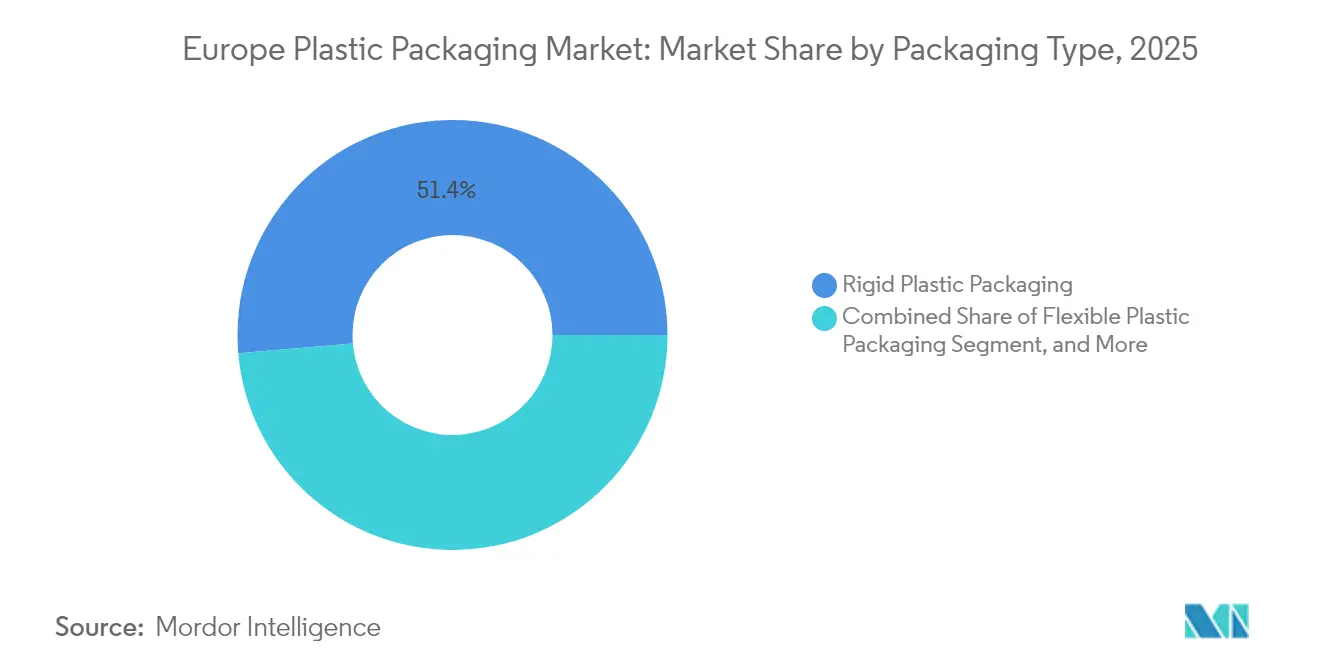
- By packaging type, the rigid plastic packaging segment accounted for 51.35% of the Europe plastic packaging market share in 2025.
- By material, the Europe plastic packaging market for bioplastics & bio-based plastics is expected to advance at an 10.95% CAGR between 2026-2031.
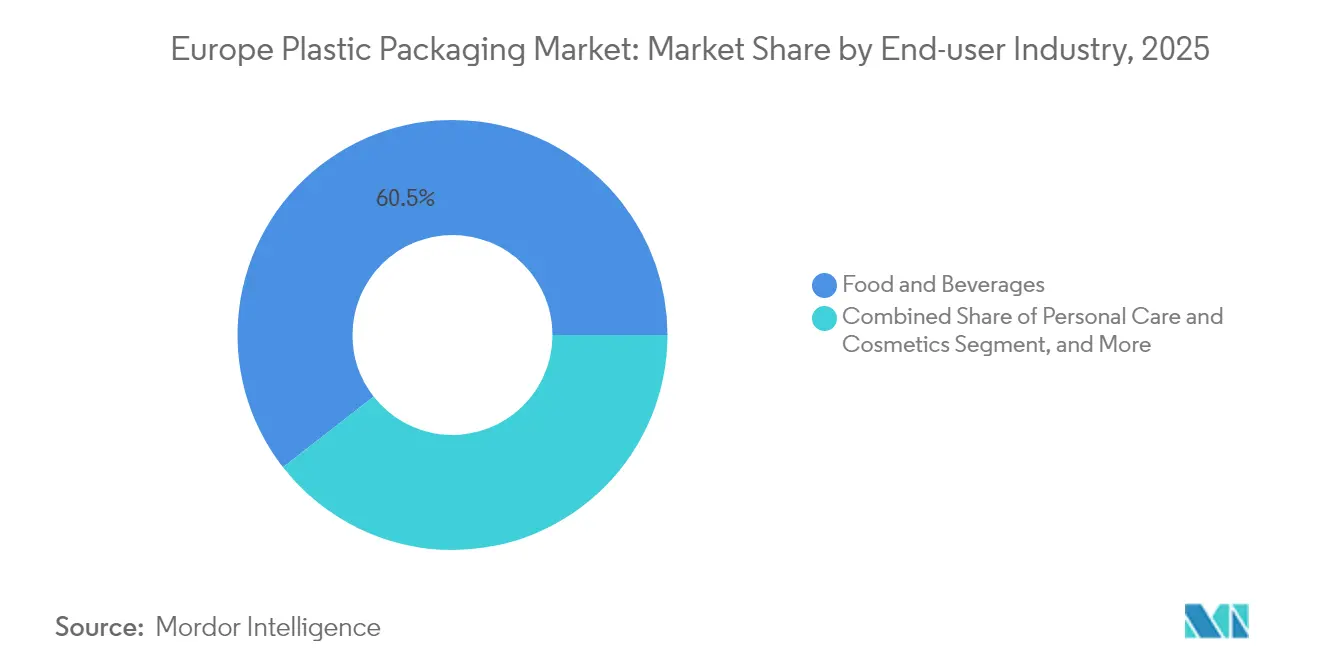
- By end-user industry, the food and beverages segment commanded 60.55% of the Europe plastic packaging market size in 2025.
- By geography, Germany held 23.75% of the European plastic packaging market share in 2025.
Note: Market size and forecast figures in this report are generated using Mordor Intelligence’s proprietary estimation framework, updated with the latest available data and insights as of 2026.
Europe Plastic Packaging Market Trends and Insights
Drivers Impact Analysis*
| Driver | % Impact on CAGR Forecast | Geographic Relevance | Impact Timeline |
|---|---|---|---|
| EU recycled-content mandates | +1.2% | EU-wide, strongest in Germany, Netherlands, Belgium | Medium term (2-4 years) |
| E-commerce demand for lightweight formats | +0.8% | Western Europe centric | Short term (≤ 2 years) |
| Food-grade rPET capacity in DACH | +0.6% | Germany, Austria, Switzerland | Medium term (2-4 years) |
| FMCG shift to mono-material pouches | +0.4% | Early adoption in Nordic countries | Long term (≥ 4 years) |
| AI-enabled high-yield sorting | +0.3% | Germany, Netherlands, France | Medium term (2-4 years) |
| Pharma cold-chain demand for rigid PET | +0.2% | Key pharma hubs across EU | Long term (≥ 4 years) |
| Source: Mordor Intelligence | |||
EU Packaging-Waste Targets Accelerating Recycled Content Mandates
The Packaging and Packaging Waste Regulation (PPWR), effective February 11, 2025, sets a 30% recycled-content threshold in PET food packs by 2030, establishing uniform compliance rules that favor large-scale recyclers. [1]PackagingLaw.com Staff, “The New EU Packaging and Packaging Waste Regulation—Highlights and Challenges Ahead,” packaginglaw.comEco-modulated EPR fees now tilt material-selection decisions toward easily recyclable designs, prompting companies such as ALPLA to lift Polish food-grade rPET output from 30,000 tpa to 54,000 tpa. The removal of PFAS in food contact layers deepens the need for alternative barrier technologies while reinforcing the competitive moat of firms with certified rPET capacity.
E-commerce Boom Boosting Lightweight Protective Formats
A structural surge in online shopping has increased parcel volumes and intensified pressure to reduce packaging weight per shipment. Brand owners are adopting mono-material cushions that cut material use by 25% yet safeguard products in high-velocity fulfillment networks. [2]Packaging Europe Editorial Team, “Recyclable Mono-Polypropylene Pouch Revealed by Capri-Sun,” packagingeurope.comPPWR rules that favor source-reduction dovetail with courier incentives to trim dimensional weight, amplifying demand for thin-gauge films and recyclable mailers produced by flexible-packaging converters.
Food-Grade rPET Capacity Expansions Across DACH Region
Producers in Germany, Austria, and Switzerland are adding tray-to-tray PET recycling loops to secure food-contact resin and mitigate import risk. Faerch’s Cirrec unit now processes the equivalent of 1.2 billion PET trays per year, helping close Europe’s 3.5 million-ton rPET gap. [3]Plasticker Reporters, “German Plastics Production 2024 Review,” plasticker.deDACH leadership in testing protocols and logistics makes the region a benchmark for circular rigid-packaging models.
FMCG Shift to Mono-Material Pouches for Curb-Side Collection
Global brands are replacing multilayer laminates with single-polypropylene structures that meet curb-side recycling criteria without sacrificing barrier performance. Capri-Sun’s PP pouch cuts CO₂ by 25% and exemplifies how redesign plus consumer acceptance can unlock scale for mono-material flexibles. Nordic nations supply proof points for collection efficacy, encouraging broader EU rollout.
Restraints Impact Analysis*
| Restraint | % Impact on CAGR Forecast | Geographic Relevance | Impact Timeline |
|---|---|---|---|
| Volatile virgin-resin prices | -0.9% | EU-wide, acute in Germany, Netherlands | Short term (≤ 2 years) |
| PPWR compliance-cost overhang | -0.6% | EU-wide with differing national burdens | Medium term (2-4 years) |
| Food-contact rPET scarcity | -0.4% | Severe in DACH | Medium term (2-4 years) |
| Anti-dumping duties on PET imports | -0.2% | Central and Eastern Europe | Long term (≥ 4 years) |
| Source: Mordor Intelligence | |||
Volatile Virgin Resin Prices Linked to Energy Crisis
Energy expense now consumes up to 70% of the cost of goods for some converters as natural-gas prices remain more than fourteen times their ten-year average, leading to production curtailments and 2,068 insolvencies in the German packaging sector in February 2025. The decoupling of virgin and recycled pricing complicates procurement hedges and shrinks working-capital buffers for SMEs.
PPWR Draft Creating Compliance-Cost Overhang
Mandatory design-for-recycling rules, recyclability certification, and new tracking systems oblige companies to accelerate R&D outlays at a time of tight liquidity. Smaller converters face steep learning curves for digital product passports and recycled-content verification, heightening consolidation risk.
*Our forecasts treat driver/restraint impacts as directional, not additive. The impact forecasts reflect baseline growth, mix effects, and variable interactions.
Segment Analysis
By Packaging Type: Established Rigid Leadership, Agile Flexible Growth
Rigid formats accounted for 51.35% of the European plastic packaging market share in 2025 thanks to their proven performance in dairy, pharma, and industrial chemicals. The European plastic packaging market size for rigid applications is projected to grow steadily as high-barrier PET and HDPE containers comply with strict shelf-life and safety norms. Consolidation, exemplified by Faerch’s purchase of PACCOR, is yielding scale efficiencies and reinforcing closed-loop tray recycling infrastructure. However, cost pass-through remains challenging when resin price spikes outpace customer contracts.
Flexible packaging trails in share yet leads in momentum, advancing at a 5.18% CAGR through 2031 as e-commerce and click-and-collect dominate retail logistics. Lightweight mailers, stand-up pouches, and mono-PE films help shippers cut freight emissions. The European plastic packaging market size for flexible formats gains additional lift from PPWR incentives that reward material minimization. Success depends on commercializing curb-side compatible mono-material films and securing supply of compatible recyclates to satisfy brand-owner pledges.


By Material Type: PET Dominates but Bio-Based Formats Accelerate
PET maintained a 28.65% share in 2025 because of its versatility, clarity, and extensive bottle-to-bottle recycling network. Yet rPET premiums, anti-dumping rules, and Asian import competition erode margins, prompting converters to diversify resin portfolios. The European plastic packaging market size tied to PET may plateau unless food-grade pellet supply expands in lockstep with PPWR quotas.
Bio-based polymers, including PLA and PHA, record the highest 10.95% CAGR as FMCG brands target carbon neutrality. Capacity ramp-ups from 2.4 million t in 2021 to 7.6 million t by 2026 illustrate investor confidence. Although higher priced than incumbents, bio-based resins attract end-users aiming to decouple from fossil-fuel volatility. Their drop-in compatibility with existing lines shortens adoption cycles, provided compostability labels align with local infrastructure.
By End-User Industry: Food Stability Meets E-commerce Disruption
Food and beverage brands represented 60.55% of demand in 2025, relying on mature supply chains and proven shelf-life validation. The European plastic packaging market size attached to food will continue to advance as chilled, ready-meal, and functional-beverage categories grow. Yet retailers now penalize excessive secondary packaging, nudging suppliers toward thinner films and high-recycled-content trays.
In contrast, e-commerce parcel volumes are climbing at a 9.12% CAGR through 2031, pushing converters to deliver shippable, frustration-free formats. Poly-mailers and inflatable cushions must endure rough handling while meeting recyclability checks at curb-side. Healthcare, cosmetics, and industrial components form resilient mid-sized subsectors where stringent regulatory or technical specs preserve value, albeit at slower growth trajectories than e-commerce.
Geography Analysis
Germany remains the anchor of the European plastic packaging market with a 23.75% share in 2025, supported by EUR 100 billion in annual plastics turnover and 310,000 employees. However, elevated power tariffs and recessionary consumer demand limited 2024 production growth to 3% and drove a 3% revenue drop to EUR 26.7 billion. For 2025, a 0.5% output contraction is expected as converters rationalize capacity and accelerate renewable-energy sourcing. Despite these headwinds, Germany’s dense network of 28 chemical parks and over 40 clusters continues to attract R&D in barrier technologies and AI-sorting pilots.
Poland exhibits the fastest growth at a 6.65% CAGR thanks to its USD 688 billion food-processing base and a retail packaged-food channel forecast to hit USD 50.3 billion by 2028. Foreign investors such as Saica Group have entered via acquisitions that add corrugating and converting scale, signaling confidence in sustained volume expansion. Nonetheless, Poland’s collection infrastructure lags Western peers, prompting the government to levy fees on plastic takeaway packs as an interim waste-management measure.
Elsewhere, the United Kingdom, France, Italy, Spain, and Russia comprise sizable but heterogeneous demand pools. The Netherlands leads on fossil-free packaging goals, while Belgium attains 79.2% recycling rates. Nordic countries, leveraging advanced fiber-based innovations and deposit systems, outperform on circularity metrics. Across Europe, total packaging value is poised to rise from EUR 153 billion in 2024 to EUR 186 billion by 2029, with sustainability directives catalyzing capital spending on recyclate procurement, barrier-coating upgrades, and digital tracking.
Regulatory Landscape
Packaging regulation in Europe is being reset by Regulation (EU) 2025/40 on Packaging and Packaging Waste (PPWR), which entered into force on 11 February 2025 and is scheduled to apply generally from 12 August 2026, replacing Directive 94/62/EC. The regulation raises EU-wide requirements on packaging minimisation, design-for-recycling, and recycled-content uptake, shifting compliance from country-by-country interpretation toward a more harmonised rulebook supported by European Commission secondary legislation.
Implementation is being shaped through clarifications and technical acts issued during 2026. In March 2026, the European Commission released guidance and an FAQ to support consistent interpretation by member states and economic operators, and the PPWR also sets 12 August 2026 as the deadline for implementing acts establishing a harmonised label for packaging (Article 12(6)). This affects packaging artwork, on-pack communication, and the data alignment needed for packaging placed on the EU market.
Value Chain Analysis
The European plastic packaging value chain starts with petrochemical and bio-based polymer producers, moves through compounders and converters (rigid and flexible), and then reaches brand owners and retailers via logistics channels. After use, post-consumer collection, sorting, and recycling systems produce secondary raw materials, including rPET, rHDPE, and rPP. With PPWR-linked requirements, the chain needs tighter coordination, since recycled-content claims and design-for-recyclability depend on alignment between material selection, converting specifications, and the capabilities of collection and sorting networks.
Standardisation and reporting methodology are increasingly acting as cross-chain nodes alongside physical production assets. CEN/TC 261 published the EN 18120:2026 series on 24 June 2026 to provide a common technical framework for assessing recyclable plastic packaging, reducing fragmentation in design-for-recycling criteria across the EU. On 30 June 2026, Commission Implementing Decision (EU) 2026/1425 introduced rules for calculating, verifying, and reporting recycled plastic content in single-use plastic beverage bottles, including mass balance accounting for non-mechanical recycling routes. This influences how advanced recycling output can be contracted, certified, and booked into brand owners recycled-content portfolios.
Competitive Landscape
The European plastic packaging market features moderate fragmentation but is trending toward consolidation as compliance costs soar. Amcor’s all-stock merger with Berry Global will create a global giant targeting USD 650 million in annual synergies and USD 180 million in combined R&D, illustrating the scale imperative. Larger entities are best placed to absorb the expense of PPWR audits, digital product passports, and renewable-energy transitions.
Technology leadership has emerged as a key differentiator. Early adopters of AI-driven sortation enjoy superior yield and access to high-grade recyclates that command brand-owner premiums. DS Smith’s TailorTemp launch demonstrates how innovation in temperature-controlled fiber-based packs can open high-margin pharma channels. Similarly, partnerships such as Amcor-NOVA Chemicals on mechanically recycled PE help lock in feedstock and satisfy 30% recycled-content pledges.
At the same time, smaller regional converters face margin pressure from resin cost swings and capital-intensive upgrades. Many are exploring niche plays in decorative finishes, short-run digital printing, or specialty dispensing to avoid direct competition with integrated majors. The race to secure food-contact rPET remains intense; firms without captive capacity often sign multiyear offtake agreements or pursue joint ventures with recyclers to guarantee supply.
Europe Plastic Packaging Industry Leaders
Amcor PLC
Sealed Air Corporation
Mondi Group
ALPLA Werke GmbH
Huhtamaki Oyj
- *Disclaimer: Major Players sorted in no particular order


Market Opportunities and Future Outlook
PPWR application from 12 August 2026 creates a near-term gap for compliance-ready packaging systems that combine measurable recycled content, design-for-recycling evidence, and harmonised communication across the consumer and waste-management chain. The June 2026 Commission Implementing Decision (EU) 2026/1425 also formalises how recycled plastic content in single-use plastic beverage bottles is calculated and verified, including mass balance for non-mechanical recycling. That framework widens contracting pathways between advanced recyclers, polymer suppliers, and packaging converters that need auditable recycled-content inputs.
Investment and M&A activity around mono-material and circular-ready films and polyolefins is also shaping opportunity in 2026. Coveris completed the acquisition of German film maker GEFO Folienbetrieb GmbH in June 2026 to expand cast polypropylene (CPP) film production for recyclable mono-material packaging. Borealis announced a EUR 49 million investment at its Burghausen, Germany facility in January 2026 to scale Borstar Nextension polypropylene technology, supporting downgauging and design-for-circularity formulations. Alongside these moves, EN 18120:2026 published in June 2026 provides a clearer technical reference for designing and qualifying recyclable plastic packaging, helping brand specifications, converter structures, and recyclability assessment criteria converge across Europe.
Recent Industry Developments
- July 2026: Amcor partnered with UK start-up Kelpi to evaluate seaweed-based barrier coatings for fiber-based packaging applications. The work targets scalable barrier performance while reducing reliance on fossil-derived coatings, aligning with brand-owner and regulatory pressure to improve packaging circularity and end-of-life outcomes.
- February 2025: DS Smith launched TailorTemp, a recyclable temperature-controlled pack designed to keep pharmaceutical products cool for up to 36 hours while reducing CO2 versus conventional alternatives. The launch strengthens the case for higher-value protective and cold-chain formats as healthcare packaging specifications tighten and sustainability screening becomes more explicit in procurement.
- November 2024: DS Smith announced a EUR 34 million capacity expansion in Hungary focused on automation and sustainability upgrades. The investment adds regional converting capability and productivity improvements, supporting faster service levels for FMCG and e-commerce demand while increasing the efficiency of packaging production in Central Europe.


Research Methodology Framework and Report Scope
Market Definition and Coverage
We define the Europe plastic packaging market as the value of plastic-based packs sold for protecting, storing, and transporting products across major end uses in Europe, covering rigid and flexible formats across common polymer types.
Scope exclusions: Paper, glass, and metal packaging, along with standalone recycling services that are not sold as packaging products, are excluded.
Segmentation Overview
- By Packaging Type
- Rigid Plastic Packaging
- Flexible Plastic Packaging
- Industrial & Bulk Plastic Packaging
- By Material Type
- PET
- Polyethylene (HDPE, LDPE, LLDPE)
- Polypropylene
- Polystyrene & EPS
- PVC
- Bioplastics & Bio-based Plastics
- Recycled Plastics (rPET, rHDPE, rPP)
- By End-user Industry
- Food & Beverages
- Personal Care & Cosmetics
- Healthcare & Pharmaceuticals
- Household & Industrial Chemicals
- E-commerce & Retail Fulfilment
- Automotive & Industrial Components
- Geography (Country Level)
- Germany
- United Kingdom
- France
- Italy
- Spain
- Russia
- Netherlands
- Poland
- Sweden
- Norway
- Denmark
- Finland
- Belgium
- Austria
Data Sources, Market Sizing, and Validation
Desk Research
Desk research was used to build the fact base on how packaging demand moves with food, beverage, pharma, and household consumption in Europe, and to keep the model grounded in observable volumes and trade flows. We relied on public sources such as Eurostat for industrial production and trade series, the European Commission for packaging and waste policy signals, and EEA publications for recycling and packaging-waste context.
To make the packaging math more realistic, we also reviewed national statistics office outputs for manufacturing volumes, customs and trade portals for import and export movements, and peer reviewed journals for material substitution and rPET usage trends. Company annual reports, investor decks, and reputable press were used to cross-check capacity additions, pricing commentary, and shifts in product mix. In addition, a paid subscription for company financials and a shipment-level trade database were used selectively to validate revenue direction and country trade patterns. These desk sources are not exhaustive, and other public references were also used for data collection, validation, and clarification.
Primary Interviews and Surveys
Primary work focused on interviews and structured surveys with packaging producers, converters, resin and recycled-content suppliers, brand owners, and distribution channel participants across Europe. We used these inputs to confirm mix splits between rigid and flexible, typical pricing behavior by polymer, and how regulation affects downgauging, recycled-content adoption, and format switches, which then tightened assumptions where public data was thin.
Distribution of primary research fieldwork respondents
| Company type | Respondent position |
|---|---|
| Top tier: 30% | CXOs: 15% |
| Mid tier: 55% | Functional/Unit leaders: 38% |
| Smaller Players: 15% | Managers: 47% |
Market-Sizing & Forecasting
Sizing started with a top-down reconstruction of the Europe demand pool by linking packaging consumption to end-use output and trade signals, and then translating that into value using observed pricing ranges by format and polymer. The totals were then corroborated with selective bottom-up approximations, where supplier and converter revenue checkpoints, sampled ASP times volume logic, and channel checks were used to adjust any over- or under-shoot.
Several market indicators were especially helpful, including the rigid versus flexible mix, the shift of resin mix toward PET and recycled PET in certain applications, the share of food and beverage in total packaging demand, and the direction of lightweighting (which changes volume-to-value relationships). Country-level production and import/export movements were used as sanity checks, since packaging demand tends to track local manufacturing and cross-border supply. For forecasting, we used scenario analysis supported by trend lines in key drivers like packaged food output, e-commerce shipment intensity, recycled-content adoption rates, and energy-related cost pass-through behavior, which was validated in interviews. Where bottom-up checkpoints were missing for smaller geographies or niche formats, gaps were handled through ratio-based allocations tied to country output and confirmed mix splits, then reviewed again before finalizing.
Data Validation & Update Cycle
Outputs were validated through multiple checks, since no single dataset fully explains this market. We compared model results against independent signals such as trade direction, packaging production trends, and practical pricing bands shared by industry participants, then reworked any country or material outliers that did not match the overall pattern in the data.
Before sign-off, the work goes through step-by-step analyst reviews that focus on unit consistency, currency timing, and variance versus recent historical patterns, followed by targeted re-contacts when a key assumption shifts. Reports are refreshed annually, with interim updates when major policy changes, energy shocks, or recycled-content mandates materially change assumptions. Right before delivery, a final freshness pass is completed so clients receive the latest updated view.
Mordor Intelligence's Europe Plastic Packaging Market Size Compared With Other Published Estimates
Published market sizes for Europe plastic packaging can differ even when they appear to refer to the same coverage, because the underlying scope and price logic are not always aligned. Differences typically come from what is counted as packaging, how recycled-content and industrial formats are treated, and whether the estimate is anchored to end-use demand signals or to a broader supply-side view.
The main gap comes from format and scope expansion, where Mordor Intelligence counts plastic packaging value across defined rigid and flexible formats in Europe while keeping non-packaging waste services and adjacent materials outside the number, and some estimates appear to fold in wider packaging value pools or policy-led projections without the same format-level checks.
Benchmark comparison
| Source | Market Size | Gaps in Research Methodology |
|---|---|---|
| Mordor Intelligence | USD 70 B (2025) | |
| Regional Consultancy A | USD 98.84 B (2025) | Likely uses a broader revenue pool that can blend plastic packaging with wider packaging value chains and more expansive country coverage assumptions, which can inflate totals if format boundaries and non-packaging services are not separated. |
| Trade Publisher B | USD 110.78 B (2025) | Appears to be policy narrative-led and may apply higher value assumptions and aggressive adoption curves for sustainability-driven shifts, which can move the 2025 starting point upward if pricing and mix are not validated against observed trade and converter realities. |
The spread in these figures is mainly explained by what gets included and how value is translated from volumes, not by a single demand driver. By keeping scope tied to identifiable packaging formats and checking output against real-world mix and price signals, the final estimate stays traceable and consistent even when public data is uneven across countries.


Key Questions Answered in the Report
How large is the European plastic packaging market in 2026?
The sector is valued at USD 73.73 billion in 2026 and is expected to reach USD 95.56 billion by 2031, growing at a 5.33% CAGR.
Which packaging type dominates demand?
Rigid formats lead with 51.35% share because of their suitability for dairy, pharma, and chemical products, although flexible formats are growing faster at a 5.18% CAGR.
Why is PET facing supply challenges despite high demand?
Food-grade rPET supply lags regulatory targets, commanding premiums and encouraging investments such as ALPLA’s expansion in Poland to bridge the gap.
What makes Poland the fastest-growing market in Europe?
Strong food-processing output and rising packaged-food retail sales, combined with foreign manufacturing investment, are driving a 6.65% CAGR.
Page last updated on:


 Your data is secure and never sold or shared.


