
Market Overview
| Study Period | 2020 - 2031 |
|---|---|
| Forecast Data Period | 2026 - 2031 |
| Base Year Market Size (2025) | USD 45.18 Billion |
| Market Size (2026) | USD 47.42 Billion |
| Market Size (2031) | USD 60.38 Billion |
| Growth Rate (2026 - 2031) | 4.95 % |
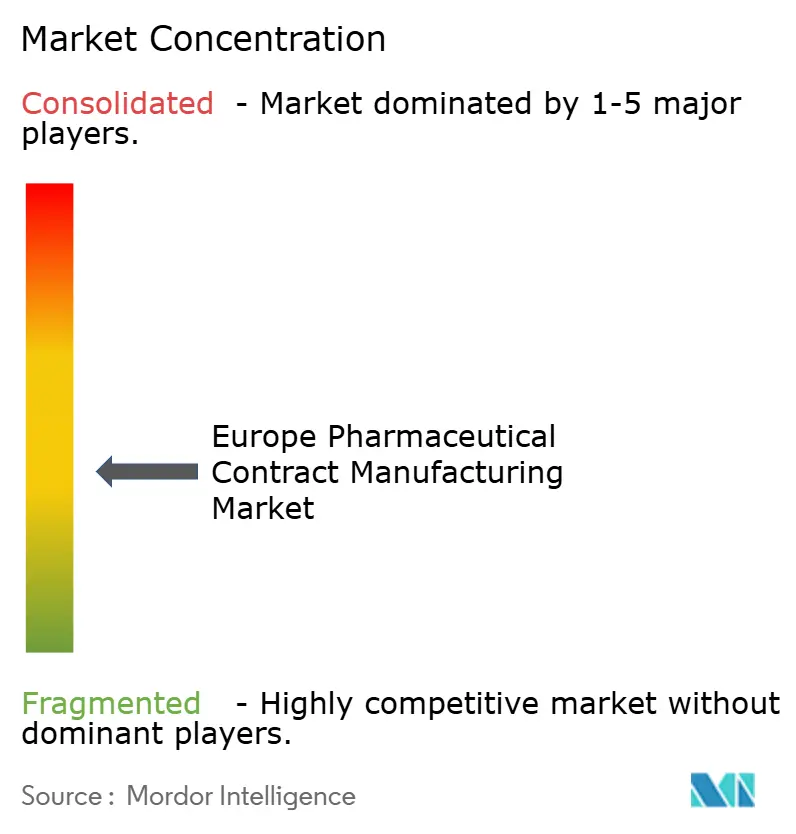
| Market Concentration | Medium |
Major Players *Disclaimer: Major Players sorted in no particular order Image © Mordor Intelligence. Reuse requires attribution under CC BY 4.0. | |
Europe Pharmaceutical Contract Manufacturing Market Analysis by Mordor Intelligence
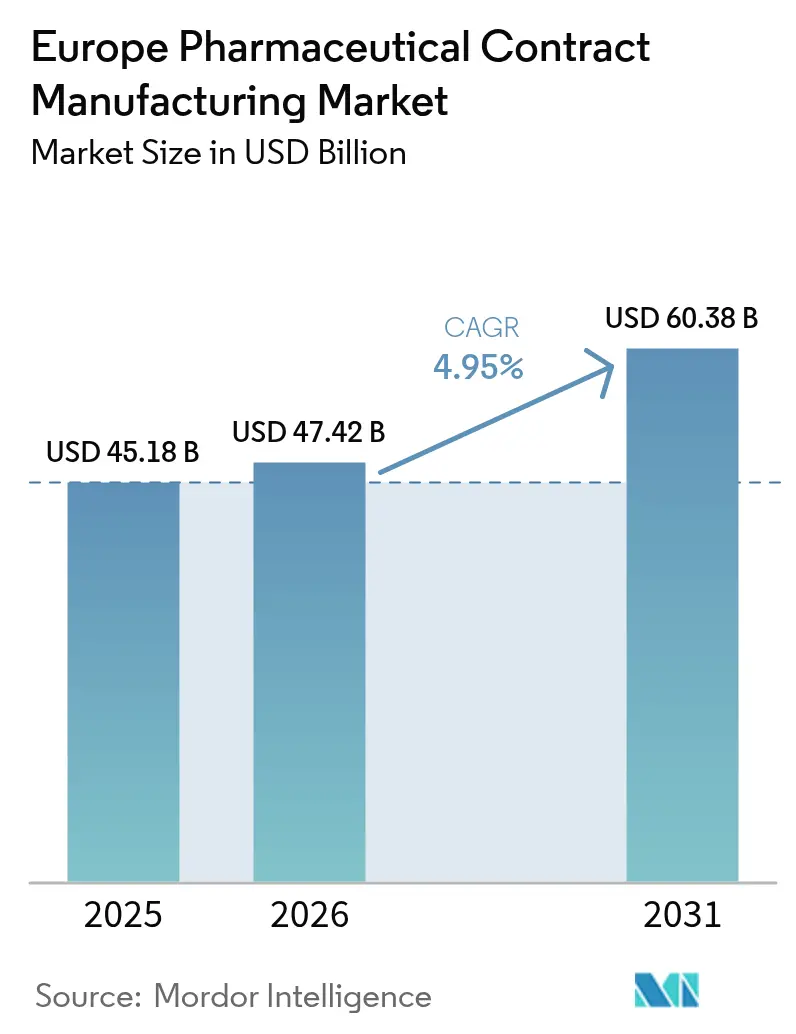
The pharmaceutical contract manufacturing market size in Europe was valued at USD 45.18 billion in 2025 and estimated to grow from USD 47.42 billion in 2026 to reach USD 60.38 billion by 2031, at a CAGR of 4.95% during the forecast period (2026-2031). Steady outsourcing by large and mid-size drug makers, combined with regulatory initiatives such as the EU Health Technology Assessment Regulation, continues to elevate demand for specialized biologics and highly potent API capacity across the region. Active Pharmaceutical Ingredient (API) manufacturing remains the cornerstone revenue contributor, while finished dosage formulation (FDF) projects accelerate on the back of innovative delivery formats and serialization mandates. Germany retains its position as the primary production hub, yet Spain’s incentive-rich environment is catalyzing the fastest expansion in manufacturing footprints. Strategic acquisitions, typified by Lonza’s purchase of Roche’s Vacaville site and Catalent’s integration into Novo Holdings, have reinforced integrated service platforms that compress development timelines and broaden one-stop-shop capabilities.
Key Report Takeaways
- By service type, API manufacturing led with 42.02% of the pharmaceutical contract manufacturing market share in 2025, whereas FDF services are growing at a 6.67% CAGR through 2031.
- By molecule type, small molecules accounted for 58.12% of the pharmaceutical contract manufacturing market size in 2025; highly potent APIs are projected to expand at a 7.02% CAGR to 2031.
- By therapeutic area, oncology held 28.31% revenue share in 2025, while respiratory applications registered the highest forecast CAGR at 5.91% through 2031.
- By development phase, commercial manufacturing controlled 46.11% of the pharmaceutical contract manufacturing market share in 2025, yet Phase II clinical work is growing at a 7.1% CAGR to 2031.
- By end-client type, Big Pharma commanded 50.88% share in 2025, whereas small and mid-size pharma engagements are rising at a 6.88% CAGR through 2031.
- By geography, Germany captured 22.41% share of the pharmaceutical contract manufacturing market size in 2025; Spain is advancing at 6.92% CAGR between 2026-2031.
Note: Market size and forecast figures in this report are generated using Mordor Intelligence’s proprietary estimation framework, updated with the latest available data and insights as of 2026.
Market Trends and Insights
Drivers Impact Analysis of Europe Pharmaceutical Contract Manufacturing Market*
| Driver | (~) % Impact on CAGR Forecast | Geographic Relevance | Impact Timeline |
|---|---|---|---|
| Increasing outsourcing volume by EU pharma majors | +1.2% | Germany, France, UK core markets | Medium term (2-4 years) |
| Growing biologics and HPAPI pipeline complexity | +1.8% | Global, concentrated in Germany and Switzerland | Long term (≥ 4 years) |
| Contract-friendly EU tax incentives and grants | +0.9% | Spain, Italy, Eastern Europe focus | Short term (≤ 2 years) |
| CDMO M&A unlocking one-stop-shop capabilities | +1.1% | Pan-European with UK-Germany axis | Medium term (2-4 years) |
| On-demand manufacturing tech gaining traction | +0.7% | Germany, Netherlands, Denmark leaders | Long term (≥ 4 years) |
| Near-shoring driven by supply-chain security clauses | +0.6% | EU-wide, particularly Eastern Europe | Medium term (2-4 years) |
| Source: Mordor Intelligence | |||
Growing Biologics and HPAPI Pipeline Complexity
Rising demand for monoclonal antibodies, bispecifics, and antibody-drug conjugates is pushing CDMOs to invest in large-scale single-use bioreactors, high-containment suites, and advanced purification trains that few facilities can match. [1] Samsung Biologics’ USD 1.4 billion multiyear contract with a European sponsor and the 180,000-liter expansion of Plant 5 exemplify the premium tied to specialized capacity. Digital twin systems are being deployed across European plants to enable predictive maintenance and real-time batch analytics, reducing failure rates and shortening tech-transfer cycles. These capital-heavy upgrades raise barriers to entry, concentrating pharmaceutical contract manufacturing market capacity among a handful of technologically advanced providers. As biologic payloads gain potency, compliance with updated EU GMP Annex 1 standards further differentiates operators equipped with isolators, restricted-access barrier systems, and robust contamination control strategies.
Increasing Outsourcing Volume by EU Pharma Majors
Regional drug makers continue divesting non-core sites while locking in long-term supply agreements with CDMOs that can ensure capacity, quality, and regulatory alignment. Sanofi’s facility transfer to Thermo Fisher illustrates a broader pivot that allows originators to redeploy capital toward R&D and commercialization. The Critical Medicines Act encourages multi-site European production to mitigate supply risks, prompting pharmaceutical companies to split portfolios across several contract partners. Outsourcing decisions now extend beyond cost, encompassing cyber-resilient data exchange, serialization compliance, and post-approval change management support. CDMOs that can bundle early-phase development, tech transfer, commercial supply, and regulatory liaison functions benefit from higher wallet share and deeper client lock-in.
Contract-friendly EU Tax Incentives and Grants
The EUR 1 billion IPCEI Med4Cure initiative and other country-level tax credits reduce payback periods on green-field biologics and sterile-fill investments. [2] Spain’s fiscal incentives are directly linked to its 7.01% CAGR leadership, enabling mid-tier CDMOs to upgrade containment lines for highly potent formulations. Clean Industrial Transition grants favor continuous-manufacturing installations that lower carbon footprints and energy intensity. Incentive structures also encourage collaborations between academia and CDMOs, accelerating technology adoption in niche modalities such as nucleic acid therapeutics and peptidomimetics.
CDMO M&A Unlocking One-Stop-Shop Capabilities
Ownership shifts have produced integrated networks capable of hosting discovery chemistry, IND-enabling toxicology, process development, and global commercial supply under unified quality systems. The consolidation wave compresses vendor lists for pharmaceutical sponsors seeking coordinated global launches, while also driving harmonization of digital quality-management platforms. Post-merger entities are investing in end-to-end data lakes that amalgamate batch, deviation, and release metrics, enabling AI-driven process control and predictive release testing. This scale and data integration underpin higher service premiums and foster entry barriers for stand-alone niche providers.
Restraints Impact Analysis of Europe Pharmaceutical Contract Manufacturing Market*
| Restraint | (~) % Impact on CAGR Forecast | Geographic Relevance | Impact Timeline |
|---|---|---|---|
| Rising EU energy prices pressuring margins | -0.6% | Germany, Netherlands, Belgium most affected | Short term (≤ 2 years) |
| Capacity utilisation gaps in small-molecule plants | -0.4% | UK, Italy, France legacy facilities | Medium term (2-4 years) |
| Talent shortage in aseptic processing specialists | -0.5% | Germany, Switzerland, UK core markets | Long term (≥ 4 years) |
| Inflation-linked CDMO input contracts limiting price passthrough | -0.3% | Pan-European, particularly smaller CDMOs | Short term (≤ 2 years) |
| Source: Mordor Intelligence | |||
Rising EU Energy Prices Pressuring Margins
Escalating power tariffs have added close to EUR 1 billion in incremental annual costs for European generics manufacturers alone. [3] Energy-intensive unit operations such as lyophilization and high-temperature HPAPI syntheses face acute margin compression, especially in Germany, where industrial electricity prices remain elevated. CDMOs respond by accelerating heat-recovery retrofits, procuring long-term renewable-energy PPAs, and piloting continuous processes that lower energy per kilogram output. Smaller providers lacking capital for energy-efficiency upgrades risk being priced out of competitive bids.
Capacity Utilization Gaps in Small-Molecule Plants
Legacy batch reactors built for blockbuster volumes are increasingly under-loaded as pipelines tilt toward niche oncology and orphan therapies. The capital required to retrofit continuous-flow or high-potency suites often exceeds available cash flows for facilities in Italy, France, and the UK. As utilization dips below the 60% break-even mark, owners resort to either niche-service pivots (e.g., controlled-substance APIs) or consolidation. CDMOs with modern multipurpose assets pick up incremental demand, reinforcing the shift in pharmaceutical contract manufacturing market revenue toward agile, high-containment providers.
*Our forecasts treat driver/restraint impacts as directional, not additive. The impact forecasts reflect baseline growth, mix effects, and variable interactions.
Europe Pharmaceutical Contract Manufacturing Market Segment Analysis
By Service Type:
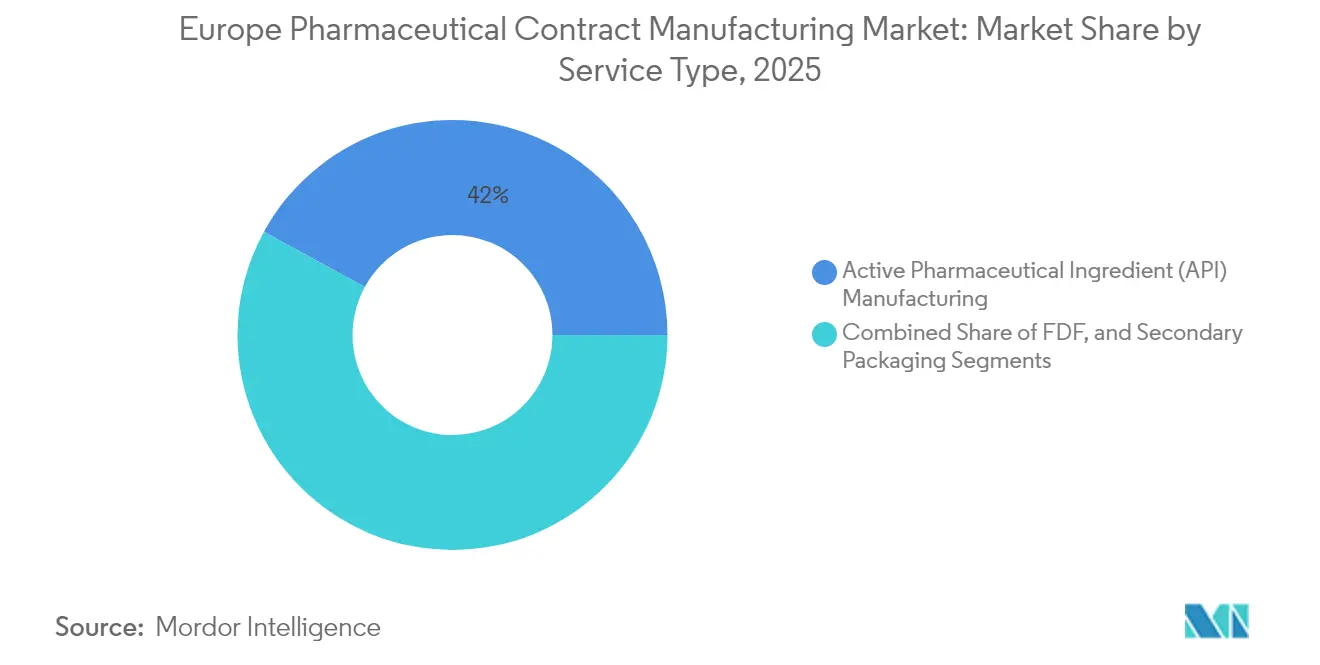
API Manufacturing Leads Despite FDF GrowthAPI manufacturing contributed 42.02% of 2025 revenue, underlining its anchor role in the pharmaceutical contract manufacturing market size. Projects involve complex multi-step chemistries, biocatalysis, and high-containment work that sustain premium pricing. Recent demand spikes in antiviral and oncology payloads have pushed European CDMOs to debottleneck kilolab through commercial kilo-scale assets while integrating real-time release testing to curtail cycle times.
FDF work, though currently smaller, is projected to outpace overall market growth at 6.67% CAGR on the back of patient-friendly oral thin films, autoinjectors, and inhaled formulations. Serialization rules under the Falsified Medicines Directive drive added packaging revenues, while Annex 1’s sterile-drug revisions prompt investments in isolator-based filling lines. The interplay between bulk-drug and dosage manufacturing strengthens bundled contracting, further consolidating pharmaceutical contract manufacturing market opportunities within multi-service providers.

By Molecule Type:
Small Molecules Dominate While HPAPI Commands PremiumThe pharmaceutical contract manufacturing market share for small molecules stood at 58.12% in 2025, reflecting Europe’s entrenched synthetic-chemistry heritage and extensive reactor infrastructure. Continuous-flow retrofits have trimmed solvent consumption and cycle times, helping older assets remain competitive amid escalating energy costs.
Highly-potent API programs grow at 7.02% CAGR as oncology and targeted therapies proliferate. Investments in negative-pressure suites, glove-box isolators, and advanced dust-collection systems are mandatory to meet Occupational Exposure Limit thresholds below 10 µg/m³. Large-molecule biologics projects command longer timelines but deliver durable revenue streams due to multi-year tech-transfer complexity and higher regulatory scrutiny, reinforcing the blended portfolio approach of leading CDMOs.
By Therapeutic Area:
Oncology Leadership Faces Respiratory ChallengeOncology retained 28.31% share of 2025 demand, driven by continuous innovation in cytotoxics, antibody-drug conjugates, and checkpoint inhibitors. Specialized containment, high-pressure chromatography, and toxin-linker chemistries define the capability moat in this segment.
Respiratory therapeutics, expected to grow at 5.91% CAGR, benefit from pandemic-accelerated investments in inhalable biologics and next-generation dry-powder devices. CDMOs with integrated device-drug assembly lines can command higher margins, expanding the pharmaceutical contract manufacturing market footprint into combination-product territory.
By Development Phase:
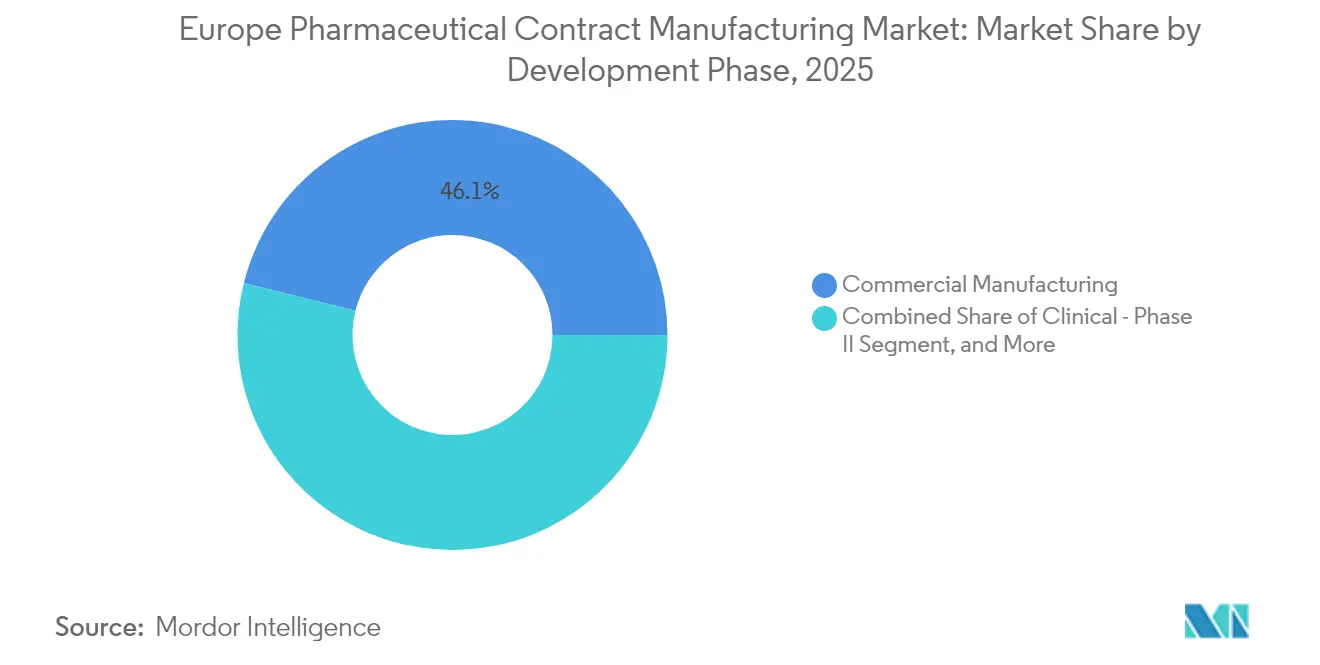
Commercial Manufacturing Dominance Challenged by Clinical GrowthCommercial supply still accounts for 46.11% of the pharmaceutical contract manufacturing market size, reflecting mature brands and biosimilar volumes. Multi-year supply contracts stabilize cash flows, allowing CDMOs to finance capacity upgrades for emerging modalities.
Phase II programs, growing at 7.1% CAGR, signal a vibrant biotech funding environment and faster regulatory feedback loops. Flexible single-use bioreactors and modular cleanrooms enable CDMOs to switch between pilot and low-volume commercial batches, reducing scale-up risk and aligning capacity with demand uncertainty.
By End-Client Type:
Big Pharma Stability Meets Mid-Size InnovationBig Pharma held 50.88% of 2025 revenue by leveraging preferred-provider arrangements that secure slot reservations across multiple sites. These clients push for integrated digital quality systems and global change-control harmonization.
Small and mid-size pharma companies, growing at a 6.88% CAGR, increasingly outsource complex chemistry and biologics as they focus on asset-light discovery models. CDMOs offering development-through-commercial continuity gain share, reinforcing a virtuous cycle of capacity expansion and deeper expertise within the pharmaceutical contract manufacturing market.
Geography Analysis
Germany Pharmaceutical Contract Manufacturing Market
Germany generated 22.41% of 2025 revenue, anchored by deep chemical engineering talent, stringent regulatory oversight, and proximity to industry headquarters. However, elevated energy costs are forcing operators to accelerate efficiency retrofits, negotiate renewable-energy PPAs, and pilot continuous manufacturing to safeguard gross margins.
Spain and LATAM Pharmaceutical Contract Manufacturing Market
Spain, clocking a 6.92% CAGR, leverages aggressive tax breaks, streamlined construction permits, and access to Spanish-speaking workforce pools for expansion into Latin American supply chains. CDMOs cluster around Catalonia and Madrid, focusing on biologics fill-finish and inhalation products, thereby broadening the pharmaceutical contract manufacturing market reach into emerging segments.
Broader European Markets
The UK, France, Italy, and Eastern Europe collectively account for the remaining share. Post-Brexit UK maintains MHRA alignment with EU GMP, enabling seamless batch release into the single market via mutual recognition pathways. France benefits from over EUR 1.87 billion in 2024-2025 investments by major innovators to expand monoclonal antibody output. Italy exploits mature generics expertise and competitive labor costs, while Poland, Hungary, and Czechia attract brown-field conversions of legacy plants into high-containment suites supported by EU structural funds.
Regulatory Landscape
European pharmaceutical contract manufacturing is governed by EU GMP and national inspectorates, with the European Medicines Agency (EMA) coordinating EU-level quality and compliance expectations for centrally authorised products. In March 2026, the EMA launched the Pharmaceutical Quality System (PQS) effectiveness pilot project for EEA manufacturers, aligned to PIC/S guidance for risk-based change management, shifting inspections toward demonstrated PQS performance rather than checklist compliance; applications remain open until 31 December 2026 and inspections can run through 1 March 2027.
Regulatory change-control and lifecycle requirements also tightened in 2026 through the application of the revised variations framework for marketing authorisations, shaping how CDMOs and sponsors manage post-approval manufacturing and site changes. In parallel, the EU pharmaceutical legislation reform agenda and Council-level discussions have included procurement concepts tied to supply security and incentives for manufacturing within the Union, strengthening dual-sourcing, near-shoring, and documentation readiness as commercial differentiators in CDMO selection.
Value Chain Analysis
The value chain begins with sourcing raw materials, intermediates, excipients, and primary packaging components, then moves into process development, clinical and commercial API manufacturing, and drug product manufacturing (including sterile fill-finish where applicable), followed by secondary packaging and release. Across Europe, qualified person (QP) release and EU GMP compliance act as gating steps that influence site choice, tech transfer timelines, and the degree of vertical integration offered by CDMOs, particularly for biologics and HPAPI programs that require specialized containment and validated contamination control strategies.
Downstream, market authorisation and product-information obligations shape packaging operations and data flows. For centrally authorised products, the EMA runs formal checking processes for packaging mock-ups and specimens, while safety features under the Falsified Medicines Directive and Delegated Regulation (EU) 2016/161 make serialization and tamper-evidence integral to outsourced secondary packaging. The shift to structured product data submission via ISO IDMP-aligned Product Management Services (PMS), including pack-size information for the Union List of Critical Medicines with a June 2026 deadline, adds a compliance-driven coordination layer between sponsors, CDMOs, and packaging partners. Providers that combine manufacturing, packaging, and regulatory data readiness under one quality system gain incremental value.
Competitive Landscape
European CDMOs exhibit moderate consolidation, with the top five providers controlling just over 50% of total revenues. Lonza’s USD 1.2 billion Vacaville site purchase expands large-scale mammalian capacity, while Catalent’s integration into Novo Holdings accelerates capital deployment into continuous-manufacturing lines and advanced delivery technologies.
Technology remains the core differentiator. Operators are adopting MES-integrated continuous chromatography, PAT-enabled in-line release, and cloud-based deviation analytics to shorten cycle times and slash rework. Digital twins underpin predictive maintenance that boosts asset uptime by 8-12%, directly improving capacity availability within the pharmaceutical contract manufacturing market.
White-space opportunities persist in cell and gene therapy viral-vector manufacturing, high-potency oral solids, and sterile-lyophilized biologics. Smaller, agile entrants focus on modular clean-room pods and micro-batch continuous reactors, positioning themselves as overflow partners for large CDMOs. The ability to manage dual-sourcing mandates and navigate diverse EU subsidy regimes remains pivotal for sustained growth.
Europe Pharmaceutical Contract Manufacturing Industry Leaders
-
Fareva Holding SA
-
Recipharm AB
-
Boehringer Ingelheim Group
-
Aenova Group
-
Famar SA
- *Disclaimer: Major Players sorted in no particular order
Europe Pharmaceutical Contract Manufacturing Market Companies Covered in this Report
- Lonza Group Ltd
- Recipharm AB
- Catalent Inc
- Fareva Holding SAS
- Aenova Group GmbH
- Boehringer Ingelheim Pharma GmbH & Co. KG
- Siegfried Holding AG
- Almac Group Ltd
- Famar SA
- Cenexi SAS
- Eurofins CDMO S.A.
- Thermo Fisher Scientific Inc (Patheon)
- Samsung Biologics Co., Ltd
- Baxter BioPharma Solutions LLC
- Delpharm SAS
- Polpharma Biologics S.A.
- IDT Biologika GmbH
- Rentschler Biopharma SE
- Alcami Corporation
- Novasep Holding SAS
Read Analysis of Europe Pharmaceutical Contract Manufacturing Companies
Market Opportunities and Future Outlook
An opportunity area is emerging at the interface of manufacturing and packaging for injectables and temperature-sensitive biologics, where sponsors look to reduce handoffs, secure integrated cold-chain warehousing, and use packaging formats such as pre-filled syringes and device assembly. This is reinforced by ongoing capacity investments in Europe: Sharp Services announced a EUR 20 million program to expand injectables packaging at its facilities in Hamont-Achel (Belgium) and Heerenveen (Netherlands), and Aenova expanded automated semi-solid tube packaging capacity at Feldkirchen (Germany) to a minimum annual capacity of 50 million tubes. Together, these moves point to customer demand for high-throughput, automated packaging linked to regulated release requirements.
Regulatory-driven lifecycle management also creates whitespace for CDMOs that can operationalize post-approval change management and structured data exchange alongside manufacturing. The EMA implemented the Product Lifecycle Management (PLCM) document tool effective 15 January 2026 to support harmonized handling of CMC changes, and the EMA adopted a Guideline on the chemistry of active substances (effective 01 September 2026) that elevates expectations for active substance chemistry and related quality documentation, with knock-on impacts for container-closure and packaging controls. Providers that bundle regulatory documentation support, QP release, and serialization-capable packaging with API/FDF execution are positioned to take on more outsourced scope as sponsors rationalize vendor lists and tighten supply-security and compliance requirements across multi-site European networks.
Recent Industry Developments in Europe Pharmaceutical Contract Manufacturing Market
- July 2026: Sharp Services announced a EUR 20 million investment to expand European injectable packaging capacity, including new Grade D packaging suites in the Netherlands alongside cold chain and syringe assembly upgrades across its Belgium and Netherlands sites. The investment increases available capacity for high-value injectable formats and strengthens integrated packaging plus temperature-controlled logistics for biologics supply programs.
- July 2025: Alvotech acquired Ivers-Lee Group in Burgdorf, Switzerland, adding assembly and packaging capabilities for autoinjectors, pre-filled syringes, and safety devices to its operations. The acquisition expands in-region device-oriented packaging capacity and supports sponsors seeking combination-product packaging workflows and qualified European release pathways.
- October 2024: The European Medicines Agency advanced EU pharmaceutical legislation modernization activities, keeping supply-security and lifecycle oversight central to ongoing regulatory change. The continued focus on compliance, product information controls, and manufacturing resilience increases the premium on CDMOs that can manage tech transfers and post-approval changes across multiple European sites.
Europe Pharmaceutical Contract Manufacturing Market Report Scope and Research Methodology
Market Definition and Coverage
This market covers outsourced pharmaceutical manufacturing work delivered by third party partners in Europe, where a drug sponsor pays for making APIs, producing finished dosage forms, and completing secondary packaging for clinical or commercial supply.
Scope exclusions: We do not count in house manufacturing done within a sponsor's own plants, and pure research only services that do not end in manufacturing output.
Segments Covered in This Report
- By Service Type
- Active Pharmaceutical Ingredient (API) Manufacturing
- Finished Dosage Formulation (FDF) Development and Manufacturing
- Solid Dose Formulation
- Liquid Dose Formulation
- Injectable Dose Formulation
- Secondary Packaging
- By Molecule Type
- Small Molecule
- Large Molecule / Biologics
- Highly-Potent APIs (HPAPI)
- Advanced Therapies (Cell and Gene)
- By Therapeutic Area
- Oncology
- Cardiovascular
- CNS Disorders
- Infectious Diseases
- Respiratory
- Other Therapeutic Area
- By Development Phase
- Pre-clinical
- Clinical - Phase I
- Clinical - Phase II
- Clinical - Phase III
- Commercial Manufacturing
- By End-Client Type
- Big Pharma
- Small and Mid-size Pharma
- Virtual / Biotech Start-ups
- Generics Manufacturers
- By Country
- United Kingdom
- Germany
- France
- Italy
- Spain
- Rest of Europe
Data Sources, Market Sizing, and Validation
Desk Research
Desk work starts by mapping the demand pool and the manufacturing footprint across Europe, and then translating that picture into spend on outsourced production. Public sources are used to anchor what can be observed, such as Eurostat structural business statistics, EMA databases and GMP related publications, national health agency releases, and trade statistics from UN Comtrade or national customs portals.
We also lean on company annual reports, investor decks, plant announcements, and association websites to understand capacity additions, dosage form focus, and service mix shifts. Where a company level revenue split is not publicly available, a paid subscription for company financials and intelligence is used to standardize peer comparisons. In select cases, an import export shipment level database is used to sanity check cross border API and drug product flows. These sources are not exhaustive, and other public documents and datasets are also referenced for data collection, validation, and clarification.
Primary Interviews and Surveys
Primary conversations are used to confirm what is typically outsourced versus kept internal, and to translate capacity and pipeline signals into realistic utilization and pricing assumptions. We spoke with managers and functional leaders from contract manufacturers, sponsor supply chain teams, and quality and regulatory specialists, with coverage balanced across core European pharma hubs and the Rest of Europe so local operating differences were captured.
Distribution of primary research fieldwork respondents
| Company type | Respondent position |
|---|---|
| Top tier: 36% | CXOs: 16% |
| Mid tier: 48% | Functional/Unit leaders: 34% |
| Smaller Players: 16% | Managers: 50% |
Market-Sizing & Forecasting
Sizing is built using top-down and bottom-up logic, although the core count is reconstructed from a top-down view of outsourced pharma production in Europe and then checked against supplier side signals. In practice, we start from the regional drug manufacturing activity and outsourcing intensity, and then split spend into API manufacturing, finished dosage formulation work, and secondary packaging, before country totals are derived.
Inputs that materially shape the model include the mix of solid, liquid, and injectable dosage forms produced under contract, utilization trends for sterile and non-sterile lines, typical batch scale differences between clinical and commercial runs, and observed pricing movement for manufacturing services when energy, labor, and compliance costs change. Since forecast inputs can move together, scenario analysis is used to build a base case and two sensitivity cases. Then the forward path is adjusted based on interview feedback on pipeline strength, tech transfer timelines, and capacity additions. Where bottom-up signals are incomplete, we apply conservative gap fills using peer averages for revenue per line type and known site footprints, and then re-test the totals against the top-down demand pool.
Data Validation & Update Cycle
Validation happens in layers, starting with basic checks on year to year growth, service mix stability, and country share movements that should match known manufacturing hubs. We then compare the model output to independent signals like capacity expansion announcements, regulatory inspection activity patterns, and broad trade movement for key drug inputs, and any large variances are flagged for a second review.
Before sign-off, the numbers and assumptions go through a multi-step analyst review, and respondents are re-contacted when the model shows unexpected step changes in utilization, pricing, or service splits. Reports are refreshed annually, and interim updates are made when material events occur, such as large site acquisitions, major new sterile capacity coming online, or notable regulatory shifts. Right before delivery, a final pass is completed so clients receive the most current view that can be supported by the latest available evidence.
Mordor Intelligence's Europe Pharmaceutical Contract Manufacturing Market Size Compared Against Other Published Estimates
Published numbers for this market can look far apart even when the topic sounds identical, because the word contract manufacturing is used differently across studies and the timing of price assumptions varies. Differences usually come from what services are counted, whether the scope is Europe only or blended with broader geographies, and how clinical activity is treated versus commercial supply.
In this study, the spread is mainly explained by service scope and what gets grouped into the total. Some estimates fold in contract research and wider development services, while others narrow the view to a subset like fill finish only. The year of currency conversion and cost inflation assumptions can also change the USD value.
Benchmark comparison
| Source | Market Size | Gaps in Research Methodology |
|---|---|---|
| Mordor Intelligence | USD 45.18 B (2025) | |
| Industry Data Publisher A | USD 14.99 B (2025) | This figure appears to use a narrower spend definition and tends to blend development and testing language with manufacturing without clearly separating API, finished dosage work, and secondary packaging at Europe level, which can compress the total when services are scoped differently. |
| Regional Consultancy B | USD 50.92 B (2023) | This estimate includes contract research and clinical trial related services alongside manufacturing, and it uses an earlier base year, which can lift the headline value versus a manufacturing-only count and also makes year comparisons less direct. |
The table shows that most of the gap is not about math, it is about what is being counted and in which year it is being valued. By keeping the total tied to API manufacturing, finished dosage formulation production, and secondary packaging inside Europe, and by separating out research services that do not result in manufacturing output, the sizing stays traceable to clear variables, a choice applied by Mordor Intelligence.
Key Questions Answered in the Report
What is the current value of the European pharmaceutical contract manufacturing market?
The market is valued at USD 47.42 billion in 2026 and is expected to reach USD 60.38 billion by 2031.
Which service segment generates the largest revenue?
API manufacturing holds the highest share at 42.02% of 2025 revenue.
Which European country is expanding contract manufacturing capacity the fastest?
Spain is registering the highest growth, forecast at a 6.92% CAGR between 2026-2031.
Which therapeutic area drives the greatest manufacturing demand?
Oncology leads, accounting for 28.31% of 2025 contract manufacturing demand.
Why are biologics significant for European CDMOs?
Complex biologics such as monoclonal antibodies demand specialized containment and single-use capacity, enabling CDMOs to capture premium pricing.
How is consolidation reshaping the competitive landscape?
High-profile acquisitions like Lonza-Roche and Novo Holdings-Catalent have created integrated service platforms that compress development timelines and deepen client relationships.