
Market Overview
| Study Period | 2020 - 2031 |
|---|---|
| Forecast Data Period | 2026 - 2031 |
| Base Year Market Size (2025) | USD 0.64 Trillion |
| Market Size (2026) | USD 0.74 Trillion |
| Market Size (2031) | USD 1.48 Trillion |
| Growth Rate (2026 - 2031) | 14.96 % |
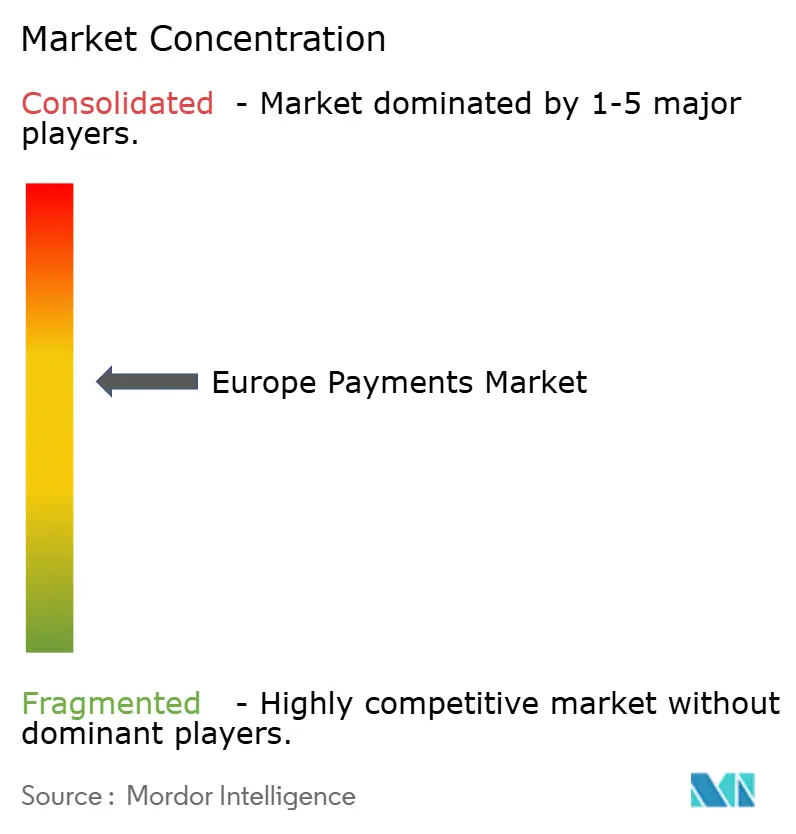
| Market Concentration | Medium |
Major Players *Disclaimer: Major Players sorted in no particular order Image © Mordor Intelligence. Reuse requires attribution under CC BY 4.0. | |
Europe Payments Market Analysis by Mordor Intelligence
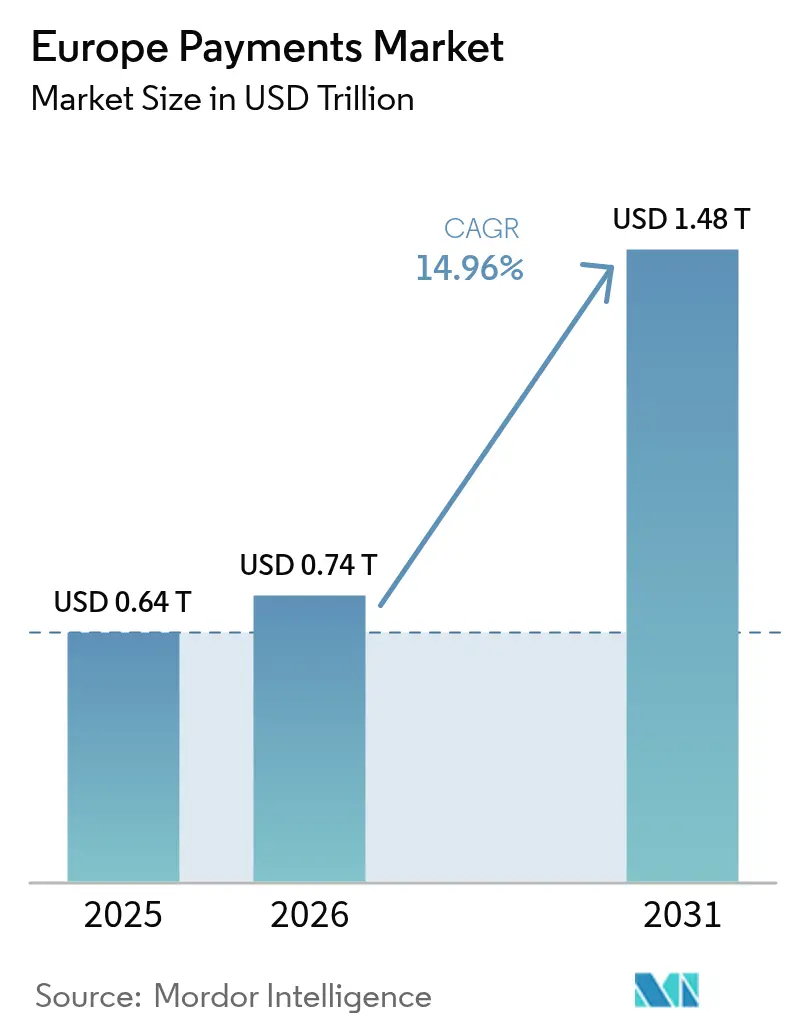
The Europe payments market size was valued at USD 0.64 trillion in 2025 and estimated to grow from USD 0.74 trillion in 2026 to reach USD 1.48 trillion by 2031, at a CAGR of 14.96% during the forecast period (2026-2031). Expansion is anchored in the accelerating migration from cash to digital instruments, a trend underscored by the European Central Bank’s finding that cash accounted for 52% of point-of-sale transactions in 2024, down from 59% two years earlier.[1] Mandatory real-time payment availability under the Instant Payments Regulation, effective January 2025, is set to widen access to ten-second euro transfers at no extra cost. Surging mobile-wallet adoption—72% of Europeans used one in 2023—plus the roll-out of PSD2-enabled account-to-account rails are redrawing competitive lines.[2] Cross-border initiatives such as the G20 Roadmap cut remittance frictions, while domestic schemes like Poland’s BLIK showcase regional innovation. Incumbent banks are reacting through pan-European ventures (for example Wero) aimed at defending revenue pools from global card networks.
Key Report Takeaways
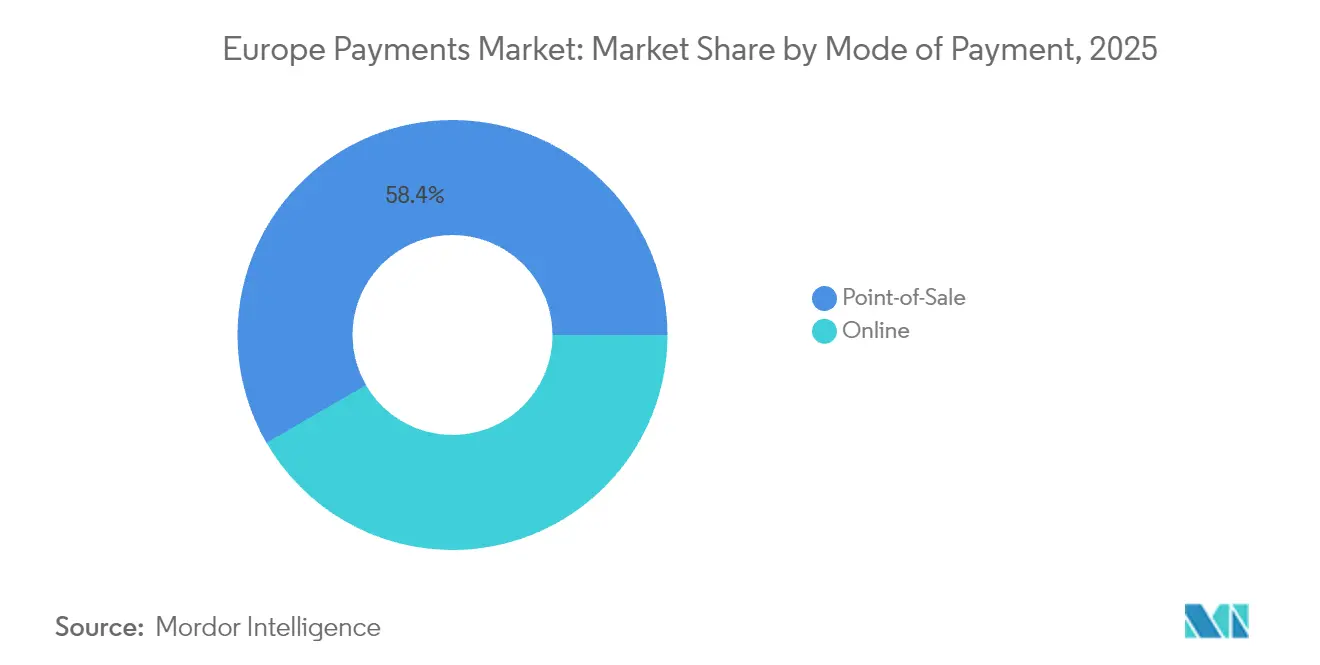
- By mode of payment, POS cards commanded 50.62% of Europe payments market share in 2025; online digital wallet & A2A payments are on course for an 17.74% CAGR through 2031. Overall Point-of-Sale led with 58.35% revenue share.
- By interaction channel, POS led with 70.45% revenue share in 2025, whereas e-commerce/m-commerce is forecast to expand at a 18.61% CAGR to 2031.
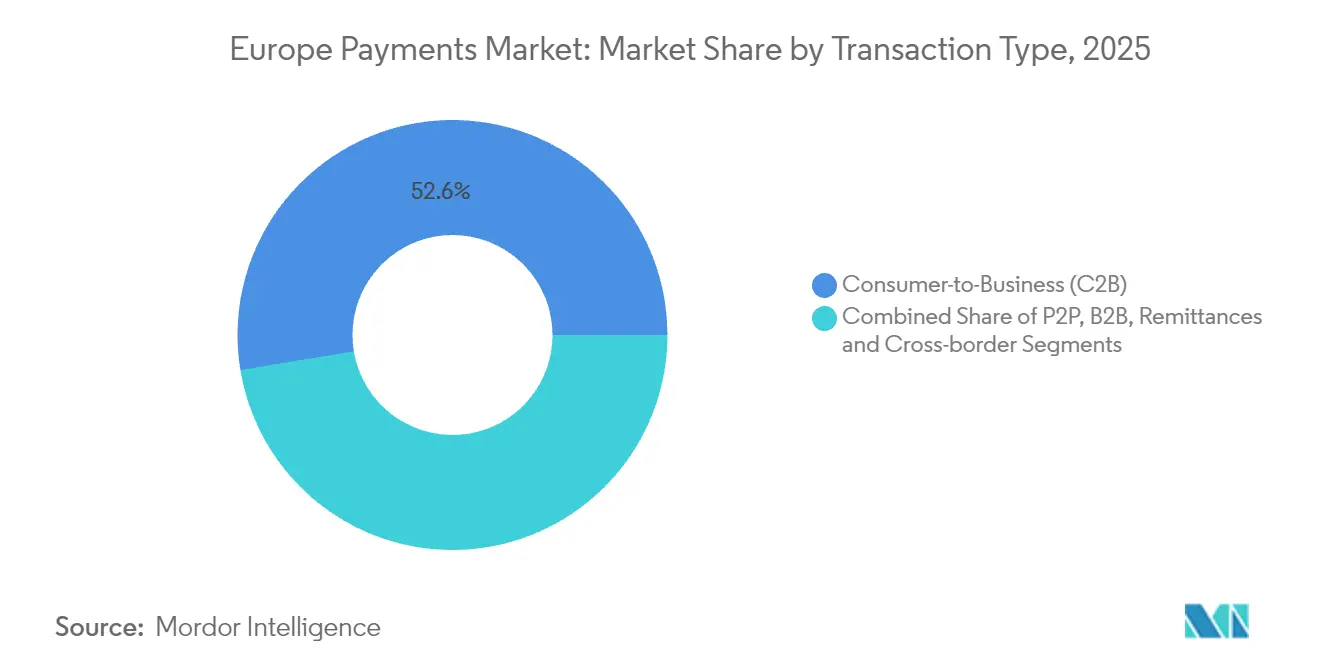
- By transaction type, consumer-to-business flows held 52.60% of Europe payments market size in 2025; remittances & cross-border payments are pacing highest at 15.76% CAGR.
- By end-user industry, retail represented 27.55% of market revenue in 2025, while healthcare payments are tracking an 17.89% CAGR through 2031.
- By country, the United Kingdom retained 17.70% of Europe payments market share in 2025; Poland is projected to be the fastest-growing country at a 15.05% CAGR to 2031.
Note: Market size and forecast figures in this report are generated using Mordor Intelligence’s proprietary estimation framework, updated with the latest available data and insights as of 2026.
Market Trends and Insights
Drivers Impact Analysis of Europe Payments Market*
| Driver | (~) % Impact on CAGR Forecast | Geographic Relevance | Impact Timeline |
|---|---|---|---|
| PSD2-Driven Open-Banking APIs Boosting Account-to-Account Payments | +3.2% | EU-wide, with stronger impact in UK, Nordics, and Germany | Medium term (2-4 years) |
| Pan-EU SEPA SCT Inst Rail Accelerating Real-Time Settlement | +2.8% | Eurozone countries, with gradual expansion to non-euro EU members | Short term (≤ 2 years) |
| Embedded Finance Adoption Among EU Retailers | +2.5% | Western Europe, with early adoption in UK, France, and Germany | Medium term (2-4 years) |
| Rapid E-commerce Expansion in Central & Eastern Europe | +2.1% | Poland, Czech Republic, Romania, and Baltic states | Medium term (2-4 years) |
| NFC Limit Hikes Fueling Contactless Card Usage | +1.8% | EU-wide, with higher impact in urban centers | Short term (≤ 2 years) |
| Merchant Uptake of BNPL Plug-ins Elevating AOV | +1.6% | Northern and Western Europe, with expansion to Southern Europe | Medium term (2-4 years) |
| Source: Mordor Intelligence | |||
PSD2-Driven Open-Banking APIs Boosting Account-to-Account Payments
Open-banking rules under PSD2 let licensed third parties pull account data through secure APIs, unlocking low-cost, immediate A2A transactions that bypass card rails. UK usage leads, yet German and Nordic banks are rapidly scaling similar frameworks. Banks that move early are bundling white-label APIs for fintech collaboration, whereas laggards risk disintermediation. The forthcoming PSD3 package promises clearer data-access rules that will widen use cases, from payroll to subscription bill pay.[3]
Pan-EU SEPA SCT Inst Rail Accelerating Real-Time Settlement
The SEPA Instant Credit Transfer scheme delivers pan-European euro payments in under ten seconds and is mandatory for euro-area PSPs by January 2025. Volume growth is expected to cannibalize deferred batch card settlements, sharpening price competition and compressing interchange. PSPs are racing to overlay value-added fraud analytics and liquidity-management tools to safeguard revenue.
Embedded Finance Adoption Among EU Retailers
Retailers embed branded checkout, loyalty and financing journeys directly into their apps, trimming interchange costs and harvesting data. API-first gateways mean even mid-tier merchants can deploy pay-by-bank or split-pay at minimal lift. Large grocers in France and Germany have begun white-label debit programs, while fashion marketplaces are piloting own-brand wallets that dwell inside loyalty ecosystems.
Rapid E-commerce Expansion in Central & Eastern Europe
Poland illustrates the region’s trajectory: domestic scheme BLIK processed more than 420 million transactions in 2024 and is live in three neighboring countries. As regional GDP growth outpaces the EU average, cross-border sellers are localizing checkout to support domestic rails, mobile wallets and cash-on-delivery hybrids. Payment firms that master local regulation and consumer nuance capture incremental flow otherwise lost to global cards.
Restraints Impact Analysis of Europe Payments Market*
| Restraint | (~) % Impact on CAGR Forecast | Geographic Relevance | Impact Timeline |
|---|---|---|---|
| Interchange-Fee Fragmentation & Local Scheme Complexity | -1.9% | EU-wide, with greater impact in markets with strong domestic schemes | Medium term (2-4 years) |
| Fraud Exposure in Instant Payments Raising Provision Costs | -1.6% | EU-wide, with higher impact in early-adopting countries | Short term (≤ 2 years) |
| Legacy Core Banking Systems Slowing Instant Payments Adoption | -1.4% | EU-wide, with greater impact in markets with older banking infrastructure | Medium term (2-4 years) |
| GDPR-Driven Data-Localisation Constraints | -1.2% | EU-wide, with stricter enforcement in Germany, France, and Netherlands | Long term (≥ 4 years) |
| Source: Mordor Intelligence | |||
Interchange-Fee Fragmentation & Local Scheme Complexity
Capped consumer card interchange under the IFR still diverges in practice, forcing merchants to juggle Carte Bancaire, Bancontact and Girocard alongside global brands, raising compliance overhead. PSPs absorb duplicate certification and routing costs that dilute innovation budgets.
Fraud Exposure in Instant Payments Raising Provision Costs
Real-time irrevocable transfers magnify fraud liability; banks must deploy AI pattern-recognition tools and fund reimbursement schemes, lifting cost bases and creating scale advantages for large processors.
*Our forecasts treat driver/restraint impacts as directional, not additive. The impact forecasts reflect baseline growth, mix effects, and variable interactions.
Europe Payments Market Segment Analysis
By Mode of Payment:
Digital Wallets Reshaping Payment LandscapePOS card payments retained the largest slice in 2025 at 50.62%, reflecting years of infrastructure investment and consumer habit. Overall Point-of-Sale led with 58.35% revenue share. Yet the Europe payments market is seeing digital wallets and A2A rails compound at an 17.74% CAGR, pulling share from cards online and at point of sale. A rising cohort of 72% of Europeans actively use a wallet, and global e-commerce share for wallets is set to surpass 52.5% by 2025. Cash usage is retreating, though it still holds niche strength for low-value or rural purchases. Wearable and QR-based options are gaining incremental share among early adopters. As consortium wallet Wero scales across major euro economies, incumbents are compelled to harmonize acceptance and loyalty integration.
Cards’ entrenched position ensures continued relevance, but issuers are enriching propositions with installment features and crypto reward tie-ins to stem outflow. The Europe payments market size for card-based flows is nevertheless expected to plateau as wallet-based A2A debits capture bill pay, subscription and micro-ticket use cases. Payment gateways that orchestrate a single integration for cards, bank-debited wallets and pay-by-bank are positioned to win merchant preference.

By Interaction Channel:
E-commerce Acceleration Transforms Payment DynamicsPoint-of-sale transactions still dominated with 70.45% share in 2025, mirroring Europe’s sizeable brick-and-mortar footprint. Lockdowns accelerated digital engagement, and that momentum persisted: Europe payments market size for e-commerce and m-commerce is advancing at 18.61% CAGR through 2031. Omnichannel journeys blur channel lines, with click-and-collect, QR-initiated in-store pay and pay-by-link in chat fostering continuity. Payment providers that unify risk scoring and token management across channels shield merchants from fraud spikes and boost authorization rates.
Mobile accounts for a growing majority of e-commerce checkouts, led by embedded buttons inside social and gaming apps. The shift forces acquirers to master app-based one-click tokens and to support scheme-level network tokenization. Europe payments market share for purely in-app transactions is forecast to rise fastest within the channel mix, spurring demand for SDKs that compress integration effort for thousands of mid-size merchants.
By Transaction Type:
Cross-Border Payments Gaining MomentumConsumer-to-business flows represented 52.60% of transaction value in 2025, anchored by retail spending and recurring bill pay. The cross-border segment, however, is the growth standout at 15.76% CAGR, propelled by SME export activity and diaspora remittances. Enhanced corridors under the G20 Roadmap aim to cut cost and settlement time, encouraging wallet-to-wallet remittances that settle over regional instant-payment pipes. Person-to-person apps leveraging SCT Inst now offer near-zero-cost domestic transfers, eroding cash peer payments. Business-to-business volumes remain chunky, but process complexity leaves ample room for fintechs that can automate invoicing, reconcile data and embed trade-finance options.
In value terms, Europe payments market size tied to B2B remains substantial even if growth lags consumers, prompting banks to develop real-time ISO 20022 compatible request-to-pay modules. Regulation-driven e-invoicing mandates arriving in France, Germany and Poland will accelerate digitization and tie directly into these payment requests.
By End-User Industry:
Healthcare Digitalization Drives Payment InnovationRetail kept the largest 27.55% revenue share in 2025, fueled by contactless ubiquity and checkout-free pilots. Retailers increasingly deploy proprietary wallets and subscription bundles that fuse payment, loyalty and micro-financing, tightening grip on customer data. Healthcare, meanwhile, is tracking an 17.89% CAGR as tele-consultation, e-pharmacy and insurance reimbursement shift online. Europe payments market share captured by healthcare is small today but accelerating as hospitals mandate online co-pay and insurers push instant claim pay-out to wallets.
Entertainment & digital content ecosystems rely on recurring and micro-payment flows, pushing gateways to perfect low-value token billing and chargeback mitigation. Hospitality and travel rebound has nudged hoteliers into pre-arrival pay-by-link and biometric-verified check-in settlement. Government & utilities continue to phase out paper giro slips, moving citizens to QR invoices that settle via national instant rails, bolstered by EU digital public infrastructure grants.
Geography Analysis
United Kingdom Payments Market
The United Kingdom captured 17.70% of the Europe payments market in 2025, benefiting from near-universal contactless coverage and early open-banking penetration. Faster Payments, which already clears domestic transfers in seconds, provides a blueprint for the region’s instant payment ambitions. Regulatory focus on BNPL conduct points to a balanced innovation-protection stance, and the Bank of England’s work on a digital pound underscores the drive to future-proof public money.
Western Europe Payments Market
Germany, France and Spain together account for a sizeable share of the Europe payments market. Germany’s habit of PayPal and invoice-after-delivery is gradually giving way to wallets and pay-by-bank as PSD2 flows become mainstream. France’s emphasis on biometric authentication, backed by local scheme Carte Bancaire, seeks to fortify consumer trust. Spain has observed double-digit e-commerce turnover growth, with wallets bundled into super-apps targeting Gen Z.
Southern, Central and Northern Europe Payments Market
Italy and Poland form the vanguard of high-growth territories. Poland, recording a 15.05% CAGR forecast, leverages domestic scheme BLIK, which now extends to Romania and Slovakia. Supportive macro conditions—GDP seen rising 3.5% in 2025—bolster consumer spend. The Nordic cluster, nearly cash-free, showcases wallet consolidation: MobilePay and Vipps merged, amassing scale to negotiate interchange and acceptance.
Benelux, Balkans and Baltics Payments Market
The rest of Europe—Benelux, Balkans and Baltics—presents a patchwork of adoption stages. Baltic regulators encourage crypto-friendly policies, while Balkan countries prioritize card acceptance infrastructure. The European Central Bank’s retail payments strategy targets uniform access, advocating instant rails and prepping for a digital euro that could harmonize settlement across the bloc.
Regulatory Landscape
Europe payments regulation is tightening around instant transfers, open-banking access, and fraud accountability. The Instant Payments Regulation (Regulation (EU) 2024/886) entered into force on 8 April 2024, with the first obligations applying from 9 January 2025 for euro-area payment service providers (PSPs). It embeds ten-second SEPA instant euro transfers into baseline service expectations and constrains pricing practices for instant payments.
The EU Payments Services Package (PSD3 and the directly applicable Payment Services Regulation, PSR) advanced materially after a provisional political agreement on 27 November 2025. The European Parliament ECON Committee approved the compromise texts on 5 May 2026, indicating movement toward more harmonized rules across member states and stronger fraud prevention requirements. The update includes payee verification (matching payee name and unique identifiers) and clearer PSP liability when controls fail against impersonation and similar scams.
Value Chain Analysis
The Europe payments value chain starts with consumer and merchant payment initiation (in-store and online) and moves through acceptance (POS terminals, payment gateways, and orchestration layers), processing and routing (acquirers, processors, scheme rails, and A2A connectivity), and clearing and settlement (including SEPA and instant-payment mechanisms). It then extends into post-transaction services such as chargebacks/disputes, reconciliation, reporting, and fraud operations. Large card networks (Visa, Mastercard) remain central for cross-border acceptance, while domestic schemes and A2A rails (enabled by PSD2 open-banking and SEPA Instant Credit Transfer) are taking more share in P2P, bill pay, and selected merchant checkouts.
Interoperability and compliance execution are key bottlenecks. Uneven API standardization across countries complicates A2A scaling, and Strong Customer Authentication (SCA) implementation adds cost and checkout friction for merchants and PSPs. The shift toward PSR and PSD3 (with compromise texts published by the Council in 2026) moves operating requirements toward more uniform EU-wide conduct rules, while narrowing exemptions used by some marketplaces and pushing them to restructure payment flows or partner more directly with licensed PSPs. Fraud liability and monitoring obligations also increase the cost base, favoring processors and acquirers that can spread investment in real-time analytics and reimbursement handling across a larger transaction base.
Competitive Landscape
Card networks Visa and Mastercard remain pivotal yet face fresh challenges. Sixteen leading European banks launched Wero to reclaim strategic control of wallet and P2P rails. Worldline, Europe’s largest acquirer, is embedding Google Cloud AI to sharpen fraud detection while rolling out its Power24 program that targets USD 200 million in savings by 2025.
Nexi S.p.A.’s EUR 4 billion (USD 4.3 billion) EMTN shelf arms it for consolidation and organic expansion from Italy into DACH and CEE corridors. BNP Paribas and BPCE formed Estreem to capture issuer-processor economics in France, aspiring to process 17 billion annual transactions.
Fintech disruptors accelerate specialization. Adyen scales unified commerce APIs, Satispay targets person-to-merchant micro-payments, and BLIK eyes regional expansion. Altogether, the top five processors command roughly 55% of the Europe payments market value, leaving space for niche players in verticalized SaaS and cross-border corridors.
Europe Payments Industry Leaders
-
Visa Inc.
-
Currence iDEAL BV
-
Melio Payments Inc.
-
Mastercard Incorporated
-
Giropay GmbH
- *Disclaimer: Major Players sorted in no particular order
Europe Payments Market Companies Covered in this Report
- Visa Inc.
- Mastercard Incorporated
- Worldline SA
- Nexi Group S.p.A.
- PayPal Holdings Inc.
- Adyen N.V.
- Stripe, Inc.
- Checkout.com Group
- Klarna Bank AB
- Revolut Ltd.
- SumUp Payments Ltd.
- Bancontact Payconiq Company
- Giropay GmbH
- Currence iDEAL B.V.
- Ingenico (Worldline)
- Fiserv, Inc. (Clover)
- Melio Payments Inc.
- Barclays plc (Barclaycard Payments)
- BNP Paribas SA (Axepta, Nickel)
- Deutsche Bank AG (db pay)
- Mollie B.V.
- Block, Inc. (Square)
Market Opportunities and Future Outlook
Opportunities are emerging in compliance-led productization and infrastructure localization as EU-wide rules tighten for instant payments and fraud prevention. With the PSD3 and PSR compromise texts progressing through EU institutions, including ECON approval in May 2026, PSPs and processors can package verified-payee checks, scam detection, and reimbursement operations as standardized modules for banks, fintechs, and merchants. This is particularly relevant for instant-payment use cases where irrevocability raises customer harm and operational exposure.
Cross-border merchant and SME flows also create room where providers combine localized acceptance with FX and treasury services. Santander participated in a GBP 550 million funding round for Ebury in April 2026 to scale AI-driven payments and foreign-exchange capabilities for SMEs. Mollie reached full operational status across all 30 EEA countries in June 2026 while committing EUR 350 million over five years to expand infrastructure and products. Infrastructure sovereignty and resilience investment is another theme, including Visa's announced EUR 500 million commitment to European infrastructure in May 2026, which supports demand for Eurozone-based processing, tokenization, and data-handling capabilities aligned with security and compliance expectations in large markets.
Recent Industry Developments in Europe Payments Market
- July 2026: European Payments Initiative (EPI) confirmed the roadmap for the next phase of migrating iDEAL to Wero, including a phased infrastructure transition planned to begin in October 2026. The move aligns a major domestic payment method with a pan-European wallet and A2A direction, raising the stakes for PSPs and merchants to support Wero-aligned checkout and routing. It also signals deeper consolidation of scheme and wallet layers around interoperable European rails.
- February 2025: BNP Paribas and BPCE created Estreem to consolidate French processing capabilities and support expansion across the EU. The initiative strengthens domestic processing scale while adding multi-scheme and instant-payment support under a single industrial platform. For merchants and issuers, this increases the availability of local processing alternatives alongside global networks.
- December 2024: The European Central Bank reported that cash was used in 52% of point-of-sale payments, confirming the continuing shift toward digital instruments. The metric provides a concrete baseline for how far cash displacement has progressed in everyday commerce, while highlighting remaining segments where acceptance upgrades and wallet or A2A propositions can still convert usage. It also supports investment in omnichannel acceptance and fraud controls as digital volumes expand.
Europe Payments Market Report Scope and Research Methodology
Market Definition and Coverage
For this report, the Europe payments market is defined as the value of payment transactions executed across in-person and online channels, across common payment instruments used by consumers and businesses, within European countries.
Scope exclusions: Cash withdrawals and non-transactional banking revenues (such as lending interest income) are not counted as part of payments transaction value.
Segments Covered in This Report
- Segmentation by Mode of Payment
- Point-of-Sale
- Card (Debit, Credit, Pre-paid)
- Digital Wallets (Apple Pay, Google Pay, Interac Flash)
- Cash
- Other POS (Gift-cards, QR, Wearables)
- Online
- Card (Card-Not-Present)
- Digital Wallet and Account-to-Account (Interac e-Transfer, PayPal)
- Other Online (COD, BNPL, Bank Transfer)
- Point-of-Sale
- Segmentation by Interaction Channel
- Point-of-Sale
- E-commerce/M-commerce
- Segmentation by Transaction Type
- Person-to-Person (P2P)
- Consumer-to-Business (C2B)
- Business-to-Business (B2B)
- Remittances and Cross-border
- Segmentation by End-user Industry
- Retail
- Entertainment and Digital Content
- Healthcare
- Hospitality and Travel
- Government and Utilities
- Other End-user Industries
- By Country
- United Kingdom
- Germany
- France
- Spain
- Italy
- Poland
- Nordics
- Rest of Europe (Eastern Europe, Benelux, Baltics, etc.)
Data Sources, Market Sizing, and Validation
Desk Research
We first built a factual base around how payments flow through Europe, and which rails and channels are gaining share. Public sources helped here, such as the European Central Bank payments statistics, Eurostat indicators for digital commerce, the European Commission material on PSD and open banking, and country-level central bank publications for non-cash payments. We also used open trade and macro references, such as OECD and World Bank series, mainly to sense-check growth and currency effects.
Next, the ecosystem view was completed using company filings and investor presentations from payment service providers, banks, and large merchants, along with reputable press and association updates. Where needed, we referenced paid databases for company financials and news screening, plus patent databases to track product shifts like instant payments and wallet enablement. These sources were then used to pin down adoption timing, typical transaction mix, and realistic ranges for unit economics assumptions in the model. The desk sources listed above are illustrative, and many other public and paid references were also used for data collection, validation, and clarification.
Primary Interviews and Surveys
To close gaps left by public data, we validated assumptions through expert interviews and structured surveys with issuers, acquirers, payment processors, gateways, wallets, and large merchant acceptance teams. Because this is a Europe-focused market, we ensured the input was balanced across major sub-regions, so channel shifts (POS versus e-commerce) and rail adoption (cards versus account-to-account) were checked from more than one angle.
Distribution of primary research fieldwork respondents
| Company type | Respondent position |
|---|---|
| Top tier: 35% | CXOs: 13% |
| Mid tier: 51% | Functional/Unit leaders: 27% |
| Smaller Players: 14% | Managers: 60% |
Market-Sizing & Forecasting
Sizing starts with a top-down build where country and regional payment statistics are used to reconstruct total transaction value across key channels, which is then split by payment mode and transaction type using published shares and interview-led adjustments. Once totals were formed, they were cross-checked using selective bottom-up approximations, such as sampled merchant category mixes, typical ticket sizes by channel, and roll-ups of reported payment volumes from visible ecosystem participants to keep the totals realistic.
A few market fingerprints were used as core inputs because they explain most movements in payments value in Europe. These include the shift in non-cash payment volume and value, growth of e-commerce and m-commerce, the adoption pace of digital wallets and contactless acceptance, the migration toward instant or account-to-account rails, and cross-border payment activity tied to travel and online trade. For forecasting, we relied on scenario analysis, where each key variable is projected using a blend of trend persistence and expert views, and then recombined into the payments value model so high and low cases remain traceable.
Where bottom-up signals were incomplete, gaps were handled by applying conservative ranges to missing countries or segments and then rebalancing back to known totals at the Europe level. The final outputs were only accepted when the direction and magnitude matched what primary respondents described as operationally plausible for the forecast window.
Data Validation & Update Cycle
Validation was done through multiple checks, so a single data series did not drive the final number. We compared modeled totals against independent signals, such as central bank non-cash payments value, reported e-commerce growth, and visible shifts in instrument mix, and then investigated outliers before sign-off. When variances appeared, assumptions were revisited and, where necessary, respondents were re-contacted to confirm whether a structural change (for example, instant payments adoption) had been missed.
Each report is refreshed annually, and interim updates are made when material events impact payment volumes or channel mix. Before delivery, an analyst performs a final pass to confirm that the latest public releases and major market developments are reflected in the model outputs and narrative.
Mordor Intelligence's Europe Payments Market Size Compared Against Other Published Estimates
Published market sizes for Europe payments often vary because the word payments can be interpreted in different ways, and then counted with different units. Differences usually come from whether studies size transaction value versus revenue pools, whether cash is included at the point of sale, and how cross-border flows are treated.
Interchange and processing fee revenues sit outside Mordor Intelligence's scope for this title, which is why estimates that size the payments fee pool or payment services revenue can look much smaller than a transaction value market size, even for the same region and time period.
Benchmark comparison
| Source | Market Size | Gaps in Research Methodology |
|---|---|---|
| Mordor Intelligence | USD 0.64 T (2025) | |
| Industry Publisher A | USD 1.36 T (2024) | This figure appears to focus on a narrower digital payments construct and uses an earlier actual year, so cash and some offline transaction classes may be treated differently, and year-to-year comparability shifts with the base year chosen. |
| Consultancy B | USD 0.11 T (2027) | This estimate is framed as a fee pool in Europe, which sizes payment-related revenues rather than the full transaction value across POS and online channels, and it is also anchored to a forward year that may embed a specific growth scenario. |
Looking across the table, the spread is mainly explained by what is being measured, transaction value versus fees, along with channel coverage and base-year timing. By keeping the model tied to observable payment activity signals and then checking assumptions with market participants, we end up with a number that is easier to reconcile back to how payments are actually used across Europe.
Key Questions Answered in the Report
What is the current value of the Europe payments market?
The market processed USD 0.74 trillion in 2026 and is on track to hit USD 1.48 trillion by 2031.
Which payment mode is growing fastest in Europe?
Digital wallets and account-to-account rails are expanding at an 17.74% CAGR, outpacing cards and cash.
How will the Instant Payments Regulation affect European businesses?
From January 2025, all euro transfers must settle in under ten seconds at no extra cost, lowering liquidity risk and enabling new real-time services.
Why is Poland considered a payments growth hotspot?
Strong GDP growth plus the success of domestic scheme BLIK position Poland for a 15.05% CAGR through 2031.
What role do embedded finance solutions play for retailers?
Embedded finance lets merchants control checkout, lower processing fees and generate new revenue through branded payment and loyalty programs.
Are BNPL products likely to face stricter regulation?
Yes. Draft rules in the UK and EU require clearer disclosures and affordability checks, which should enhance long-term consumer confidence while tempering near-term growth.