
Europe Paper Market Size and Share
Market Overview
| Study Period | 2020 - 2031 |
|---|---|
| Forecast Data Period | 2026 - 2031 |
| Base Year Market Size (2025) | 71.14 Million tonnes |
| Market Volume (2026) | 73.72 Million tonnes |
| Market Volume (2031) | 90.08 Million tonnes |
| Growth Rate (2026 - 2031) | 4.09 % |
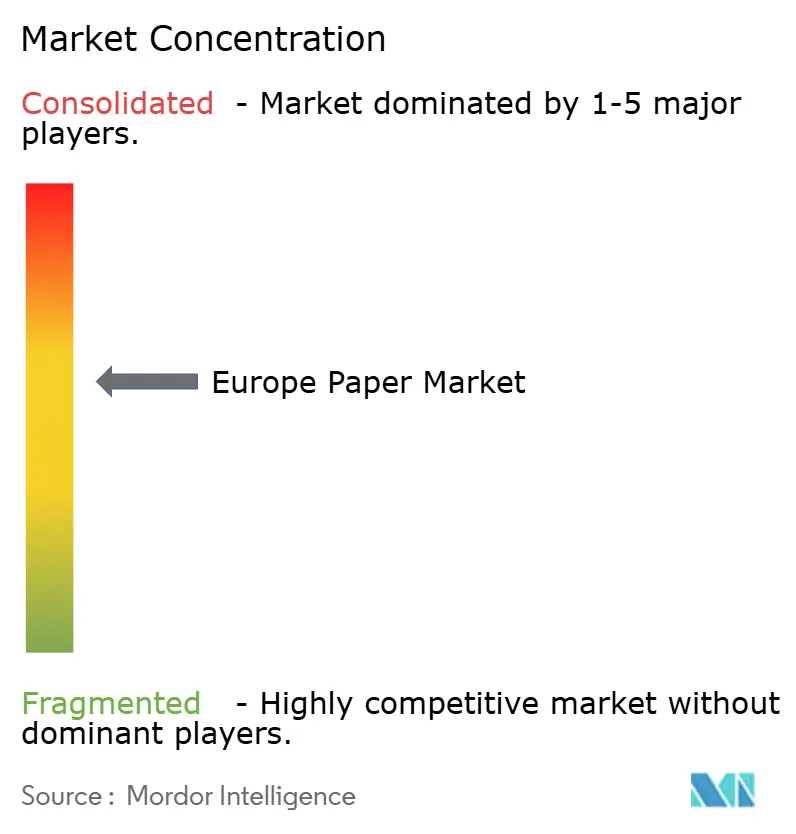
| Market Concentration | Medium |
Major Players *Disclaimer: Major Players sorted in no particular order Image © Mordor Intelligence. Reuse requires attribution under CC BY 4.0. | |
Europe Paper Market Analysis by Mordor Intelligence
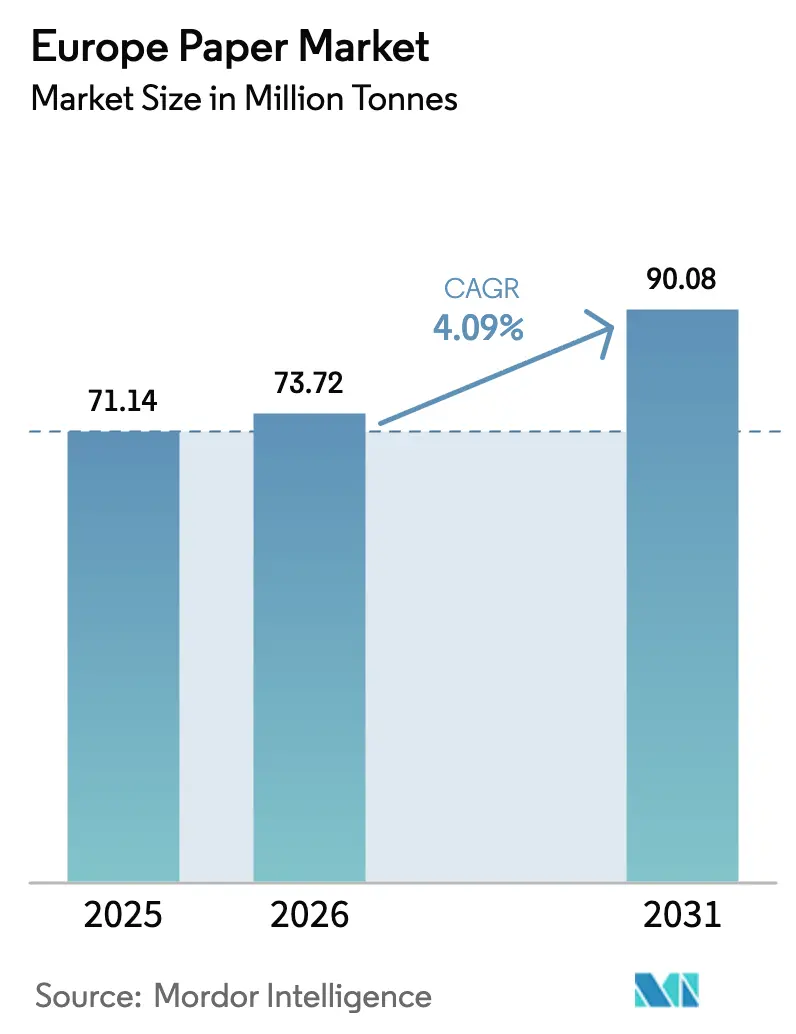
The Europe paper market size is projected to be 71.14 million tonnes in 2025, 73.72 million tonnes in 2026, and reach 90.08 million tonnes by 2031, growing at a CAGR of 4.09% from 2026 to 2031. An accelerated swing toward fiber-based packaging, reinforced by the European Union’s Packaging and Packaging Waste Regulation, is the primary structural driver. Rising e-commerce volumes, expanding bans on single-use plastics, and a recycling rate already above 70% are strengthening demand for containerboard, molded-fiber foodware, and barrier-coated specialty papers. Capacity conversions away from newsprint and uncoated free-sheet continue to tighten supply in declining graphic grades while simultaneously adding momentum to containerboard and specialty substrates. Intensifying energy-price volatility and high pulp costs pressure margins, yet mills that invest in de-inking, closed-loop water systems, and bioenergy remain comparatively insulated. The merger that created Smurfit Westrock, along with Stora Enso’s and UPM’s ongoing retooling, signals deeper integration and scale economics across the supply chain.
Key Report Takeaways
- By product type, case materials commanded 33.78% of 2025 volume, whereas specialty papers are forecast to record the fastest growth at a 5.16% CAGR through 2031.
- By raw-material source, recycled fiber accounted for 60.32% of volume in 2025, while agro-residue fiber is projected to expand at a 6.03% CAGR to 2031.
- By basis weight, the 90-200 gsm segment held 46.88% of 2025 tonnage, and grades below 90 gsm are expected to post a 5.67% CAGR over the forecast period.
- By end use, packaging and industrial applications accounted for 40.12% of volume in 2025, whereas food-service disposables are anticipated to grow the fastest at a 5.48% CAGR through 2031.
- By country, Germany captured 24.12% of regional tonnage in 2025, while Spain is projected to register the highest country-level expansion at a 6.11% CAGR to 2031.
Note: Market size and forecast figures in this report are generated using Mordor Intelligence’s proprietary estimation framework, updated with the latest available data and insights as of 2026.
Europe Paper Market Trends and Insights
Drivers Impact Analysis*
| Driver | (~) % Impact on CAGR Forecast | Geographic Relevance | Impact Timeline |
|---|---|---|---|
| Growth in Use of Sustainable Packaging | +1.2% | Pan-European, with intensity in Germany, France, Netherlands | Medium term (2-4 years) |
| Expansion of E-commerce and Food-service Demand | +1.5% | Pan-European, concentrated in Germany, UK, France, Spain | Short term (≤ 2 years) |
| EU Circular-Economy Mandates on Fiber Packaging | +0.9% | EU-27, with stricter enforcement in Western Europe | Long term (≥ 4 years) |
| Rising Hygiene-Paper Consumption Post-COVID | +0.6% | Pan-European, with elevated demand in Southern Europe | Medium term (2-4 years) |
| Commercialization of 3-D Molded-Fiber Packaging | +0.4% | Early adoption in Germany, Netherlands, Scandinavia | Long term (≥ 4 years) |
| On-demand Ink-jet Corrugated Printing Adoption | +0.3% | Germany, Italy, Spain logistics hubs | Medium term (2-4 years) |
| Source: Mordor Intelligence | |||
Growth in Use of Sustainable Packaging
Brand owners in fast-moving consumer goods and e-commerce are migrating to fully recyclable fiber packaging to comply with the EU requirement that all packaging be recyclable by 2030. Germany’s VerpackG assigns lower extended producer responsibility fees to paper solutions, tilting procurement economics toward containerboard and specialty grades certified for recyclability.[1]German Environment Agency, “VerpackG Guidelines,” UBA.DE Mondi’s MailerBAG, adopted by major e-retailers in 2024, showcases paper substrates engineered with water-based barrier chemistry that rivals polyethylene mailers in tear resistance.[2]Mondi, “MailerBAG Launch,” MONDIGROUP.COM Producers are therefore scaling de-inking, contaminant removal, and barrier-coating assets, accepting higher capital intensity to secure long-run competitiveness. Mills that close the loop with retailers gain a stable recovered-fiber supply and preferential shelf placement with sustainability-minded consumers.
Expansion of E-commerce and Food-service Demand
Online retail accounted for 23% of total European sales in 2024, boosting corrugated-box demand because single-item parcels consume more containerboard per dollar of merchandise than palletized store deliveries.[3]Eurostat, “Digital Economy and Society Statistics,” EUROSTAT.EC.EUROPA.EU Simultaneously, the Single-Use Plastics Directive eliminated polystyrene take-out ware, steering quick-service restaurants toward molded-fiber clamshells and paper straws. Huhtamaki’s 2024 Spanish capacity addition of 15,000 tonnes for molded-fiber disposables positions it to serve multinational chains as they standardize fiber formats across Europe. The combined pull from parcel logistics and food service reallocates machine time away from legacy graphic lines, widening the Europe paper market demand pool for containerboard and functional specialty papers. E-commerce’s tendency to favor variable-data printing further underpins the higher margins of digital pre-print rolls.
EU Circular-Economy Mandates on Fiber Packaging
The PPWR limits non-cellulosic components in paper packs to 5%, privileging monomaterial substrates over plastic-laminated hybrids. Member states must deploy separate collection systems for paper and cardboard by 2025, thereby improving feedstock purity and increasing the effective supply of OCC for recycled-fiber containerboard. Extended-producer-responsibility fees now scale with recyclability scores in Germany, France, and Italy, rewarding brands that strip out metalized barriers and polyethylene windows. Producers that can guarantee closed-loop chains gain a price premium, while mills without recycling operations face mounting competitive pressure. The PPWR’s scheduled PFAS limits catalyze R&D on starch- and chitosan-based barrier technologies, favoring integrated players with coating expertise.
Rising Hygiene-Paper Consumption Post-COVID
European tissue use remains 3% above 2019 per-capita levels, buoyed by hybrid work patterns that shift consumption from offices to homes. Tourism recovery returned away-from-home tissue volumes to growth in 2024, lifting demand in Spain, Italy, and Greece. Retail private labels upgraded converting lines for premium softness and embossing, intensifying competition with branded tissue leaders such as Essity. Forest-certification labels like FSC and PEFC are now table stakes, prompting mills to secure certified fiber streams or deepen de-inking for hygiene-grade recycled inputs. A resilient, premiumizing tissue segment smooths cash flow volatility for diversified producers battered by pulp price gyrations.
Restraints Impact Analysis*
| Restraint | (~) % Impact on CAGR Forecast | Geographic Relevance | Impact Timeline |
|---|---|---|---|
| Volatile Wood-Pulp and Recovered Paper Prices | -0.8% | Pan-European, acute in Nordic and Central European mills | Short term (≤ 2 years) |
| Digital Media Substitution of Graphic Papers | -1.1% | Pan-European, concentrated in Germany, UK, France | Long term (≥ 4 years) |
| Energy and Carbon-credit Price Inflation | -0.5% | Pan-European, severe in Germany, Poland, Czech Republic | Medium term (2-4 years) |
| Tighter Water-Use Regulations for Mills | -0.3% | Scandinavia, Germany, Austria | Long term (≥ 4 years) |
| Source: Mordor Intelligence | |||
Volatile Wood-Pulp and Recovered Paper Prices
Northern bleached softwood kraft traded between USD 1,000 and USD 1,100 per tonne in 2024 as Canadian wildfires and Brazilian logistics hiccups disrupted supply. Recovered OCC in Germany swung from EUR 80 to EUR 120 per tonne (USD 86.4-129.6) as export demand from Asia ebbed and flowed. Cost whiplash compresses spreads for mills lacking captive pulp, forcing short-term margin sacrifice or abrupt price pass-throughs that risk customer churn. Capital-heavy vertical integration into pulp assets insulates large incumbents but raises balance-sheet leverage. Smaller independents without pulp self-sufficiency face existential risk whenever the input-cost cycle spikes.
Digital Media Substitution of Graphic Papers
CEPI logged an 8% drop in European graphic paper output in 2024, accelerating a decade-long slide as advertisers reallocate budgets to digital channels. Norske Skog shuttered its Austrian Bruck mill, removing 220,000 tonnes of newsprint and confirming the wave of closures sweeping Europe. Demand erosion leaves stranded assets, forcing costly conversions or write-downs, and drags pulp prices as mechanical and high-brightness chemical demand contracts. While diversified majors pivot to containerboard, pure-play graphic mills struggle to fund necessary retrofits, deepening regional overcapacity in a shrinking segment.
*Our forecasts treat driver/restraint impacts as directional, not additive. The impact forecasts reflect baseline growth, mix effects, and variable interactions.
Segment Analysis
By Product Type: Case Materials Anchor Volume Growth
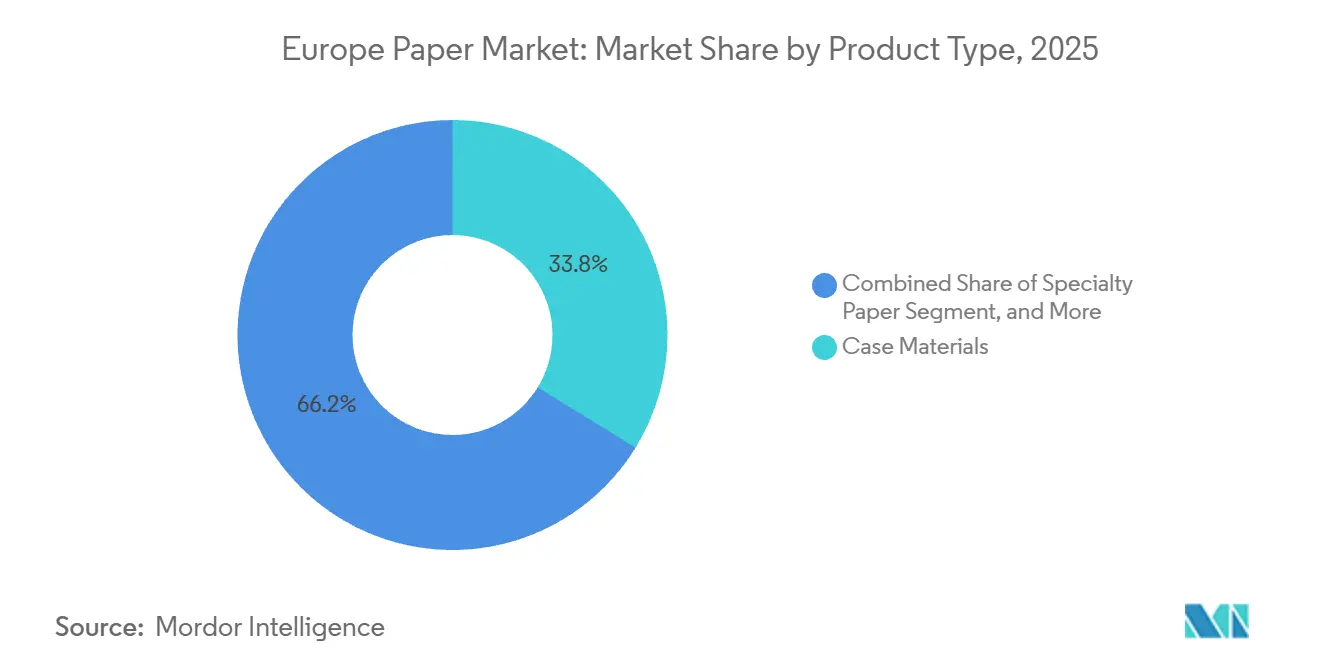
Case materials held 33.78% of 2025 volume within the Europe paper market, reflecting corrugated boxes’ central role in e-commerce and industrial shipping. Specialty papers are forecast to pace the field at a 5.16% CAGR to 2031, catalyzed by food-contact barrier liners, silicone-coated release carriers, and filtration media. Graphic papers slumped further in 2024, with an 8% production contraction, underscoring secular decline. Innovations such as digital pre-print on containerboard, plus PFAS-free coatings, keep specialty grades attractive for brand owners.
Sappi’s USD 43.2 million barrier-coating line in Germany exemplifies mills’ offensive push into higher-margin niches. EU recyclability caps on non-cellulosic constituents reward monomaterial cartons, fortifying demand for case materials. Containerboard also benefits from warehousing automation that favors unitized corrugated solutions. Conversely, graphic-paper lines face closure or retrofits, while sanitary grades hold steady on premium tissue demand.


By Raw-Material Source: Recycled Fiber Dominates Supply
Recycled fiber contributed 60.32% of tonnage in 2025, leveraging Europe’s mature 71.4% recycling rate. Agro-residue fiber, though a small base, is projected to expand 6.03% CAGR as mills trial wheat-straw and hemp blends to buffer pulp-price risk. Virgin fiber use persists in hygiene and high-strength grades but loses share under circular-economy directives.
Germany’s VerpackG fee matrix grants recycled-fiber packaging a clear cost edge, while Stora Enso’s Oulu conversion pivots half-a-million tonnes into recycled containerboard. Agro-residue pilots in Spain blend 20% straw with OCC without compromising box compression, signaling future scalability. Persistent NBSK volatility keeps the spotlight on diversified feedstocks, but hygiene-grade brightness and strength requirements ensure virgin kraft remains a crucial component in the Europe paper market size allocation.
By Basis Weight: Lightweighting Drives Below 90 gsm Growth
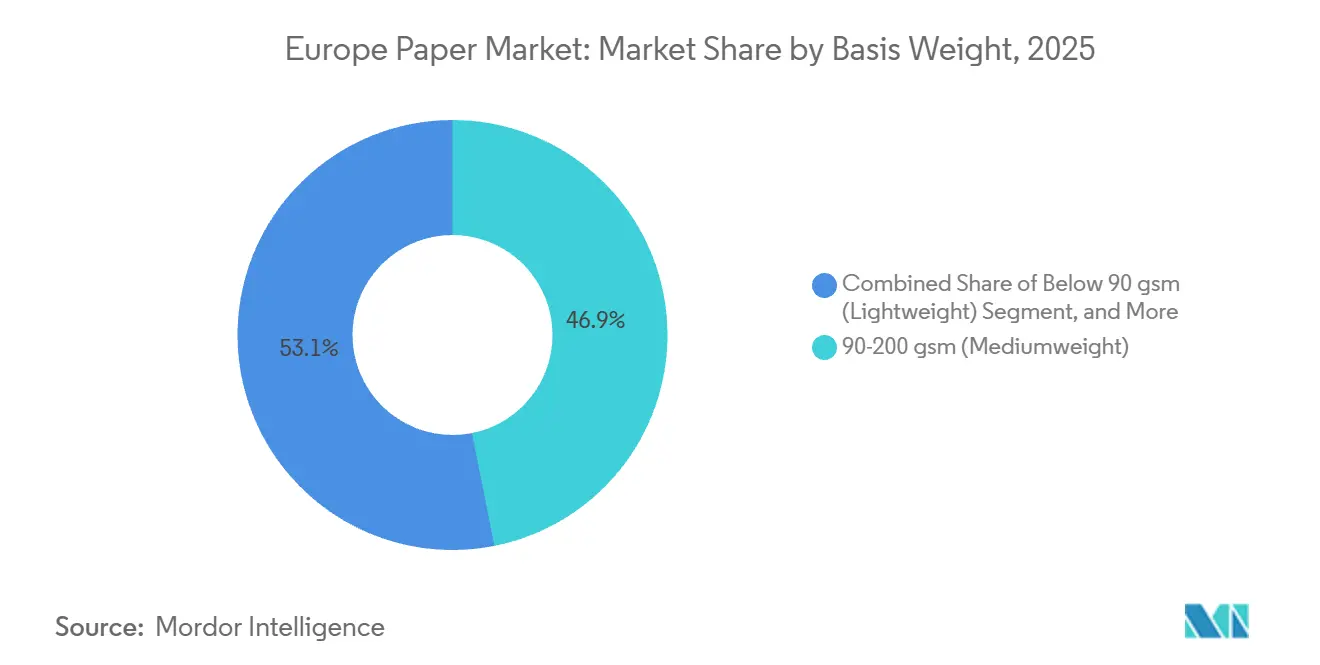
Substrates in the 90-200 gsm band controlled 46.88% of 2025 volume, valued for versatility in folding cartons and office papers. Yet grades below 90 gsm are the fastest climbers at 5.67% CAGR as shippers slice weight to curb freight emissions. Above 200 gsm stock maintains relevance where rigidity is paramount, such as beverage carriers and industrial wraps.
Digital inkjet technology improves ink lay-down, enabling converters to run 120 gsm liners in place of 150 gsm without graphic compromise. EU recyclability metrics further motivate thinner monomaterial solutions that need fewer coatings. Mondi’s 80 gsm barrier-paper, launched in 2024, delivers moisture protection equal to 120 gsm polyethylene-laminated sheets, pointing to future down-gauging potential. The Europe paper market share of sub-90 gsm grades therefore stands to widen as coating chemistries and fiber bonding advance.
By End-use Industry: Packaging Leads, Food-service Accelerates
Packaging and industrial applications absorbed 40.12% of 2025 volume, driven by containerboard, sack kraft, and industrial wraps. Food-service disposables, lifted by the plastic-ban tailwind, are poised to rise at 5.48% CAGR, shining as the fastest end-use. Printing and publishing retreat, while hygiene products provide steady ballast through premium tissue offerings.
Huhtamaki’s additional 15,000 tonnes in Spanish molded-fiber plates answers quick-service restaurants’ region-wide fiber substitution. Parcel proliferation keeps containerboard machines at high utilization. Shift toward take-away dining compounds per-meal packaging intensity, adding momentum. Graphic-paper decline remains irreversible, steering capital toward board and specialty plants that backstop future Europe paper market size expansion.
Geography Analysis
Germany accounted for 24.12% of 2025 tonnage, underpinned by 19.2 million tonnes of output and robust industrial packaging demand. Spain, however, is forecast to log a 6.11% CAGR, leveraging Saica’s USD 194.4 million Zaragoza expansion and proximity to North African export routes. France, Sweden, and Italy grow at mid-single-digit rates, while Eastern Europe benefits from nearshoring supply chains.
Southern, Western, and Northern Europe contribute distinct demand profiles. In Western Europe, Germany, France, and the Netherlands lead in containerboard throughput, benefiting from strong e-commerce logistics corridors. Policy frameworks such as Germany’s VerpackG anchor high recycling rates, ensuring a stable OCC stream for mills. Municipal collection upgrades across France raise feedstock purity, supporting specialty and hygiene grades.
Southern Europe’s growth is anchored in Spain and Italy. Spain’s Zaragoza and Valencia corridors support containerboard capacity catering to export-oriented produce and seafood sectors. Italy’s vibrant food and luxury goods industry underwrites premium folding cartons and label stock demand. Rising adoption of molded-fiber disposable tableware, combined with high tourist arrivals, accelerates tonnage gains in the region.
Northern Europe leverages an integrated forestry supply chain, allowing Finland and Sweden to feed virgin kraft into high-strength packaging and tissue. Bio-powered turbines and district heating schemes moderate energy cost exposure, partially offsetting carbon-credit expenses. The region also pilots enzymatic pulping and lignin by-product valorization, hinting at future value pools that could bolster the Europe paper market share of high-performance substrates.
Regulatory Landscape
The European Union regulatory agenda continues to steer paper demand toward recyclable, fiber-based formats through binding packaging rules and circular-economy enforcement. Regulation (EU) 2025/40 on packaging and packaging waste (PPWR) entered into force on 11 February 2025 and applies from 12 August 2026, tightening requirements on packaging composition, recyclability, and waste minimization, with practical implications for barrier chemistries and mono-material paper structures. In March 2026, the European Commission issued guidance to support more uniform PPWR application across member states.
As the PPWR framework advances toward harmonized implementation, standardization and compliance readiness are becoming more material. Under Article 10(3) of PPWR, the Commission must request development or updates of harmonized standards related to packaging minimization by 12 February 2027. That timeline increases the importance of test methods, recyclability verification, and design-for-recycling specifications. Industry bodies such as CEPI have also emphasized recycling-related standardization needs, aligning mills and converters around common technical requirements as PPWR obligations begin to apply.
Value Chain Analysis
Europe's paper value chain spans certified virgin fiber and recovered paper collection, pulping and papermaking, converting (corrugated, folding cartons, molded fiber, specialty coating), brand-owner procurement, and end-market distribution through retail and e-commerce logistics. Recycled fiber remains central to supply, supported by a high regional paper and board packaging recycling rate (87%), which improves availability and economics for recycled containerboard and certain specialty grades. The chain is increasingly shaped by investments in de-inking, contaminant removal, and barrier-coating capability to keep fiber streams usable for higher-value packaging applications.
Industry structure continues to differentiate between integrated packaging groups with closed-loop collection and converting networks and standalone producers exposed to feedstock and energy volatility. Capacity shifts include conversions away from declining graphic grades into packaging and specialty substrates, tightening the link between upstream mills and downstream converting. In graphic papers, consolidation efforts such as the planned UPM and Sappi joint venture (subject to European Commission merger control approval as of mid-2026) reflect an attempt to rationalize assets and align supply with structurally lower demand, while packaging-focused lines capture more capital and operating attention.
Competitive Landscape
The market is signifying moderate concentration. Smurfit Westrock’s USD 34 billion union increases its clout over recovered-paper procurement and retail contracts, streamlining a Europe-wide mill-and-box-plant network. Stora Enso, UPM-Kymmene, Mondi, and Metsa Group focus on high-return conversions and specialty assets, progressively pruning legacy graphic capacity.
Investment patterns gravitate toward recycled-fiber containerboard, PFAS-free barrier specialty lines, and energy-efficient drying systems. Sappi’s USD 43.2 million German barrier-coating line taps into premium, non-plastic food wraps. Saica, a privately held challenger, expands its Spanish recycled linerboard, capturing share in fast-growing Iberian and export niches. Technology adoption around closed-loop water, AI-driven quality control, and on-demand corrugated printing is becoming a differentiator for margin resilience.
Startups pursuing agricultural-residue pulping and molded-fiber electronics cushioning inject competitive dynamism but must scale to compete on cost. Patent filings emphasize starch-based barrier chemistries, enzymatic pulping, and hybrid flexo-digital presses. Overall, capability to meet tightening environmental rules while keeping costs contained defines the trajectory for winners in the Europe paper market.
Europe Paper Industry Leaders
Stora Enso Group
UPM-Kymmene Corporation
Mondi plc
Metsa Group
Smurfit Westrock
- *Disclaimer: Major Players sorted in no particular order

Market Opportunities and Future Outlook
PPWR timing creates near-term whitespace for packaging papers and boards that demonstrate recyclability and low non-cellulosic content while still delivering grease, moisture, and heat resistance for food contact and take-away use cases. Innovation is therefore concentrating on PFAS-free barrier-coated specialty papers, functional surface treatments, and lightweight structures that maintain performance at lower basis weights. Converters and brand owners are also looking for designs that reduce complexity in sorting and repulping. For mills, the opportunity set extends to coupling packaging-grade production with de-inking and improved recovered-fiber purification to position output for more demanding applications.
Capital allocation and partnership activity provide signals on where capability gaps are being filled. Mondi has completed a EUR 1.2 billion capital expenditure program to expand packaging capacity across corrugated and flexible packaging, reflecting continued emphasis on fiber-based formats and integrated converting. Smurfit Westrock has announced a EUR 600 million investment plan in France over the next three to five years targeting modernization, decarbonization, and sustainable packaging capabilities, which supports demand for upgraded assets and lower-carbon production. Alongside these moves, collaboration across the materials ecosystem, including paper producers, coating suppliers, and equipment providers, supports commercial rollout of bio-based packaging concepts aligned with EU packaging rules and substitution away from single-use plastics in food service and e-commerce.
Recent Industry Developments
- May 2026: UPM-Kymmene Oyj, Michelman and BOBST introduce two validated bio-based paper packaging concepts to support EU packaging rules including SUPD. The collaboration expands the availability of compliant bio-based packaging options for consumer goods. The initiative strengthens demand for packaging papers and barrier coatings by illustrating practical substitutes for conventional plastics.
- March 2026: UPM-Kymmene Corporation announces expansion in India with a new adhesive materials slitting and distribution terminal near New Delhi, expected operational in Q3 2026. The move broadens supply chain reach for adhesives materials in Asia. It supports plastics-free and sustainable packaging supply chains by improving local access and reducing lead times.
- February 2026: Stora Enso Oyj increased packaging paper production capacity by a combined 20,000 tonnes per year at Varkaus and Ostrołęka mills. The capacity expansion reinforces EU packaging paper availability. It strengthens the product mix and helps meet rising demand for packaging in the region.


Research Methodology Framework and Report Scope
Market Definition and Coverage
For this study, the Europe paper market is defined as the demand and supply of paper and paperboard produced and consumed across European countries, measured in physical volume (tonnes) across major paper grades and end uses.
Scope exclusions: We exclude related upstream forestry and pulp operations and we also exclude downstream converted products such as corrugated boxes, folding cartons, and finished tissue rolls when they are priced and sold as manufactured goods rather than paper output.
Segmentation Overview
- By Product Type
- Graphic Papers
- Newsprint
- Other Graphic Papers
- Case Materials
- Sanitary and Household
- Wrappings
- Carton Board
- Specialty Papers
- Graphic Papers
- By Raw-Material Source
- Virgin Fiber
- Recycled Fiber
- Agro-Residue Fiber
- By Basis Weight
- Below 90 gsm (Lightweight)
- 90-200 gsm (Mediumweight)
- Above 200 gsm (Heavyweight)
- By End-use Industry
- Packaging and Industrial
- Printing and Publishing
- Hygiene and Sanitary
- Food-service Disposables
- Other End-use Industries
- By Country
- Germany
- France
- Sweden
- Italy
- Spain
- Rest of Europe
Data Sources, Market Sizing, and Validation
Desk Research
Desk research was used to set the factual floor for the model, especially for production, consumption, trade balance, and paper grade mix. Public sources such as Cepi statistics, Eurostat structural business and trade series, UN Comtrade trade data, FAOSTAT forestry and pulpwood indicators, and OECD macro indicators were reviewed to align the market with observable activity.
We also screened annual reports, investor presentations, and sustainability disclosures from paper and packaging producers and large converters to track capacity changes, grade conversions, and downtime patterns that shift tonnes from one grade to another. Patent databases and credible press coverage were used to identify barrier-coating adoption and recycling technology shifts, while paid subscriptions for company financials, news and financials, and shipment-level trade data were used selectively to validate company exposure and cross-border movements. These desk research sources are illustrative only, and additional references were used for collection, cross-checks, and clarification.
Primary Interviews and Surveys
Primary work focused on validating the grade-level mix and the practical drivers behind tonnage changes, since mills reallocate output quickly when margins shift. We spoke with producers, distributors, recyclers, and large buyers in packaging, publishing, and hygiene to pressure-test assumptions on operating rates, recovered paper availability, and how contract pricing and surcharges are being applied.
Coverage was spread across Europe so regional energy cost differences, trade flows, and demand from export-heavy hubs could be reflected, and then the final model assumptions were rechecked with follow-up calls when a variance appeared.
Distribution of primary research fieldwork respondents
| Company type | Respondent position |
|---|---|
| Top tier: 29% | CXOs: 15% |
| Mid tier: 56% | Functional/Unit leaders: 25% |
| Smaller Players: 15% | Managers: 60% |
Market-Sizing & Forecasting
Sizing starts from a top-down reconstruction where country level paper and paperboard production, net trade, and apparent consumption are mapped into paper grades, then rolled into a consistent Europe total in tonnes. To keep the output grounded, we corroborate totals with selective bottom-up checks, such as sampled mill capacity by grade, utilization ranges discussed in interviews, and a simple ASP times volume sense check when pricing signals are available.
A few market fingerprints were treated as key inputs because they move tonnage quickly, including packaging demand tied to industrial output and e-commerce shipment activity, publishing volumes that influence graphic grades, recovered paper collection and recycling rates that affect supply flexibility, energy cost swings that drive downtime, and announced conversions from newsprint or printing grades into containerboard or specialty grades. Where company disclosures were incomplete, gaps were handled by using peer utilization bands and country averages, then reconciling back to the production and trade totals.
Forecasting was built with scenario analysis supported by short time series smoothing on the most stable indicators, then adjusted using expert expectations on conversion timelines, regulation-led packaging shifts, and likely normalization of inventory cycles. The final forecast was accepted only after the implied grade mix stayed realistic against recent capacity moves and the primary feedback on buyer order patterns.
Data Validation & Update Cycle
Validation is done through multiple checks so the model does not drift away from real market signals. We compare the implied consumption trend against independent indicators like manufacturing output direction, trade balance shifts, and recycling performance, then review any sharp year-to-year moves grade by grade to confirm they are explainable.
Before sign-off, at least two analysts review the assumptions, the unit conversions, and the roll-ups to ensure the totals reconcile across countries and grades. If a new mill start-up, conversion delay, energy shock, or regulation update materially changes volumes, re-contacts are triggered with relevant industry participants to recheck the specific input that moved. The report is refreshed annually, with interim updates for material events, and a final pre-delivery pass is completed so clients receive the latest updated view.
Mordor Intelligence's Europe Paper Market Size Compared Against Other Published Estimates
Published market sizes for Europe paper can look far apart because some sources report value while others report tonnes, and because the boundary between paper output and converted paper products is not always kept consistent. Differences also show up when one estimate anchors on production and trade statistics while another leans more on revenue proxies and broad packaging assumptions.
The spread is often driven by refresh timing and currency timing, where recent price cycles and contract pass-through can change value measures faster than underlying tonnes, and by how average selling prices are applied across grades that have very different pricing behavior. When the same year is recalculated using the latest production and trade series and then rechecked through interview-based utilization and grade mix logic, the result stays closer to the real demand pool, which is the refresh-led approach used in this study by Mordor Intelligence.
Benchmark comparison
| Source | Market Size | Gaps in Research Methodology |
|---|---|---|
| Mordor Intelligence | USD 71.14 M (2025) | |
| Trade Journal A | USD 95.00 B (2024) | Reported in revenue terms and likely mixes paper output with converted paper packaging, which can inflate totals when packaging price cycles are strong, and it may use older exchange rates for multi-country conversion. |
| Industry Portal B | USD 103.10 B (2025) | Uses a broader paper products boundary and a value-based view that depends heavily on assumed ASP progression across grades, with limited visibility on how it reconciles back to Europe production and net trade tonnes. |
Overall, the comparison shows that unit choice and boundary setting explain most of the gap, since a tonnes-based market will not line up with value totals unless grade-level pricing and conversion scope are explicitly modeled. By keeping the market tied to production, net trade, and grade mix checks that can be repeated year after year, the sizing remains transparent and easier to reconcile when new statistics or mill changes arrive.


Key Questions Answered in the Report
How large will the Europe paper market be by 2031?
The market is forecast to reach 90.08 million tonnes by 2031, supported by steady 4.09% CAGR growth in recycled containerboard and specialty papers.
Which product segment is expanding the fastest?
Specialty papers, particularly barrier-coated and release-liner grades, are projected to grow at a 5.16% CAGR through 2031.
Why is Spain the fastest-growing country in European paper?
New recycled-containerboard capacity, favorable EPR incentives, and access to North African export channels lift Spains expected 6.11% CAGR.
How are EU regulations shaping material choices?
The PPWR caps non-cellulosic content at 5% and mandates recyclability, which tilts converters toward monomaterial fiber packs and boosts demand for containerboard.
What strategies help mills manage pulp-price volatility?
Vertical integration into pulp assets, long-term OCC supply contracts, and diversification into agro-residue fiber blends mitigate input-cost swings.
Which technologies are redefining competitiveness?
Closed-loop water systems, PFAS-free starch barriers, and on-demand inkjet corrugated printing cut costs, meet stricter ESG rules, and unlock higher-margin digital customization.
Page last updated on:


 Your data is secure and never sold or shared.


