
Market Overview
| Study Period | 2021 - 2031 |
|---|---|
| Forecast Data Period | 2026 - 2031 |
| Base Year Market Size (2025) | USD 72.15 Billion |
| Market Size (2026) | USD 75.28 Billion |
| Market Size (2031) | USD 97.32 Billion |
| Growth Rate (2026 - 2031) | 5.27 % |
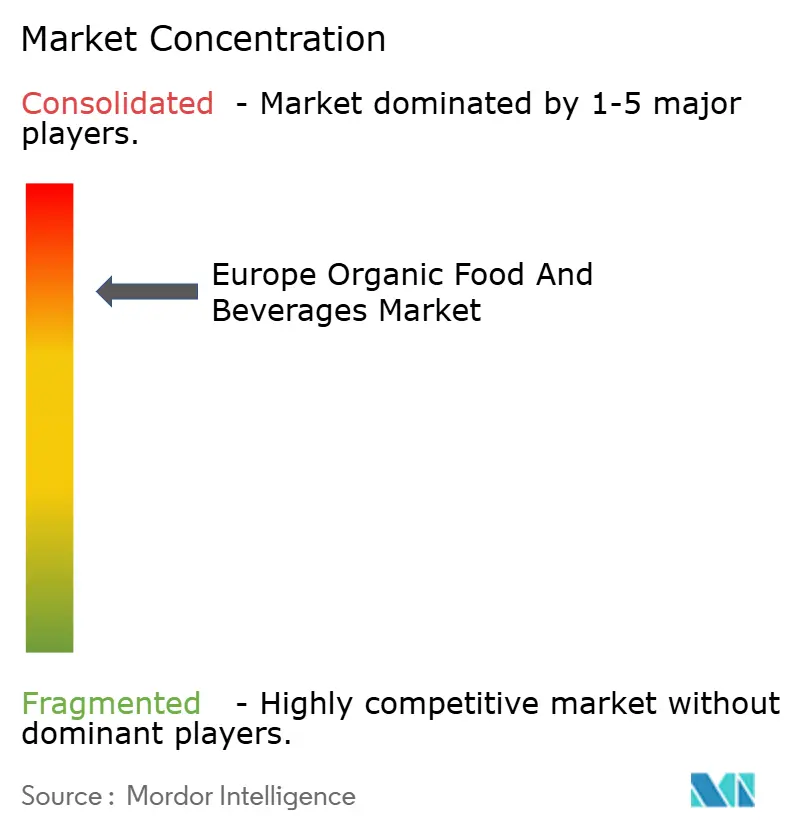
| Market Concentration | High |
Major Players *Disclaimer: Major Players sorted in no particular order Image © Mordor Intelligence. Reuse requires attribution under CC BY 4.0. | |
Europe Organic Food and Beverages Market Analysis by Mordor Intelligence
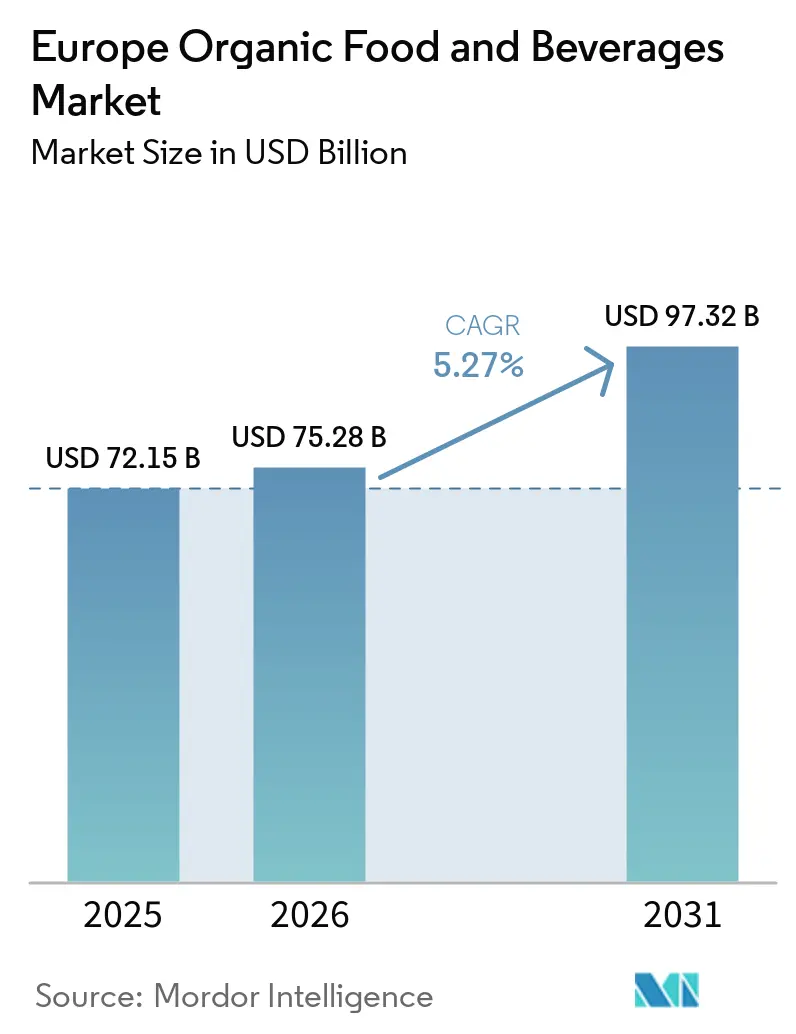
The Europe organic food and beverages market size is valued at USD 75.28 billion in 2026, growing from the 2025 value of USD 72.15 billion, and is forecast to climb to USD 97.32 billion by 2031, advancing at a 5.27% CAGR. Momentum comes from rising health awareness, premiumization of high-value categories, and the rapid scaling of digital commerce that lowers the friction of premium-price purchases. Multinationals are locking in certified supply through regenerative-agriculture contracts, while niche disruptors exploit functional innovation to secure urban millennial demand. Shelf-life-extending technologies, stronger EU organic regulations, and corporate Scope 3 decarbonization targets further reinforce demand resilience. Supply-side shocks from weather volatility and Brexit-related inspections are being absorbed through localized sourcing, nitrogen-flush canning, and retailer discounting strategies that conserve volume yet protect value growth.
Key Report Takeaways
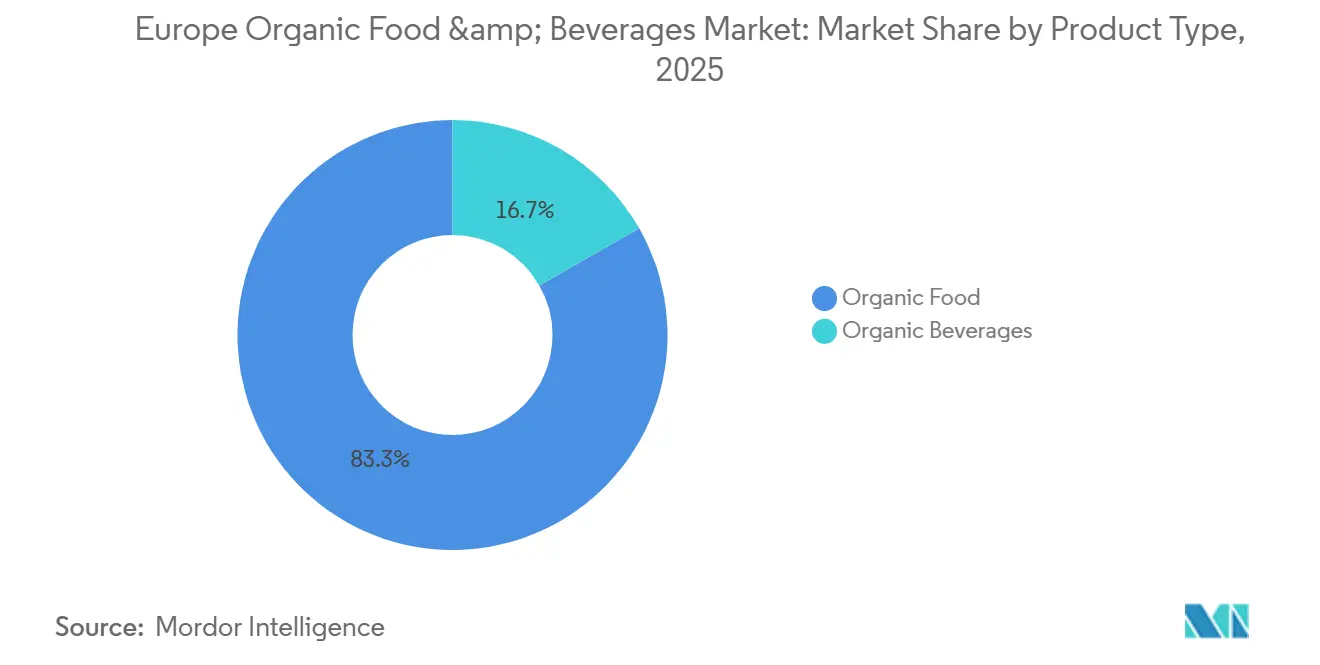
- By product type, organic food led with 83.26% revenue share in 2025, while organic beverages are forecast to advance at a 6.78% CAGR through 2031.
- By form, fresh/chilled products accounted for 67.75% of the European organic food and beverages market share in 2025, yet canned formats are projected to expand at a 7.18% CAGR to 2031.
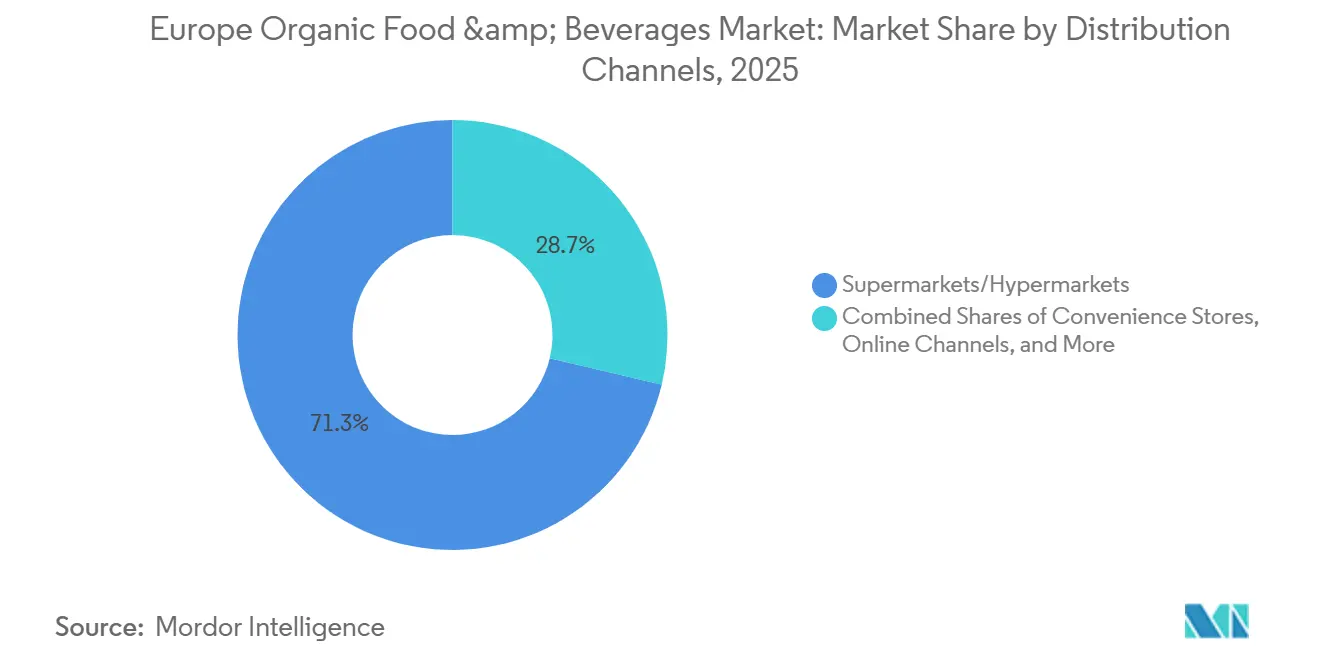
- By distribution channel, supermarkets/hypermarkets captured 71.28% of the 2025 value, while online retail channels are expected to post a 6.85% CAGR, the fastest among all channels.
- By geography, Germany held 35.31% of regional sales in 2025, whereas Poland is positioned for the quickest growth at a 7.11% CAGR through 2031.
Note: Market size and forecast figures in this report are generated using Mordor Intelligence’s proprietary estimation framework, updated with the latest available data and insights as of January 2026.
Europe Organic Food and Beverages Market Trends and Insights
Drivers Impact Analysis*
| Drivers | (~) % Impact on CAGR Forecasts | Geographic Relevance | Impact Timeline |
|---|---|---|---|
| Rising Health Awareness Drives Demand for Clean-Label Products Free From Pesticides and Additives | +1.2% | Global, with highest intensity in Germany, Netherlands, France | Medium term (2-4 years) |
| Plant-Based Trend Fuels Organic Dairy Alternatives and Vegan Beverages | +1.0% | Western Europe (Germany, United Kingdom, Netherlands), expanding to Poland, Spain | Short term (≤ 2 years) |
| Urban Millennials Prioritize Organic for Immunity and Wellness | +0.8% | Metropolitan areas across Germany, France, United Kingdom, Netherlands, Belgium | Medium term (2-4 years) |
| Sustainability Certifications Align with Scope 3 Emissions Goals | +0.7% | Germany, France, Netherlands, United Kingdom (corporate procurement focus) | Long term (≥ 4 years) |
| Strong Regulatory Framework via EU Organic Regulation | +0.6% | EU-27 member states, with spillover to United Kingdom post-Brexit alignment discussions | Long term (≥ 4 years) |
| Premiumisation of High-Penetration Categories | +0.9% | Germany, France, United Kingdom, Netherlands (high disposable income markets) | Short term (≤ 2 years) |
| Source: Mordor Intelligence | |||
Plant-Based Trend Fuels Organic Dairy Alternatives and Vegan Beverages
In 2024 and 2025, the demand for oat milk in Germany and the United Kingdom was expected to grow significantly, with sales projected to increase by double digits. This growth is driven by manufacturers improving formulations to achieve barista-grade foam stability and fortifying products with calcium and B12 to closely match the nutritional profile of dairy. Oatly's strategic decision in 2024 to source oats locally from British farms not only reduced logistics-related emissions by an estimated 15% but also mitigated risks associated with weather volatility in Eastern Europe. This move aligned well with the sustainability goals of United Kingdom retailers, particularly those focused on meeting Scope 3 carbon reduction targets. However, plant-based options continue to gain traction among flexitarian consumers, who often prioritize animal welfare considerations over carbon footprint alone. Additionally, the functional beverage segment is experiencing rapid innovation. Brands such as Minor Figures are introducing organic oat drinks infused with adaptogens and nootropics, targeting cognitive performance and mental well-being. These value-added products are positioned as premium offerings, enabling them to command price premiums of 40 to 60% compared to standard oat milk.
Urban Millennials Prioritize Organic for Immunity and Wellness
In Berlin, Paris, Amsterdam, and London, urban consumers are increasingly perceiving organic food as a proactive investment in their health rather than merely a lifestyle choice. According to survey data from 2025, 62% of urban millennials identify immunity support as their primary motivation for purchasing organic products, surpassing environmental concerns. This demographic shows a strong preference for organic produce with high ORAC scores—such as blueberries, kale, and turmeric—and demonstrates a willingness to pay a premium of 35 to 50% for cold-chain systems that maintain the phytonutrient content of these products. Retailers with robust last-mile logistics have significantly benefited from this behavior, as it aligns with consumer demand for quality and freshness. E-commerce platforms have effectively leveraged this trend by bundling organic staples with value-added services, including telehealth consultations and personalized nutrition plans. This approach has successfully converted one-time buyers into loyal subscription customers, who exhibit a lifetime value 70% higher than that of traditional walk-in shoppers.
Sustainability Certifications Align with Scope 3 Emissions Goals
Multinational food-service operators and retail chains are increasingly incorporating organic certification into their supplier scorecards. This strategic shift serves as a proxy for Scope 3 carbon reductions and is driving contract volumes toward farms that implement third-party-verified regenerative agricultural practices. Danone has announced a significant commitment of EUR 1.1 billion for the period between 2024 and 2030 to support regenerative agriculture initiatives. In partnership with Soil Capital, Danone plans to enroll 50,000 European dairy and crop farms in carbon-farming programs. These programs reward farmers based on measurable carbon sequestration outcomes rather than solely focusing on compliance with input standards. This approach is gaining traction among private-equity firms, which view certified organic supply chains as resilient assets. These supply chains are considered inflation-hedged and capable of maintaining stable premiums, even during periods of economic uncertainty. Additionally, in 2024, the European Investment Bank provided USD 20 million in funding to Heura Foods, a Spanish company specializing in plant-based protein production. This investment aims to enhance organic soy sourcing from EU-based farms, reducing dependency on South American imports and shortening supply chains by an average of 4,000 kilometers, thereby improving efficiency and sustainability[1].
Premiumisation of High-Penetration Categories
Parents are increasingly viewing organic infant formula and baby food as essential investments in their children's health. This trend of premiumization is evident, with Hipp's carbon-neutral production facilities in Germany allowing the brand to charge a 25% premium over conventional counterparts, all while securing a 40% market share in Central Europe. Alnatura, boasting over 220 specialty stores throughout Germany, achieved a notable USD 1.4 billion in revenue for the fiscal year 2023/2024. Their success is attributed to private-label organic products, which are priced 15 to 20% lower than those of multinational brands, yet still command a 30% premium over conventional supermarket offerings. This strategic pricing effectively attracts middle-income households looking to upgrade from discount chains. Meanwhile, cold-pressed organic juices are transitioning from niche health-food outlets to mainstream supermarkets. Brands are employing high-pressure processing (HPP) to extend shelf life to 45 days without resorting to thermal pasteurization. This method not only preserves enzyme activity but also justifies the USD 6 to USD 8 per liter price tag. In the realm of beverages, organic wine and craft beer are gaining traction as premium products. In countries like France, Italy, and Belgium, the combination of appellations, brewery heritage, and organic certification allows these drinks to command a 40 to 70% premium over their conventional counterparts.
Restraints Impact Analysis*
| Restraints | (~) % Impact on CAGR Forecasts | Geographic Relevance | Impact Timeline |
|---|---|---|---|
| Supply Shortages from Weather Events and Limited Farmland | -0.8% | Southern Europe (Spain, Italy, France), Eastern Europe (Poland, Romania) | Short term (≤ 2 years) |
| Higher Prices Limit Low-Income Consumer Access | -0.6% | Southern and Eastern Europe (Spain, Italy, Poland, Romania, Bulgaria) | Medium term (2-4 years) |
| Short Shelf Life of Fresh Organics | -0.4% | Pan-European, with acute impact in regions with fragmented cold-chain infrastructure | Medium term (2-4 years) |
| Post-Brexit United Kingdom Trade Barriers | -0.3% | United Kingdom and EU-27 cross-border trade corridors | Short term (≤ 2 years) |
| Source: Mordor Intelligence | |||
Supply Shortages from Weather Events and Limited Farmland
In 2024, extreme rainfall wreaked havoc on wheat and vegetable harvests in France, Germany, and Poland. This led to a year-over-year 12% drop in organic cereal availability, compelling processors to resort to non-EU imports to fulfill their contracted volumes. In Western Europe, the conversion rates for organic farmland have hit a plateau. The prime parcels have already made the switch, leaving only marginal lands that yield less and incur higher input costs. This scenario deters new entrants, especially in the absence of direct subsidies. Owing to the co-financing from the European Union's Common Agricultural Policy (CAP), Poland saw an 8% increase in organic acreage in 2024. However, due to first-year yield penalties and knowledge gaps among newly converted farmers, the total output only rose by 4%. In 2024, a shortage of organic livestock feed drove up costs by 15 to 20%. This surge in expenses squeezed margins for organic dairy and meat producers, who found it challenging to pass the full cost increase onto their price-sensitive consumers in Southern and Eastern Europe, according to the European Trade[2].
Higher Prices Limit Low-Income Consumer Access
Organic products typically carry a premium of 30 to 50% compared to conventional alternatives in most European markets. This price disparity limits accessibility for households in the bottom two income quintiles, particularly in Spain, Italy, Poland, and Romania, where disposable incomes are lower than Western European averages. Inflation in 2024 and 2025 reduced real wages across Southern and Eastern Europe. Consequently, 28% of surveyed consumers either shifted from organic to conventional products or decreased their purchase frequency. This trend was especially evident in the fresh produce and dairy categories. Discount retailers Aldi and Lidl addressed this issue by introducing organic private labels priced 10 to 15% lower than branded options. However, these private labels still cost 20 to 30% more than conventional store brands, maintaining an affordability gap for low-income consumers. In 2024, government subsidy programs in France and Germany, designed to provide vouchers for organic produce to low-income families, reached only 12% of eligible households. Limited awareness and bureaucratic obstacles hindered the effectiveness of these programs, leaving structural demand challenges unresolved, according to the French Ministry of Agriculture[3].
*Our forecasts treat driver/restraint impacts as directional, not additive. The impact forecasts reflect baseline growth, mix effects, and variable interactions.
Segment Analysis
By Product Type: Functional Beverages Propel Faster Value Creation
Organic Beverages recorded a 6.78% CAGR outlook, well above the European organic food and beverages market average. Venture-backed players deploy probiotics and adaptogens that allow 40–60% mark-ups, and profitability gains appear as Oatly lowered per-liter costs 18% via regional oat sourcing. Direct-trade coffee and tea models pay farmers 20–30% premiums over Fair-Trade minima, aligning with ethically minded consumers and accelerating specialty-cafe demand. Within Organic Food, fruit and vegetables dominate volumes because of strong pesticide-avoidance associations, while meat, fish, and poultry remain niche at under 10% of sales due to limited certified capacity and steep premiums.
Value creation continues as dairy bifurcates. Organic milk volumes ease in core Western markets where plant alternatives capture younger cohorts, yet cheese and yogurt upgrade through probiotic credentials. Frozen and processed foods, aided by blast-freezing and retort solutions, extend reach to regions lacking sophisticated cold chains. Snack lines such as organic chocolate bars priced at USD 4–6 per 100 g reflect mid-single-digit growth yet demonstrate consumer acceptance of higher unit economics. Consequently, the Europe organic food and beverages market size expansion remains anchored by a diversified product pipeline.

By Form: Ambient-Stable Solutions Cut Waste And Boost Reach
Canned products are on track for a 7.18% CAGR, the fastest among form factors, because nitrogen-flush and retort sterilization push shelf life to 36 months without preservatives. Organic canned tomatoes and legumes win shelf space in discount chains that prize convenience and price stability. Frozen formats notch mid-single-digit gains as blast-freezing preserves nutrient content, serving food-service channels hungry for year-round consistency.
Fresh/Chilled organics still hold 67.75% of the European organic food and beverages market share in 2025, but 5–8-day shelf lives drive 30–40% retail waste. Supermarkets deploy dynamic pricing to clear near-expiry goods, protecting value though margin compression persists. Modified-atmosphere packaging adds two or three days of sell-through yet costs EUR 0.15-0.25 per pack, squeezing mid-tier labels. Subscription produce boxes boast 95% sell-through by synchronizing harvests with deliveries, but remain under 5% of Fresh/Chilled volume.
By Distribution Channel: Digital Commerce Accelerates Premium Recapture
Online Channels are set for a 6.85% CAGR as predictive inventory and same-day delivery facilitate premium-price purchases and furnish brands with first-party data. Amazon Fresh and Ocado added 25% more organic SKUs in 2024-2025, achieving sub-two-hour fulfillment in top urban ZIP codes. Direct-to-consumer models secure 40–50% gross margins, though EUR 30-50 acquisition costs per subscriber temper profitability.
Supermarkets and Hypermarkets still command 71.28% of the 2025 value, leveraging scale to undercut specialty stores by 10–15% on price, yet losing share to online and discount formats. Aldi and Lidl boosted organic SKU counts 30% and attracted 22% more category shoppers, albeit at gross margins 500–700 bps below branded equivalents. Convenience stores contribute less than 5% due to limited shelf space and high throughput requirements. Specialty stores maintain a 12–15% share by coupling deep assortments with staff expertise, even as rent pressure limits platform extension.
Geography Analysis
Germany’s 35.31% 2025 share underscores deep “Bio” culture, dense specialty networks, and purchasing power. Alnatura generated USD 1.4 billion in revenue in fiscal 2023-2024 at 25–30% gross margins, confirming specialty viability. Discount leaders extended private-label organics 30%, democratizing access yet compressing supplier margins. Growth moderates to low single digits as penetration tops 6.8% of food sales, but premiumization in infant formula and cold-pressed juice sustains value expansion. The UK diverged after Brexit as Certificate of Inspection protocols added three to five days to EU shipments, spurring domestic sourcing despite 10–15% cost premiums, which paradoxically strengthened local farm economics while fragmenting cross-border logistics.
Poland leads growth at a 7.11% CAGR, fueled by CAP subsidies and middle-class upgrades. Biedronka and Lidl raised organic SKU depth 25% in Warsaw and Krakow, turning certification into a health and status marker. Acreage expanded 8% in 2024, yet yield drag held output growth to 4%, creating pricing tension that nonetheless sustains farmer economics. France, Italy, and Spain collectively command nearly 30% share thanks to Mediterranean crop suitability, yet affordability headwinds triggered partial consumer trade-down during the 2024-2025 inflation spike.
Netherlands and Belgium outperform on per-capita spend because Rotterdam enables efficient re-exports and public institutions mandate 30% organic content in school meals, respectively. Russia lags at under 1% penetration due to sparse certification infrastructure, though affluent Moscow households provide niche demand. Rest of Europe, including Scandinavia and the Balkans, grows 6–8% as accession candidates mirror EU standards to unlock subsidy flows.
Regulatory Landscape
Organic production and labeling across the EU are governed primarily by Regulation (EU) 2018/848 (applicable since 1 January 2022), which sets production rules, certification requirements, and use of the EU organic logo. Organic imports also operate under mandatory electronic Certificates of Inspection handled through the European Commission’s TRACES system, which influences documentation, lead times, and compliance costs for non-EU supply supporting European brands and retailers.
During 2025-2026, policy work has focused on keeping the EU organic rulebook “fit for the future,” including active discussions on amending Regulation (EU) 2018/848 that cover third-country import labeling and production rules (Council document ST-9152-2026-INIT). A key time-bound issue is the scheduled expiry of equivalence recognition for third-country organic systems on 31 December 2026, alongside proposals to extend recognition to 31 December 2036 to protect trade continuity. The policy agenda also reflects ongoing adjustments linked to the Court of Justice of the EU decision in Case C-240/23 (Herbaria Krauterparadies II), affecting EU organic logo use on certain imported products.
Value Chain Analysis
The European organic food and beverages value chain runs from certified farms and producer groups through collection and primary handling, processing and packaging, wholesale and import logistics, and into retail channels such as supermarkets/hypermarkets, discounters, specialty organic stores, and online platforms. Compliance and scale increasingly depend on EU import and traceability infrastructure: EU imports of organic agri-food products rose 6.4% in 2024 to 2.64 million tonnes, with the Netherlands, Germany, and Belgium among leading entry and distribution hubs. This reinforces the influence of importers, control bodies, and downstream logistics in protecting product integrity.
Execution bottlenecks tend to cluster in the “middle” of the chain. OrganicTargets4EU highlights frictions in processing capacity, logistics fragmentation, and risk-sharing mechanisms that can push downgrading of organic raw materials into conventional channels when certified throughput is constrained. Perishables remain exposed to weak cold chains and limited digitized inventory tools. Retailers and brand owners respond through tighter vertical coordination, including multi-year regenerative or certified sourcing programs, and through packaging and shelf-life investments designed to reduce waste and improve fill rates across fresh/chilled, canned, and frozen formats.
Competitive Landscape
High concentration defines the Europe organic food and beverages market. Danone, Nestlé, and Arla Foods leverage regenerative farming contracts that secure volumes and open carbon-credit monetization. Danone targeted 50,000 farms for outcome-based programs by 2030, creating a durable feedstock hedge. Nestlé deploys blockchain for traceability in organic baby food and plant-based lines, allowing 30–40% premiums.
Oatly and Veganz exploit direct-to-consumer channels, functional claims, and regionally sourced inputs to resonate with millennials, with Oatly reaching profitability after an 18% cost reduction. Private-equity shops chase mid-tier brands with USD 50-200 million in revenue, treating certified supply chains as inflation-proof assets. Aldi and Lidl disrupt from below with private-label organics at mid-tier conventional prices, compressing supplier margins by 3–5 points.
Specialty retailers defend share through curated ranges and staff storytelling, yet online giants erode traffic by matching assortment and adding delivery convenience. Innovation focuses on traceability tech, with 40% of surveyed brands deploying IoT sensors and blockchain for cold-chain proof points. White-space frontiers include organic aquaculture, insect protein, and cellular agriculture, areas still nascent in regulation and ripe for early movers.
Europe Organic Food and Beverages Industry Leaders
-
General Mills, Inc.
-
Nestlé S.A.
-
Danone S.A.
-
Amy's Kitchen, Inc.
-
The Hain Celestial Group, Inc.
- *Disclaimer: Major Players sorted in no particular order
Market Opportunities and Future Outlook
Processing and ingredient-scale investments are creating whitespace in organic convenience foods and functional nutrition, where manufacturers can convert certification into higher value per unit and better utilization of constrained certified supply. Examples include FERM FOOD’s March 2026 acquisition of a manufacturing site in Skovlund, Denmark, aimed at scaling fermented plant-based ingredient capacity to 20,000 tonnes per year, and portfolio capital moving into natural nutrition, such as 3i’s June 2026 investment in Laboratoire Nutergia in France. These moves track with the report’s focus on premiumization and functional innovation in beverages and nutrition-adjacent offerings, while also addressing value-chain leakage points by expanding certified processing throughput.
Operational improvements are also coming from regulatory simplification efforts, which matter most for smaller operators and mixed supply chains. The European Commission’s proposal published on 16 December 2025 to revise the EU Organic Regulation, together with the European Parliament Agriculture and Rural Development Committee’s July 2026 position to update production rules (including higher thresholds for small-operator exemptions), targets reduced administrative burden and clearer operating rules. Separately, the EU Farm to Fork objective of 25% organic agricultural land by 2030 (with 11.1% of EU agricultural land organic in 2024) keeps conversion, aggregation, and retailer sourcing programs active, supporting opportunities for suppliers that can secure certified inputs while meeting traceability and documentation requirements for both EU and import-dependent supply.
Recent Industry Developments
- June 2026: Nestle completed the full acquisition of Germany-based meal solutions company Yfood, after holding a 49% stake since 2023. The brand operates across 30 European markets and is being integrated into Nestle’s Nutrition division, strengthening its position in functional and on-the-go nutrition formats that overlap with premium organic purchasing occasions.
- March 2025: Yeo Valley Organic launched its first meat product, 100% British free-range organic grass-fed beef burgers, distributed in 362 Tesco stores. The move extends a major UK organic dairy brand into certified meat, using a national retailer footprint to scale a higher-premium protein category where certified supply is structurally tighter.
- January 2024: The European Investment Bank provided USD 20 million in funding to Spain-based Heura Foods to support its plant-based protein expansion and increase organic soy sourcing from EU farms. The financing supports shorter, more regionally anchored supply chains for organic plant proteins and reduces reliance on long-haul imported inputs.
Research Methodology Framework and Report Scope
Market Definition and Coverage
This market covers the value of certified organic food and organic beverages sold across Europe, captured across mainstream and specialty retail formats as well as online channels.
Scope exclusions: Non-food organic categories, such as personal care and household products, are excluded from this scope, even when they are sold in the same retail outlets.
Segmentation Overview
- Product Type
- Organic Food
- Fruit and Vegetables
- Meat, Fish and Poultry
- Dairy Products
- Frozen and Processed Foods
- Other Foods
- Organic Beverages
- Fruit and Vegetable Juices
- Dairy-based
- Coffee
- Tea
- Other Beverages
- Organic Food
- By Form
- Fresh/Chilled
- Canned
- Frozen
- By Distribution Channel
- Supermarkets/Hypermarkets
- Convenience Stores
- Specialty Stores
- Online Stores
- Other Distribution Channels
- By Geography
- Germany
- United Kingdom
- France
- Italy
- Spain
- Russia
- Netherlands
- Belgium
- Poland
- Rest of Europe
Data Sources, Market Sizing, and Validation
Desk Research
Desk research was used to anchor the model with consistent definitions and with trackable demand signals across Europe. We referenced public, non-paywalled sources such as FiBL statistics on organic retail sales and farmland, Eurostat retail and price series, EU organic regulation and certification guidance, and FAOSTAT supply indicators for key crops and livestock (as organic supply constraints often shape pricing).
To convert signals into a usable value model, we also reviewed company annual reports, investor presentations, retailer category updates, and reputable press coverage on organic price premiums and private label expansion. Where needed, paid subscriptions were used only to speed up company financial screening, patent scans tied to organic processing and packaging, and to cross-check import and export movements for select organic-coded product flows. The sources listed here are illustrative, and many other documents were read to collect data, validate assumptions, and clarify open questions.
Primary Interviews and Surveys
Primary research uses expert interviews and surveys with retailers, organic producers, processors, distributors, certification specialists, and food industry advisers across Europe. We use responses to test channel shares, price movement, private-label penetration, supply gaps, and demand changes, then check unclear answers against desk evidence before final analysis.
Distribution of primary research fieldwork respondents
| Company type | Respondent position |
|---|---|
| Top tier: 28% | CXOs: 15% |
| Mid tier: 47% | Functional/Unit leaders: 35% |
| Smaller Players: 25% | Managers: 50% |
Market-Sizing & Forecasting
Sizing starts from a top-down build where organic retail demand is reconstructed using Europe-level consumption signals, price series, and category mix, and then it is split across organic food and organic beverages in line with observed purchasing patterns. To keep the total realistic, we corroborate it with selective bottom-up approximations such as sampled shelf price points multiplied by likely volumes, distributor channel checks, and revenue sanity checks for a short list of visible organic portfolios. If the spread looks too wide, we adjust the totals accordingly.
Inputs used in the model include organic price premiums versus conventional, inflation-linked shifts in unit purchasing, the expansion rate of online grocery for organic baskets, organic farmland and conversion trends, and private label penetration in key retail formats. Forecasts are built using scenario analysis because demand is sensitive to household budgets and to retailer pricing moves, and we align the scenario weights with what interviewees expect for premium elasticity and supply availability. Where bottom-up gaps appear, such as limited visibility on smaller specialist stores, we impute the missing portion from channel shares and check it against country-level organic spend benchmarks.
Data Validation & Update Cycle
Validation is done through triangulation across the model output, independent organic retail benchmarks, and practical checks from interviews. We review anomalies such as sudden jumps in implied spending, unusual country splits, or price-led growth that does not match observed inflation, and then the assumptions are reworked and re-tested before sign-off.
A second analyst reviews the logic, formulas, and year-to-year continuity so that errors are caught early and explained clearly. Reports refresh annually, with interim updates triggered by material events such as major regulatory changes, sharp inflation swings, or step-changes in retailer organic pricing. Before delivery, we do a final pass to ensure the latest publicly available signals are reflected in the tables and commentary.
Mordor Intelligence's Europe Organic Food and Beverages Market Size Compared Against Other Published Estimates
Published figures for this market can vary because sources do not always track the same selling points and they often apply different currency timing, pricing bases, and country coverage inside Europe. Some also mix retail sales with broader value-chain measures, which can make the number look larger even if consumption is not.
Non-food organic categories such as personal care often get bundled into wider organic market totals, and that item sits outside Mordor Intelligence's scope for this report, which keeps the estimate focused on food and beverage consumption value in Europe. Differences also come from how price premiums are handled during inflationary periods, since one model may hold premiums flat while another escalates them with category-level pricing. Update cadence can also differ when new country retail data is released, which shifts annual estimates.
Benchmark comparison
| Source | Market Size | Gaps in Research Methodology |
|---|---|---|
| Mordor Intelligence | USD 72.15 B (2025) | |
| Industry Association A | USD 64.10 B (2024) | Reported as Europe organic retail sales in euros and then converted, which can understate value versus a later USD base year, and it is presented as a retail-only total without the same category split logic used for food versus beverages. |
| Government Brief B | USD 58.50 B (2024) | Uses a broad EU organic market sales definition that can mix food with other organic products, and the estimate is tied to EU-27 framing rather than a wider Europe view, which shifts country coverage and the resulting total. |
The table shows that the biggest gaps come from what gets counted inside the organic total, which year and currency are used, and whether Europe is treated as EU-only or as a wider regional basket. By keeping inputs tied to observable retail demand signals, clear category coverage, and repeatable pricing and channel checks, the final value stays easier to reconcile against real-world spending patterns.
Key Questions Answered in the Report
What is the current value of the Europe organic food and beverages market?
The market is valued at USD 75.28 billion in 2026 and is forecast to reach USD 97.32 billion by 2031.
Which product category is growing faster, Organic Food or Organic Beverages?
Organic Beverages are projected to grow at a 6.78% CAGR through 2031, outpacing Organic Food.
Which form factor is expanding most rapidly?
Canned organics are forecast to rise at a 7.18% CAGR as shelf-life technologies improve.
Which country leads regional sales and which is the fastest growing?
Germany leads with 35.31% of 2025 value, while Poland is the fastest expanding at a 7.11% CAGR to 2031.