
Market Overview
| Study Period | 2021 - 2031 |
|---|---|
| Forecast Data Period | 2026 - 2031 |
| Base Year Market Size (2025) | 45.10 gigawatt |
| Market Volume (2026) | 54.18 gigawatt |
| Market Volume (2031) | 135.79 gigawatt |
| Growth Rate (2026 - 2031) | 20.16 % |
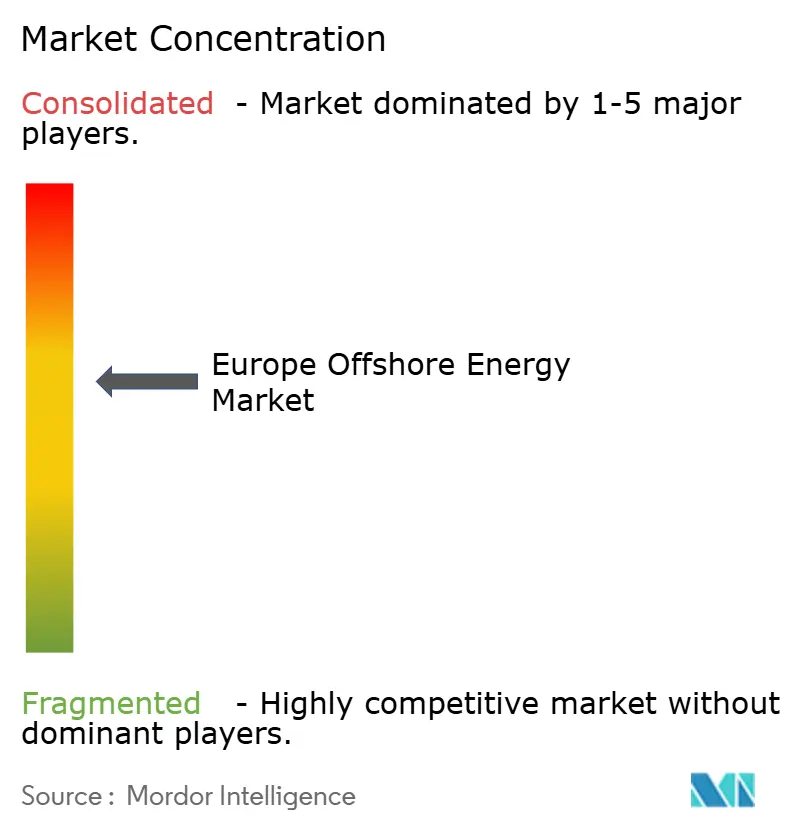
| Market Concentration | Medium |
Major Players *Disclaimer: Major Players sorted in no particular order Image © Mordor Intelligence. Reuse requires attribution under CC BY 4.0. | |
Europe Offshore Energy Market Analysis by Mordor Intelligence
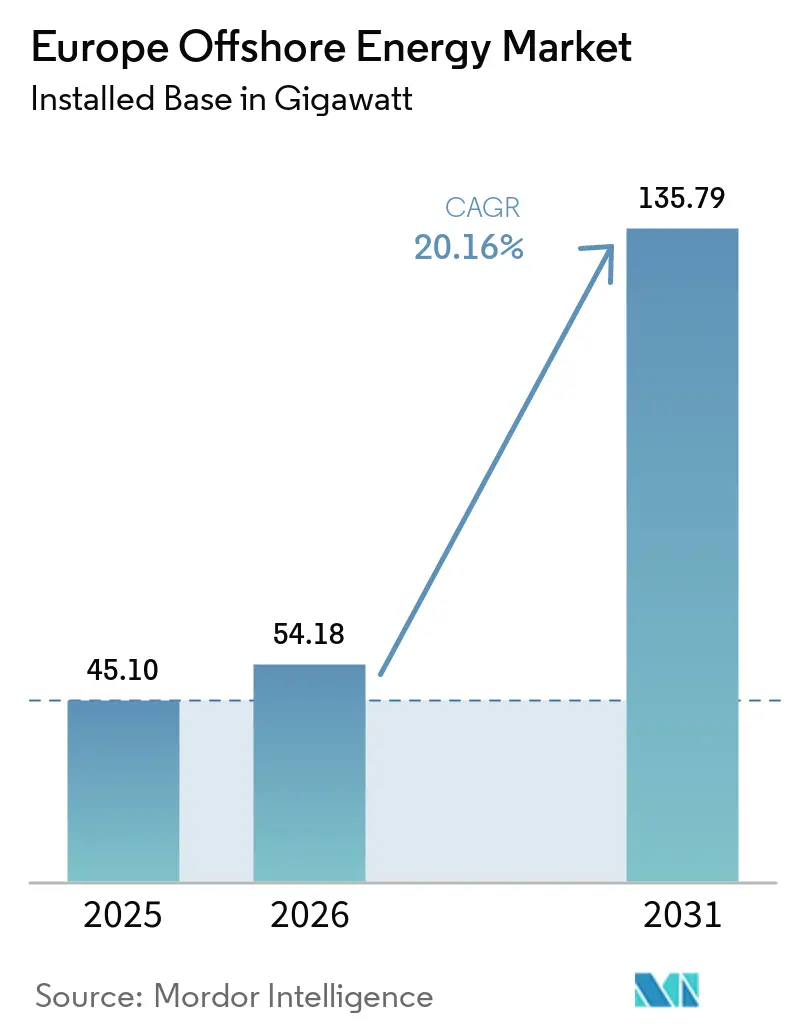
Europe Offshore Energy Market size in 2026 is estimated at 54.18 gigawatt, growing from 2025 value of 45.10 gigawatt with 2031 projections showing 135.79 gigawatt, growing at 20.16% CAGR over 2026-2031.
This growth trajectory mirrors the European Union’s sharpened Green Deal ambitions, unprecedented policy visibility, and accelerating deployment of next-generation 15–20 MW turbines that compress development timelines and unlock deeper-water sites. Record additions of 4.2 GW in 2023 pushed wind’s contribution to 19% of the EU’s electricity mix, with a stated 35% target for 2030; policy mechanisms such as contracts for difference (CfDs) and expedited maritime spatial planning increase developer confidence, spur supply-chain investments, and lower the cost of capital. Developers also benefit from the REPowerEU program’s push for energy security, which has shifted offshore wind from 14% to 19% of Europe’s electricity mix in only two years and lifted output from 375 TWh to 466 TWh, while the Ostend Declaration commits nine North Sea states to 120 GW by 2030 and 300 GW by 2050. Technology momentum is equally striking: 5–10 MW turbines still dominate the water, but >15 MW units already anchor commercial orders such as Vestas’ 1,020 MW Nordlicht 1, positioning the European offshore energy market for scale-driven cost compression and higher capacity factors.
Key Report Takeaways
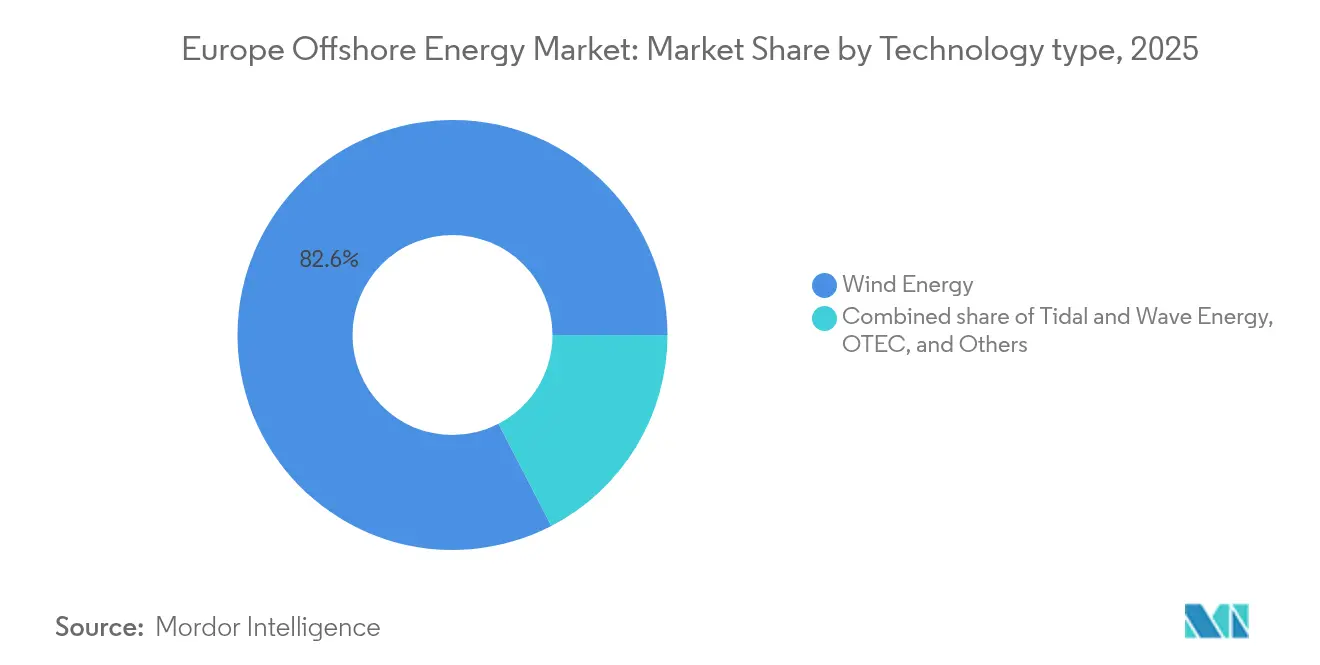
- By technology, wind energy led with 82.60% of the European offshore energy market share in 2025; its 21.34% CAGR keeps it the fastest-growing technology through 2031.
- By water depth, deep-water sites (Above 60 m) held 66.20% revenue share in 2025, while transitional 30 to 60 m zones are projected to expand at a 31.62% CAGR to 2031.
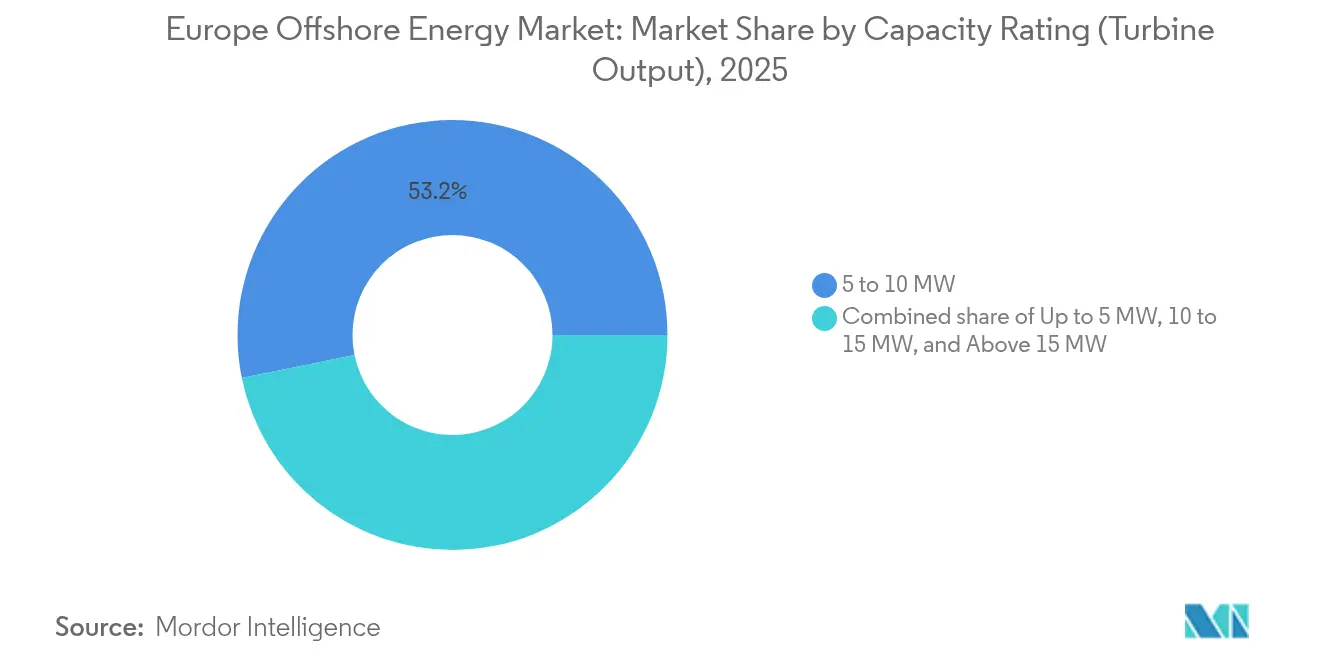
- By capacity rating, 5 to 10 MW turbines accounted for 53.20% of the European offshore energy market size in 2025; Above 15 MW units post the highest growth at 28.65% CAGR.
- By geography, the United Kingdom captured 44.30% of the European offshore energy market share in 2025, whereas Spain shows the fastest 23.08% CAGR through 2031.
Note: Market size and forecast figures in this report are generated using Mordor Intelligence’s proprietary estimation framework, updated with the latest available data and insights as of 2026.
Market Trends and Insights
Drivers Impact Analysis of Europe Offshore Energy Market*
| Driver | (~) Impact on CAGR Forecast | Geographic Relevance | Impact Timeline |
|---|---|---|---|
| EU Green Deal-Driven Capacity Targets & National Offshore Auctions | +5.20% | Global, with primary focus on North Sea countries | Medium term (2-4 years) |
| Rapid Cost Declines in >15 MW Turbines Enabling Deep-Water Projects | +4.80% | North Sea, Atlantic, Mediterranean regions | Long term (≥ 4 years) |
| Green Hydrogen (Power-to-X) Demand for Offshore Wind Integration | +3.10% | Germany, Netherlands, Denmark, Sweden | Medium term (2-4 years) |
| Commercialisation of Floating Wind Unlocking Atlantic & Med Sites | +2.90% | Spain, France, Portugal, Italy | Long term (≥ 4 years) |
| Offshore Grid Interconnection & OFTO/HVDC Tender Pipeline | +2.70% | North Sea countries, Baltic region | Medium term (2-4 years) |
| Oil & Gas Platform Electrification & Decarbonisation Mandates | +2.10% | North Sea, primarily UK, Netherlands, Norway | Short term (≤ 2 years) |
| Source: Mordor Intelligence | |||
EU Green Deal-Driven Capacity Targets & National Offshore Auctions
Binding Green Deal legislation has set an 86–89 GW offshore target for 2030 and 356–366 GW for 2050, triggering a pan-European cascade of national auction calendars that give developers long-range visibility into seabed leases, CfD strike prices, and grid connections. France plans 10 GW of tenders by 2035, while Denmark’s latest round could power the nation’s electricity demand. Hornsea 3 in UK waters secured a GBP 37.35/MWh inflation-indexed CfD, demonstrating how policy certainty compresses financing costs and lowers bid pricing. Coupled with the REPowerEU “Accele-RES” digital permitting platform and the European Wind Charter signed by 26 countries, administrative bottlenecks are easing, evidenced by more than 20 competitive auctions across Europe in 2024 that collectively allocated over 55 GW of capacity.(1)
Rapid Cost Declines in Above 15 MW Turbines Enabling Deep-Water Projects
Commercial orders for 15 MW platforms, such as Vestas’ nod for Germany’s Nordlicht 1, illustrate that turbine scaling has crossed from prototype to bankable product class. These machines push capacity factors toward 70% in steady North Sea wind regimes and reduce foundation counts by up to 40% compared with 8 MW layouts, cutting installed cost per megawatt even after factoring recent steel volatility. Forward pipelines already feature 20 MW prototypes from European and Asian OEMs, indicating an entrenched trend. The remaining friction point lies with installation logistics: only a handful of jack-ups can manage nacelles weighing more than 1,200 tons, so shipbuilders must accelerate newbuild cycles over the next three years to prevent execution lags.
Green Hydrogen (Power-to-X) Demand for Offshore Wind Integration
Germany’s permitting of a 100 MW electrolyzer linked to RWE offshore capacity and Sweden’s Neptunus hub proposal reaffirm that green hydrogen is moving from concept to contract. The EU seeks 20 million tons of renewable hydrogen by 2030; offshore generation offers superior capacity factors and circumvents onshore grid congestion, with modular 500 MW “factory-in-a-box” concepts now standard in North Sea project feasibility studies. Offshore-to-hydrogen also aligns with industrial clusters requiring shipping-grade ammonia and green steel feedstock, opening a demand corridor that back-stops long-term power-purchase agreements for gigawatt-scale arrays.
Commercialisation of Floating Wind Unlocking Atlantic & Med Sites
Floating foundations open an estimated 4,000 GW of European offshore potential. Spain’s maritime plan reserves 19 zones for up to 3 GW by 2030; France awarded Europe’s first commercial-scale floating tender in the Mediterranean in 2024, and Ocean Winds’ 250 MW project signals private-sector conviction(2). With levelized energy costs in Spain’s Canary Islands at 100–135 EUR/MWh, floating is already cost-competitive in high-resource sites that fixed monopiles cannot reach. Platform standardisation, industrialised hull fabrication, and hybrid mooring systems are expected to trim costs by another 30% by 2035, bringing floating on par with shallow-water monopiles even before carbon pricing adjustments.
Restraints Impact Analysis of Europe Offshore Energy Market*
| Restraint | (~) Impact on CAGR Forecast | Geographic Relevance | Impact Timeline |
|---|---|---|---|
| Limited Heavy-Lift Vessel Availability for Next-Gen Turbines | -3.70% | Global, with acute impact on North Sea and emerging markets | Short term (≤ 2 years) |
| Supply-Chain Inflation in Steel & Rare-Earth Components | -2.40% | Europe-wide, with particular impact on manufacturing hubs | Medium term (2-4 years) |
| Lengthy Permitting & Coastal Visual-Impact Opposition | -2.10% | Coastal regions across Europe, particularly Germany and UK | Medium term (2-4 years) |
| Offshore Grid Congestion & Limited On-shore Landing Points | -1.80% | North Sea countries, Baltic region | Short term (≤ 2 years) |
| Source: Mordor Intelligence | |||
Limited Heavy-Lift Vessel Availability for Next-Gen Turbines
Only 15–20 heavy-lift units worldwide can erect above 15 MW turbines, and day rates jumped 75% between 2022 and 2024, echoing the tight LNG carrier market a decade ago. Developers with legacy charters—Ørsted, RWE, Vattenfall—have locked in multiyear slots, leaving newer entrants to scramble or delay. Financing a newbuild costs USD 400 million and can take three years; cumulative capex of USD 14.8 billion is needed to bridge the fleet gap. Until then, schedule slips risk eroding auction bid economics, especially in emerging markets like Spain, where floating pilots hinge on vessel availability.
Supply-Chain Inflation in Steel & Rare-Earth Components
Escalating costs for critical offshore wind components, particularly steel foundations and rare-earth permanent magnets, have driven project investment costs to USD 3,523/kW in early 2024 while threatening the economic viability of projects awarded under previous auction price assumptions. Steel price volatility significantly affects monopile foundations, with specialized heavy plate steel for offshore applications commanding premium pricing due to quality requirements and a limited supplier base. Ørsted's memorandum of understanding with Dillinger for lower-emission steel demonstrates industry efforts to secure supply while meeting decarbonization criteria, though the transition to green steel production methods initially increases costs by 55-60% compared to conventional processes. Rare-earth elements essential for permanent magnet generators face supply concentration risks, with China controlling 80% of global processing capacity and export restrictions potentially disrupting European turbine manufacturing. The Netherlands' projected failure to meet offshore wind targets stems partly from supply chain constraints, while Germany's North Sea output declined 9% in 2023 due to grid infrastructure limitations exacerbating component delivery delays. Industry responses include vertical integration strategies, regional supplier development programs, and alternative material research, yet near-term cost pressures persist as demand growth outpaces supply chain expansion capabilities.
*Our forecasts treat driver/restraint impacts as directional, not additive. The impact forecasts reflect baseline growth, mix effects, and variable interactions.
Europe Offshore Energy Market Segment Analysis
By Technology:
Wind Energy Dominates Renewable TransitionWind energy accounted for 82.60% of the European offshore energy market size in 2025 and is pacing a 21.34% CAGR through 2031, far outstripping tidal and wave pilots that remain pre-commercial. Despite recent input inflation, its installed base benefits from two decades of learning curves, bankable performance histories, and fully amortised supply chains that drive down per-unit costs. The wider policy ecosystem anchors its lead: North Sea states align seabed grants with dedicated grid build-outs, while developers secure CfDs at sub-40 EUR/MWh prices that keep merchant exposure low. Though technically promising in Atlantic gateways, tidal and wave technology still confront higher levelized costs and limited OEM competition; demonstration units such as Magallanes Renovables’ floating tidal platform post 45% capacity factors but lack the multi-sourcing that de-risks procurement. Ocean Thermal Energy Conversion projects remain confined to warmer equatorial waters, leaving European waters outside their economically viable envelope. Consequently, the European offshore energy market continues to channel the vast majority of capital toward wind build-outs, cementing its prominence through 2031.
The spread of technology also reveals an accelerating pivot to floating sub-segments within wind. Spain, France, and Portugal are aligning industrial roadmaps with floating prototypes that marry serial hull fabrication techniques to modular topside assemblies, aiming at sub-100 EUR/MWh price points by mid-decade. These cost curves rely on standardised anchor systems and lightweight composite blades that mitigate port draft constraints. Wave and tidal advocates nonetheless draw policy attention for grid-balancing attributes: multiple governments now include technology-neutral innovation pots in auction designs, offering floor revenues that could lift niche renewables to 5% market share after 2030. Until then, wind remains the default investment choice, supported by mature O&M contracting structures and insurance products that protect lenders from weather-related downtime.

By Water Depth:
Transitional Zone Drives Fastest ExpansionInstallations anchored in more than 60 m of water captured 66.20% of the European offshore energy market 2025 as multi-GW projects such as Dogger Bank leveraged rich wind seams far offshore. Yet the 30-60 m transitional band is projected to log a 31.62% CAGR to 2031, acting as the sweet spot where fixed-bottom economics intersect with improved wind yield. Developers exploit this window to deploy new 15 MW turbines while avoiding the cost and technical leap required for floating foundations. Transitional-depth projects also benefit from existing vessel capability: conventional jack-ups can still install foundations without the keel clearance challenges faced in deep water. Moreover, grid interconnection distances remain manageable, containing cable expenditure and reducing transmission losses.
Policy designs amplify this trend. Several North Sea lease rounds explicitly segment sites at 40-55 m depths to synchronise auctioned acreage with current vessel capacity and OEM supply limits, creating a pipeline that eases the industry’s learning curve toward deeper water. Shallow sites under 30 m, once the prime real estate for early offshore wind, now face pushback from coastal stakeholders who cite visual intrusion and tourism impacts. As those areas approach saturation, repowering becomes their main growth lever, using taller towers on existing monopiles. Deep-water prospects beyond 60 m will regain momentum once floating substructures reach industrial maturity, but until then, the transitional band remains the European offshore energy market’s volume star.
By Capacity Rating:
Turbine Scaling Accelerates Market EvolutionTurbines rated 5-10 MW represented 53.20% of the European offshore energy market in 2025, reflecting their proven deployment economics and compatibility with today’s jack-up fleets. However, machines exceeding 15 MW are projected to grow at a 28.65% CAGR through 2031. A 15 MW turbine can displace two 8 MW units, trimming array cable length, foundations, and O&M visits; levelized cost reductions of 25-30% are already documented in comparative project models. Direct-drive architectures also eliminate gearbox maintenance, extending design life toward 30 years.
OEM competition feeds this leap. Vestas, Siemens Gamesa, and GE Vernova each have 15-17 MW prototypes moving through type certification, while Chinese entrants accelerate to 18-20 MW to win export share. Yet supersized hardware drives secondary challenges: rotor diameters exceeding 250 m demand blades longer than football pitches, necessitating new logistic corridors and factory footprints. Port upgrades across the North Sea and Baltic form an invisible but essential part of the capacity-rating shift, and public-sector grants have begun underwriting quayside reinforcements to preserve regional manufacturing competitiveness.
Despite the hype, the 10-15 MW class offers a comfort zone for financiers wary of unproven mechanical loads in above 15 MW machines. Developers hedging technology risk often pair a tranche of mid-range turbines with a smaller batch of flagships, sweetening lenders’ risk appetites while capturing some scale efficiencies. Over time, experience curves will normalise above 15 MW reliability metrics, after which that rating band is expected to become the European offshore energy market’s default specification.
Geography Analysis
Europe Offshore Energy Market
The United Kingdom remained the epicentre of the European offshore energy market in 2025, holding 44.30% market share on the back of 11 GW operational capacity and a 100 GW pipeline that spans fixed and floating archetypes. Projects such as the 2.9 GW Hornsea 3 and the multistage Dogger Bank complex demonstrate how phased development strategies smooth supply-chain peaks and sustain local manufacturing jobs. Germany, the Netherlands, and Denmark collectively add another 35.40% through coordinated North Sea Energy Cooperation targets, though grid congestion shaved 9% off German output in 2023, highlighting the parallel need for offshore backbone upgrades. Norway leverages its oil-and-gas pedigree for floating ventures like Equinor’s Hywind Tampen, the world’s largest floating array feeding petroleum platforms directly, offering a template for decarbonising hard-to-abate sectors.
Southern Europe provides the breakout narrative. Spain posts the fastest 23.08% CAGR through 2031 as Maritime Spatial Planning earmarks 19 floating zones, and the first competitive auction slated for 2025 paves the regulatory road. Atlantic wind speeds, deep-water shelf edges, and fewer fishing-ground conflicts give Spain’s floating pipeline cost advantages over crowded North Sea shallows. France likewise accelerates, with 10 GW of tenders locked into a multi-annual schedule that has already awarded both fixed-bottom and floating concessions in the Mediterranean. Italy and Portugal follow, using hybrid solar-wind zones to de-risk port upgrades and stimulate local steel fabrication clusters.
Baltic and Adriatic Offshore Energy Market
The Baltic Sea is transforming from fringe theatre to a growth pole. Poland, Sweden, and Finland push combined gigawatt-scale projects such as Ørsted-PGE’s 1.5 GW Baltica 2 and Vattenfall’s 2.5 GW Korsnäs concept, driven by net-zero mandates and energy-security priorities in the wake of geopolitical tensions. Further east, emerging Adriatic markets like Croatia tender their first blocks, offering early entrants preferential grid quotas and streamlined licensing. This geographical diversification underpins the wider European offshore energy market by spreading weather risk, reducing single-basin dependency, and fostering competition among ports and yard facilities.
Regulatory Landscape
Europe’s offshore energy build-out is increasingly shaped by tighter environmental and cross-border grid rules alongside industrial policy. In the United Kingdom, the Conservation of Habitats and Species (Offshore Wind) (Amendment etc.) Regulations 2026 came into force on 21 May 2026, setting out a clearer duty around compensatory measures for offshore wind projects where environmental impacts cannot be fully avoided. At the EU level, offshore transmission planning is being formalized through ENTSO-E, which is mandated to prepare sea-basin offshore network development plans as part of the Union-wide Ten-Year Network Development Plan (TYNDP) 2026, supporting coordinated offshore grid corridors and connection sequencing.
Industrial and tender-design guidance is also shifting toward non-price criteria and coordinated pipelines. The Hamburg Declaration of Energy Ministers (2026) highlights implementation of the Net-Zero Industry Act (NZIA) using non-price criteria, including minimum requirements and verification approaches that can influence auction scoring, local supply-chain qualification, and sustainability requirements in offshore wind procurement. In parallel, EU Member States and the European Commission have been updating guidance on collaborative investment frameworks and cost-sharing for integrated offshore grid corridors under the TEN-E framework, reinforcing a move away from single-country radial connections toward more integrated offshore grid development.
Competitive Landscape
Market structure skews toward a tiered hierarchy. Ørsted, RWE, Equinor, and Vattenfall anchor the top tier with vertically integrated portfolios exceeding 40 GW at operational, construction, or consented stages, giving them procurement muscle and vessel access advantages. Their strategies increasingly hinge on supply-chain integration: Ørsted’s steel offtake pact with Dillinger secures low-carbon heavy plate, while RWE’s joint venture with Norges Bank Investment Management unlocks patient capital aligned with sovereign decarbonisation goals(5). Equinor extends hydrocarbon know-how into floating wind moorings, and Vattenfall uses integrated onshore-to-offshore PPA offerings to bundle power with green-hydrogen contracts.
Mid-tier players—TotalEnergies, Shell, Iberdrola, SSE Renewables, and Statkraft—leverage balance-sheet heft but balance renewables against legacy businesses. They often partner with infrastructure funds or pension capital seeking long-dated cash flows; for example, Ørsted carved out a 12.45% slice of four UK wind farms to Brookfield for GBP 1.745 billion in 2024, recycling capital into new growth. Floating specialists such as Ocean Winds and Principle Power carve niches with proprietary platforms they license into developer consortia, while regional independents like Parkwind ride public-private alliances to secure local content advantages.
Competitive intensity rises in vessel procurement, blade manufacturing, and HVDC export systems. Aker Solutions and Siemens Energy secured full notice to proceed on the 2.8 GW Norfolk Vanguard build-out in early 2025, underscoring EPC contractors’ role in derisking mega-projects. Meanwhile, the merger between Saipem and Subsea7 into “Saipem7” adds a EUR 43 billion backlog to the installation arena, potentially lowering per-day vessel rates through fleet pooling economies. Overall, the European offshore energy market rewards scale, technology partnerships, and early spatial-planning engagement, while entrants lacking vessel slots or turbine supply agreements face steep barriers.
Europe Offshore Energy Industry Leaders
-
Siemens Gamesa Renewable Energy SA
-
Vestas Wind Systems AS
-
Hydroquest
-
Ørsted AS
-
E.ON SE.
- *Disclaimer: Major Players sorted in no particular order
Europe Offshore Energy Market Companies Covered in this Report
- Siemens Gamesa Renewable Energy SA
- Vestas Wind Systems AS
- GE Vernova (GE Renewable Energy)
- Nordex SE
- HydroQuest
- MHI Vestas Offshore Wind
- Hitachi Energy
- Orsted AS
- SSE Renewables
- Equinor ASA
- Iberdrola SA
- RWE Renewables GmbH
- EDF Renewables
- E.ON SE
- Copenhagen Infrastructure Partners
- Ocean Winds (EDP x Engie)
- TotalEnergies Renewables
- Shell New Energies
- Statkraft AS
- Northland Power Inc.
Market Opportunities and Future Outlook
A major whitespace sits in coordinated supply-chain and port capacity that can match the scale and timing of North Sea tender pipelines. The North Sea Summit 2026 introduced a Joint Offshore Wind Investment Pact for the North Seas, aimed at coordinating government support, supply-chain expansion, and workforce development across participating nations. The same cooperation framework also references maintaining a stable tender pipeline between 2031 and 2040 and further use of the NSEC tender tool to align national tender timelines and construction schedules, creating a clearer operating window for ports, heavy-lift logistics, and serial manufacturing investments tied to offshore project calendars.
Opportunities also concentrate in offshore grid infrastructure, where planning mandates and corridor cost-sharing are being operationalized. ENTSO-E’s requirement to develop sea-basin offshore network development plans within TYNDP 2026, alongside TEN-E-aligned work on collaborative investment and cost allocation for integrated offshore grid corridors, expands the addressable scope for HVDC export systems, offshore substations, and multi-terminal interconnection packages. On the OEM side, continued ordering of 15 MW-class platforms in European projects provides demand visibility for European blade, nacelle, and foundation capacity, with recent turbine supply agreements and project construction milestones reinforcing the shift toward fewer, higher-rated machines that concentrate value in specialized manufacturing, installation, and O&M capabilities.
Recent Industry Developments in Europe Offshore Energy Market
- June 2026: Siemens Gamesa Renewable Energy SA completed installation of 100 SG 14-222 DD wind turbines at RWE’s Sofia offshore wind farm in UK waters. The milestone demonstrates large-capacity turbine deployment in Europe and supports scale-up and faster project execution for UK North Sea offshore wind portfolios.
- February 2026: RWE and Vestas agree turbine supply agreement for Vanguard West offshore wind farm. The arrangement strengthens long-term turbine supply chain commitments for large-scale UK offshore wind capacity.
- February 2026: Vestas Wind Systems A/S secures firm order for 1,380 MW Norfolk Vanguard West offshore wind project in the UK, including 92 V236-15.0 MW turbines. The deal reinforces Vestas’ role in enabling multi-gigawatt UK offshore wind development and supports project economics and scale.
Europe Offshore Energy Market Report Scope and Research Methodology
Market Definition and Coverage
For this study, the Europe offshore energy market is defined as the installed and pipeline capacity added for offshore power generation projects in European waters, measured in gigawatts, and tracked across key technologies and project types.
Scope exclusions: It excludes onshore power assets, upstream oil and gas offshore activity, and revenue-only measures like power prices or EPC contract values.
Segments Covered in This Report
- By Technology
- Wind Energy
- Tidal and Wave Energy
- Ocean Thermal Energy Conversion (OTEC)
- Other Technologies
- By Water Depth
- 0 to 30 m (Shallow)
- 30 to 60 m (Transitional)
- Above 60 m (Deep-water)
- By Installation Type (Qualitative analysis only)
- Fixed Foundation (includes Monopile, Jacket, Gravity-based)
- Floating Platform (Semi-submersible, Spar-Buoy, Tension-Leg Platform)
- By Component (Qualitative analysis only)
- Turbine
- Substructure and Foundation
- Electrical Infrastructure
- Sub-sea Cables
- Mooring and Anchoring Systems
- Control and Monitoring
- By Capacity Rating (Turbine Output)
- Up to 5 MW
- 5 to 10 MW
- 10 to 15 MW
- Above 15 MW
- By Geography
- United Kingdom
- Germany
- Netherlands
- Denmark
- Norway
- France
- Belgium
- Sweden
- Ireland
- Rest of Europe
Data Sources, Market Sizing, and Validation
Desk Research
Desk research was used to set the project universe and to build a consistent view of policy targets, auction activity, and country-level offshore buildout. We relied on public sources such as the European Commission (including REPowerEU and offshore renewable strategies), Eurostat energy statistics, and national transmission system operator grid plans where available.
To keep the model grounded in real deployment progress, we also reviewed updates from bodies such as WindEurope, IEA datasets and commentary, and marine energy references from EU maritime publications. Company annual reports, investor presentations, and press releases were used to validate project timelines and commissioning notes. Where needed, we supplemented gaps with paid subscriptions focused on company financials and intelligence, patent databases, and shipment-level import and export records for selected components. The desk sources listed here are illustrative and not exhaustive, and many other public materials were also consulted for collection, cross-checks, and clarification.
Primary Interviews and Surveys
Primary work focused on validating the capacity pipeline and the probability of on-time delivery across major European offshore markets, since permitting, grid connections, and auction outcomes can shift quickly. We spoke with a mix of developers, component supply chain participants, service providers, and infrastructure stakeholders, and their feedback was used to fine-tune commissioning windows and technology adoption assumptions across Europe.
Distribution of primary research fieldwork respondents
| Company type | Respondent position |
|---|---|
| Top tier: 33% | CXOs: 19% |
| Mid tier: 46% | Functional/Unit leaders: 22% |
| Smaller Players: 21% | Managers: 59% |
Market-Sizing & Forecasting
Sizing was built using a top-down approach where announced national targets, auction award volumes, and grid connection plans were converted into an annual installable capacity path for each key country, then rolled up to the regional total. To avoid keeping the output only policy-led, we also ran selective bottom-up checks, including sampling project pipelines by country, checking typical turbine nameplate trends, and reconciling supplier delivery capacity signals where they were publicly visible.
Key inputs for this market include awarded offshore lease and auction volumes, expected commissioning-year slippage, grid and port readiness cues, typical project scale by water-depth band, and the mix shift across offshore wind and emerging marine technologies. Where data was incomplete for smaller geographies, gaps were handled by applying peer-country ratios based on coastline access, historical offshore build rate, and confirmed project announcements.
For forecasting, scenario analysis was used, and the base case was anchored to the most repeatable drivers, which are auction cadence and grid availability, then adjusted through expert feedback on bottlenecks and likely re-tendering patterns. We kept assumptions at a level that can be reviewed annually without depending on hard-to-get commercial data.
Data Validation & Update Cycle
Outputs were checked against independent signals such as year-by-year offshore capacity additions reported in public statistics, country level project status trackers, and consistency with known auction schedules and grid delivery milestones. If a country showed a jump that did not align with permitting reality or supply chain readiness, the drivers were rechecked and assumptions were revised after follow-up validation.
Before sign-off, the model and narrative go through multiple analyst reviews, and unusual variances are flagged for deeper verification. Reports are refreshed annually, and interim updates are made when material events occur, including major auction rounds, policy reversals, or large project delays. Right before delivery, a final review pass is done so the numbers reflect the latest available developments.
Mordor Intelligence's Europe Offshore Energy Market Estimate Compared With Other Published Estimates
Published estimates for offshore energy in Europe often do not line up because they do not always measure the same scope, and even the unit choice can change the interpretation. Some sources report revenue, some report annual additions, and others report total installed base, which can make the results look far apart even when the underlying development trend is similar.
Key gap drivers also come from what is counted as offshore energy, since some estimates focus only on offshore wind and exclude tidal, wave, or other ocean technologies, while others cover only EU countries instead of wider Europe. Timing can also shift outcomes, because pipeline updates after an auction or a major grid delay can move multi-gigawatt volumes between years. Grid-connection status checks and auction award records are two pieces of evidence used to keep Mordor Intelligence's estimate linked to capacity that is realistically commissionable within the forecast window.
Benchmark comparison
| Source | Market Size | Gaps in Research Methodology |
|---|---|---|
| Mordor Intelligence | USD 0.05 T (2025) | |
| Industry Association A | USD 0.06 T (2025) | Uses a revenue-proxy conversion from capacity that assumes a higher average project value per GW and mainly reflects offshore wind, which can overstate totals when technology mix is broader. |
| Trade Journal B | USD 0.04 T (2026) | Tracks only near-term commissioned capacity and applies conservative slippage, which shifts awarded projects out of the counted year and reduces the stated market size. |
The spread in published values is mainly explained by unit conversion choices, country coverage, and how strictly pipeline maturity is screened before it is counted. By anchoring the model to traceable signals like awards, grid readiness, and commissioning probability, the final number stays practical for planning and can be updated in a repeatable way as new auctions and project milestones land.
Key Questions Answered in the Report
What is the projected size of the Europe offshore energy market by 2031?
The Europe offshore energy market size is forecast to reach 135.79 GW by 2031, expanding at a 20.16% CAGR during the forecast period (2026-2031).
Which country currently holds the largest share of installed offshore capacity in Europe?
The United Kingdom led with 44.30% of the Europe offshore energy market share in 2025, reflecting more than 11 GW in operation.
Why are above 15 MW turbines considered game-changers for offshore wind economics?
Larger turbines cut the number of foundations and electrical hookups per megawatt, pushing capacity factors toward 70% and lowering levelized costs by up to 30% versus 8 MW models.
How will floating wind technology influence future European installations?
Floating foundations unlock deep Atlantic and Mediterranean waters, adding an estimated 4,000 GW of potential and are expected to achieve cost parity with fixed-bottom solutions by 2035.
What are the main constraints facing near-term offshore build-out?
Limited heavy-lift vessels for next-generation turbines and inflation in steel and rare-earth materials are the two most immediate bottlenecks, together shaving roughly 6% off projected CAGR.