
Market Overview
| Study Period | 2020 - 2031 |
|---|---|
| Forecast Data Period | 2026 - 2031 |
| Base Year Market Size (2025) | USD 378.74 Billion |
| Market Size (2026) | USD 392.48 Billion |
| Market Size (2031) | USD 478.66 Billion |
| Growth Rate (2026 - 2031) | 4.05 % |
| Market Concentration | Low |
Major Players *Disclaimer: Major Players sorted in no particular order Image © Mordor Intelligence. Reuse requires attribution under CC BY 4.0. | |
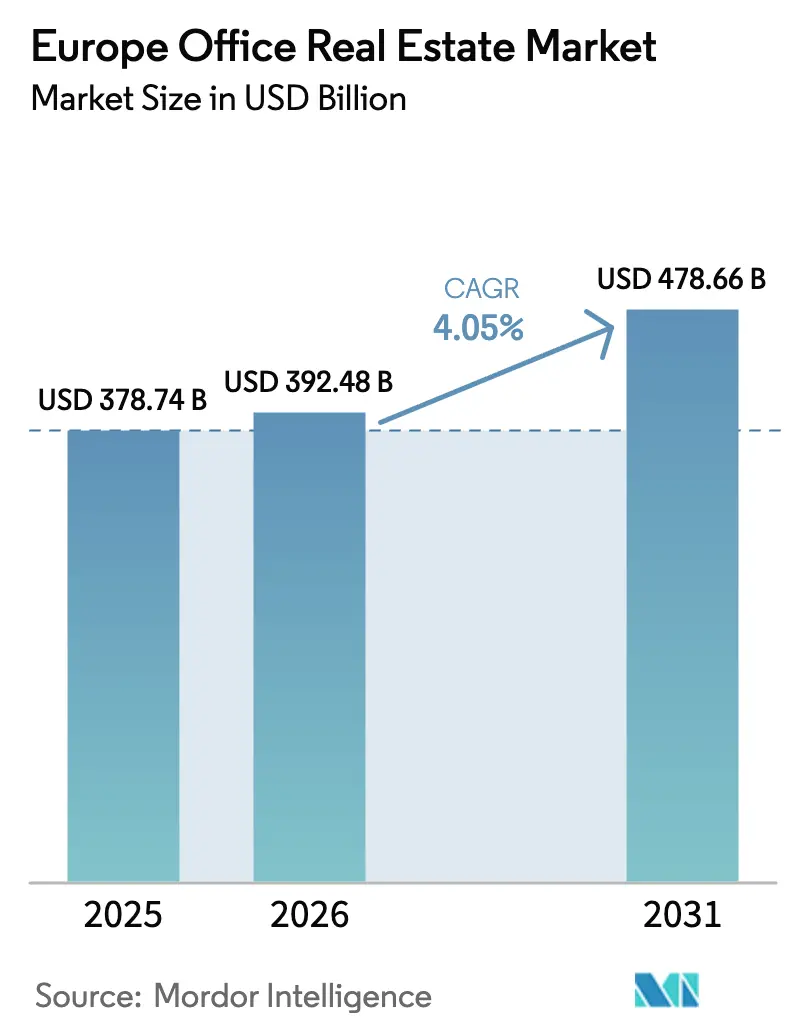
Europe Office Real Estate Market Analysis by Mordor Intelligence
The Europe Office Real Estate Market size is projected to be USD 378.74 billion in 2025, USD 392.48 billion in 2026, and reach USD 478.66 billion by 2031, growing at a CAGR of 4.05% from 2026 to 2031.
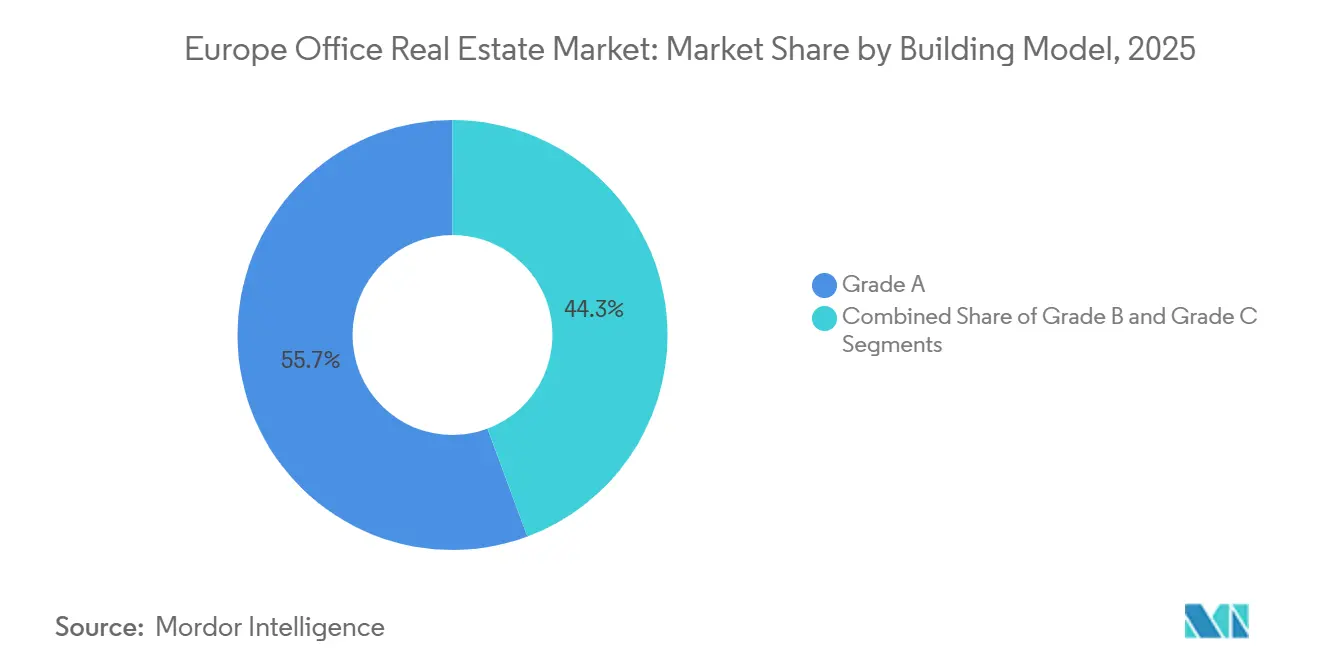
Landlords holding Grade A assets captured 55.68% of the 2025 transaction value, illustrating that investors are concentrating capital into certified, energy-efficient buildings despite continuing hybrid-work uncertainty. Rental transactions dominated with a 74.88% share of deal flow in 2025, yet sales are projected to outpace leasing by advancing 5.15% annually through 2031 as institutional funds seek long-duration cash flows that hedge inflation. Germany anchored 29.58% of activity in 2025, but the Rest of Europe, Central and Eastern hubs, Iberian cities, and Nordic capitals will deliver the fastest 5.52% CAGR as nearshoring and data-center projects redirect tenants toward lower-cost corridors. Headline risks include a persistent sublease overhang, embodied-carbon rules, and 15-minute-city zoning that collectively shrink conventional pipelines, while the EU Energy Performance of Buildings Directive (EPBD) accelerates obsolescence of non-compliant stock and raises prime rent expectations in certified towers.
Key Report Takeaways
- By building grade, Grade A properties held 55.68% of the European office real estate market share in 2025, while the same grade is advancing at a 4.99% CAGR through 2031.
- By transaction type, the rental segment accounted for 74.88% of the European office real estate market size in 2025, and sales are projected to grow at a 5.15% CAGR through 2031.
- By end user, IT & ITES tenants led with 32.08% of the European office real estate market share in 2025, whereas the same cohort is also the fastest-expanding at a 5.37% CAGR to 2031.
- By country, Germany captured 29.58% of the 2025 value, while the Rest of Europe is forecast to post the steepest 5.52% CAGR through 2031.
Note: Market size and forecast figures in this report are generated using Mordor Intelligence’s proprietary estimation framework, updated with the latest available data and insights as of January 2026.
Market Trends and Insights
Drivers Impact Analysis of Europe Office Real Estate Market*
| Drivers | (~) % Impact on CAGR Forecast | Geographic Relevance | Impact Timeline |
|---|---|---|---|
| Nearshoring by US and Asian tech giants | +0.9% | Germany, UK, Ireland, Netherlands | Medium term (2-4 years) |
| EU EPBD 2026 zero-emission mandate accelerating green upgrades | +0.8% | Germany, France, Netherlands, pan-EU | Short term (≤ 2 years) |
| AI-data-center ecosystem spillover | +0.7% | Frankfurt, London, Amsterdam, Paris, Dublin, Nordics | Medium term (2-4 years) |
| Corporate Science Based Targets net-zero pledges | +0.6% | UK, Germany, France | Medium term (2-4 years) |
| EU Recovery & Resilience Facility funds | +0.5% | Poland, Czech Republic, Romania | Long term (≥ 4 years) |
| Tradable digital building passports | +0.4% | Denmark, Estonia, Netherlands, pilot EU-wide | Long term (≥ 4 years) |
| Source: Mordor Intelligence | |||
Nearshoring Expansion of US and Asian Tech Giants into Tier-1 European Cities Raising Large-Floorplate Absorption
Microsoft, Google, ByteDance, and Tencent expanded their hubs in Germany, Ireland, and the Netherlands during 2025, each signing contiguous blocks exceeding 5,000 m² to co-locate engineering and cloud operations teams. Frankfurt’s Q1 2025 take-up hit 194,600 m², the strongest quarterly absorption since 2019, and lifted prime rents to USD 52 per m² per month. High-spec, edge-compute-adjacent floorplates are leasing before completion, pulling forward revenue recognition for developers but capping upside if market rents accelerate faster than fixed escalators. Secondary cities lacking fiber connectivity or international airports have failed to capture comparable volumes, widening geographic divergence across the region.
EU EPBD 2026 Zero-Emission Mandate Accelerating Pre-Emptive Green Upgrades
The Energy Performance of Buildings Directive requires all new non-residential construction after 2026 to emit zero on-site fossil-fuel emissions and imposes phased retrofits for existing assets by 2030. Landlords in Germany and the Netherlands have front-loaded heat-pump, façade-insulation, and rooftop-solar programs, compressing cap rates on certified assets by as much as 75 basis points compared with non-compliant peers [1]. Retrofit costs averaging USD 165–275 per m² are squeezing small owners but rewarding early movers with 10%-plus rental premiums. Municipal enforcement is already separating a two-tier market in which EPC A stock enjoys valuation resilience while C-rated buildings confront stranded-asset risk. As a result, capital is flowing toward refurbishment pipelines rather than speculative ground-up towers, tightening Grade A supply in core districts.
Corporate Science Based Targets Net-Zero Commitments Fueling Demand for Energy-Positive Flagship Offices
More than 1,000 European corporations have filed Science-Based Targets pledges that embed Scope 1–3 carbon cuts into real-estate briefs, pushing tenants to insist on LEED Platinum, BREEAM Outstanding, or DGNB Gold space [2]. Prime CBD rents in certified buildings rose 4% in 2025, even as headline vacancy drifted higher, highlighting a widening quality gap. Finance and professional-services firms have consolidated into fewer headquarters yet upgraded specifications, lifting average deal size beyond 10,000 m². The preference for energy-positive assets also redirects relocation searches to transit-rich nodes able to support micro-mobility plans, reshaping occupier maps inside London, Frankfurt, and Paris.
EU Recovery & Resilience Facility Green-Retrofit Funds Unlocking CapEx for Aging Stock in CEE Markets
The EU Recovery & Resilience Facility earmarked USD 796.18 billion equivalent, with at least 37% for climate projects, allowing Polish, Czech, and Romanian landlords to fund heat-pump conversions and LED retrofits at subsidized rates[3]. Stabilized yields of 7%-8% in CEE gateways compare favorably to 4%-5% in core Western markets, prompting German and U.S. pension funds to allocate fresh capital to Warsaw, Prague, and Bucharest. Execution risk remains from permit delays and labor shortages, yet early disbursements have already narrowed energy-performance gaps and compressed cap-rate spreads.
Restraints Impact Analysis of Europe Office Real Estate Market*
| Restraints | (~) % Impact on CAGR Forecast | Geographic Relevance | Impact Timeline |
|---|---|---|---|
| Sustained high ECB interest rates tightening credit spreads | -0.9% | Southern Europe, CEE, pan-EU | Short term (≤ 2 years) |
| Corporate sublease wave at ≤ 30% desk utilization | -0.7% | UK, Germany, France, Netherlands | Short term (≤ 2 years) |
| 15-minute-city zoning caps curbing CBD supply | -0.4% | Paris, Barcelona, Milan, Brussels | Medium term (2-4 years) |
| Embodied-carbon caps limiting steel-and-glass redevelopments | -0.3% | UK, Netherlands, France, Denmark | Long term (≥ 4 years) |
| Source: Mordor Intelligence | |||
Sustained High ECB Interest Rates and Tighter Credit Spreads Suppressing Development Pipelines
The European Central Bank kept its deposit rate at 2.75% in January 2025, pushing total borrowing costs for speculative office projects above 6%. Developers now require stabilized yields of 7%-8% to break even, a hurdle only fully pre-leased Grade A towers can clear. Frankfurt, Munich, and Amsterdam each saw permitting volumes fall 40%-50% versus 2022 peaks, severely restricting post-2027 deliveries. Refinancing risk for loans originated in 2020-21 is triggering opportunistic asset sales at double-digit discounts, yet bid-ask gaps remain wide, freezing many transactions.
Sublease Wave from Corporates Hitting ≤ 30% Utilization, Pressuring Prime Rents
Hybrid-work utilization below 30% has unleashed sublease space equal to 15%-20% of available stock in London, Frankfurt, and Paris. Discounted sublets undermine landlord pricing power and extend lease-up times for new schemes. Canary Wharf and La Défense each carry more than 200,000 m² of surplus, prompting concessions worth USD 550-880 per m² in tenant allowances plus up to 18 months rent-free. Appraisers have widened Grade A cap rates 50-100 bps for buildings facing high sublease exposure, reflecting uncertainty about future cash flows.
*Our forecasts treat driver/restraint impacts as directional, not additive. The impact forecasts reflect baseline growth, mix effects, and variable interactions.
Europe Office Real Estate Market Segment Analysis
By Building Grade:
Quality Polarization Rewrites Tenant PreferencesGrade A assets accounted for 55.68% of Europe office real estate market size in 2025 and are projected to grow at a 4.99% CAGR through 2031. Prime CBD rents for Grade A exceeded USD 57 per m² per month in Munich during 2025, 30% above comparable Grade B space, underscoring tenants’ readiness to pay premiums for wellness amenities, column-free floorplates and ESG credentials. The segment benefits from tight supply because financing for speculative projects is scarce, and embodied-carbon rules steer developers toward refurbishing older stock rather than building fresh towers. Grade B assets occupy roughly one-third of inventory and show a bifurcated outlook: centrally located offices within 500 m of transit nodes are attracting value-add investors who inject USD 110-165 per m² of retrofit capital to meet EPC B thresholds, whereas car-dependent suburban properties face conversion or demolition. Grade C buildings, often built prior to 1990, are exiting the market entirely as conversion rates to residential or life-science uses doubled to 12% of stock in 2024.
Flight-to-quality dynamics are visible in leasing spreads: Frankfurt Grade A rents at USD 52 per m² per month stand USD 17 higher than Grade B comparables and the differential has widened 600 bps since 2019. Occupiers cite employee-engagement goals and Scope 2 carbon targets as key drivers. The divergence is reinforcing investor appetite for refurb-to-core strategies, compressing yields on upgraded Grade B to within 100 bps of Grade A. With the EPBD deadline looming, lenders have begun to reserve preferential loan-to-value ratios for certified assets, tilting the balance further toward high-grade stock and accelerating the write-off of obsolete offices.

By Transaction Type:
Sales Outpace Rentals Despite Rental DominanceRental agreements captured 74.88% of the European office real estate market share in 2025, a reflection of occupiers' favoring three-to-five-year flexibility clauses amid uncertain headcount forecasts. However, the sales category is forecast to expand 5.15% annually through 2031, eclipsing rental growth as global pension and sovereign-wealth funds allocate capital into long-dated, income-producing stock. Cross-border inflows reached USD 8.8 billion in H1 2025, led by Asian sovereign investors securing German and Dutch assets at 4%-plus net yields. Distressed disposals by highly leveraged owners are widening the investable universe for opportunistic buyers that can underwrite capex. Meanwhile, corporate tenants increasingly request break clauses and green fit-out packages, elongating negotiation cycles and pressuring landlords to fund larger tenant incentives, all of which moderate rental-growth trajectories.
Build-to-suit transactions dominate the modest new construction that is breaking ground because lenders require pre-leases covering at least 60% of net rentable area before releasing funds. The trend channels capex away from speculative projects and into bespoke headquarters anchored by investment-grade tenants. Simultaneously, trophy-asset trades illustrate depth of demand: in November 2024, CBRE Global Investors acquired a LEED Platinum Frankfurt tower fully leased to Deutsche Bank for USD 418 million at a 4.2% yield, the tightest German office pricing post-pandemic. Such deals highlight that liquidity pivots toward core, stabilized products even while secondary assets languish.
By End User:
IT & ITES Lead as BFSI ConsolidatesInformation Technology and IT-enabled services users held the largest 32.08% share of the European office real estate market size in 2025 and are advancing at the fastest 5.37% CAGR. Hyperscalers, SaaS providers, and fintech firms are driving take-up above 25,000 m² per deal in Frankfurt, Dublin, and London to accommodate AI-model training and cloud-operations teams. More than 80% of tech leases executed in 2025 required LEED Gold or higher, setting a de facto sustainability baseline for premium buildings. Banking, Financial Services and Insurance (BFSI) occupiers, the second-largest cohort at roughly 26% of demand, are shrinking total footprints by 10%-15% yet upgrading to smaller numbers of flagship, client-facing floors, a swap that inflates average rent per employee while trimming net area. Professional-services partnerships, occupying close to 20% of space, mirror BFSI behavior by replacing private offices with collaboration zones, cutting per-capita density down to 8-10 m².
Life sciences companies, still a niche at under 5% share, signal a promising conversion path for obsolete offices. Landlords in Cambridge, Basel, and Copenhagen have repositioned pre-1990 buildings into wet lab shells that command double-digit rents. Such transactions underscore adaptive reuse as an emerging competitor to conventional leasing, eroding the low-spec office demand pool while opening a new valuation floor for otherwise stranded stock.

Geography Analysis
Germany Office Real Estate Market
Germany retained the largest 29.58% slice of the European office real estate market size in 2025 and is slated to expand at a 4.2% CAGR through 2031. Frankfurt’s Q1 2025 absorption of 194,600 m² was driven by U.S. cloud providers and Asian fintechs, lifting prime rents to USD 52 per m² monthly. Munich’s USD 59 per m² rate reflects automotive-tech and semiconductor demand alongside low vacancy. The country’s fast-tracked office-to-residential permits enabled 20% of obsolete stock to be converted in 2024, culling inefficient inventory, sustaining rent resilience even in a high-rate climate.
United Kingdom and France Office Real Estate Market
The United Kingdom and France together represented roughly 36% of regional value in 2025, yet differ in outlook. London’s Canary Wharf attracted Visa and JP Morgan commitments, but sublease surpluses lifted citywide vacancy to 9.5%, restraining net effective rent growth. Paris, conversely, imposed 15-minute-city zoning that caps CBD permits at 50,000 m² annually. The scarcity underpins 4% rent growth in the 8th arrondissement despite broader economic headwinds. Labour-law rigidity and slow permitting deter speculative projects in both locales, implicitly protecting incumbent landlords’ cash flows.
Italy and Spain Office Real Estate Market
Italy and Spain, jointly near 13% of the market value, posted vigorous leasing in 2025. Milan recorded 110,000 m² of Q1 take-up; Grade A alone captured 60% and commanded USD 69 per m² per month in prime rents, a national high. Madrid and Barcelona delivered USD 45 and USD 34 per m² monthly, respectively, paired with investment yields 200-300 bps wider than core German assets, attracting U.S. private-equity capital. Local governments accelerate adaptive-reuse permits, further tightening Grade A supply across both countries.
Broader European Markets
The rest of Europe delivered the fastest 5.52% CAGR projection to 2031 as CEE capitals and Nordic cities capture nearshoring and data-center spillover. Warsaw’s vacancy dipped to 11.2% in Q4 2024 thanks to IT outsourcing demand, while Stockholm and Copenhagen absorbed more than 50,000 m² each, tied to edge-compute facilities. EU Recovery & Resilience funds help finance deep retrofits, squeezing yield spreads versus Western peers and magnetizing institutional capital seeking diversification without sacrificing liquidity.
Regulatory Landscape
The regulatory center of gravity for European office markets is anchored in the recast Energy Performance of Buildings Directive, Directive (EU) 2024/1275, which sets a transposition deadline of 29 May 2026 for non-residential buildings to define minimum energy performance standards and renovation trajectories toward a zero-emission building stock by 2050.
The Construction Products Regulation, Regulation (EU) 2024/3110, and the CPR Working Plan for 2026-2029 drive more structured product compliance across key building-material categories, with early-2026 standardization activity for offsite construction and modular systems signaling increased documentation, sustainability declarations, and digital compliance entering office project procurement and specification choices.
Value Chain Analysis
The Europe office real estate value chain spans land assembly and planning, development financing, design and engineering, construction and fit-out, leasing and tenant improvements, and ongoing asset management and portfolio recapitalization.
Downstream, occupancy and leasing execution relies on brokers, property managers, and technical consultants that translate ESG and energy-performance requirements into lettable specifications, retrofitting scopes, and green-finance documentation. Cost and delivery risk concentrates in the contractor and fit-out layers as owners pursue refurbishment over new build under tight credit conditions, creating bottlenecks around specialist labor, MEP upgrades, and compliant materials, and raising the importance of integrated delivery partners that can bundle design-to-delivery with energy monitoring and certification workflows for Grade A repositioning.
Competitive Landscape
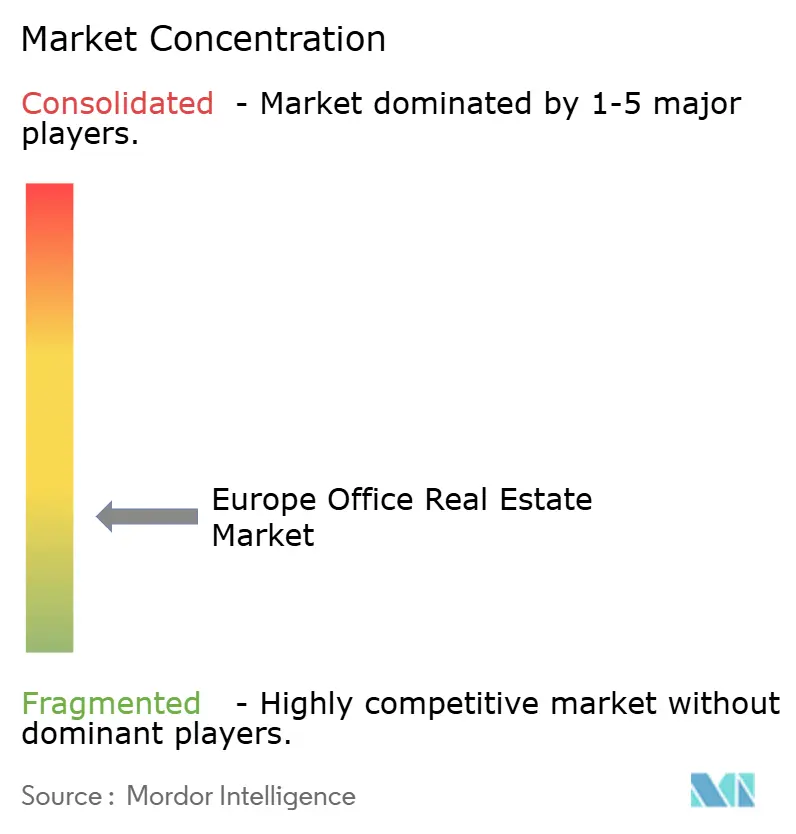
The Europe office real estate market remains fragmented; no single landlord exceeds mid-single-digit share, but scale players Aroundtown, Gecina, and Unibail-Rodamco-Westfield wield negotiating leverage in Paris, Berlin, and Amsterdam. They capitalize on balance-sheet depth to pre-fund retrofit campaigns and access USD-linked green loans such as Unibail-Rodamco-Westfield’s USD 1.32 billion facility priced 25 bps inside conventional debt. Service giants JLL, CBRE, and Cushman & Wakefield dominate occupier advisory, yet fee compression is prompting them to bundle PropTech and sustainability consulting to defend margins.
Competition is most intense in Grade A development, where land scarcity, carbon caps, and permitting delays create natural barriers to entry. Build-to-core institutional funds partner with turnkey contractors to mitigate cost inflation and deliver pre-leased towers. Adaptive reuse has emerged as a high-return niche: landlords converting obsolete offices to labs or housing routinely target 12%-15% unlevered IRRs double new-build office returns, drawing global opportunistic capital. At the same time, PropTech disruptors offer 30%-40% faster delivery via modular construction and integrate IoT analytics that reduce operating expenses by up to 20%.
Smart-building retrofits present another competitive axis. Only 30% of European offices deploy real-time energy monitoring, leaving a wide adoption gap that nimble owners exploit to command 5%-8% rent premiums. Technology is also compressing leasing cycles: AI-powered space-planning and virtual-tour platforms are shortening tenant decision windows from 18 months to about nine, allowing proactive landlords to secure occupancy ahead of slower rivals. As sublease supply weighs on rents, owners that pair ESG upgrades with flexible fit-outs gain a decisive edge in retaining blue-chip tenants.
Europe Office Real Estate Industry Leaders
-
Jones Lang LaSalle IP, Inc.
-
CBRE
-
Cushman & Wakefield
-
Savills
-
Colliers
- *Disclaimer: Major Players sorted in no particular order
Europe Office Real Estate Market Companies Covered in this Report
- Jones Lang LaSalle IP, Inc.
- CBRE
- Cushman & Wakefield
- Savills
- Colliers
- STRABAG SE
- HOCHTIEF
- AF Gruppen
- Aroundtown SA
- Gecina
- Skanska AB
- Bouygues Immobilier
- Hines
- Unibail-Rodamco-Westfield
- Vonovia SE
- SEGRO Plc
- Merlin Properties Socimi, S.A.
- Alstria Office AG
- BNP Paribas Real Estate
- PATRIZIA
Market Opportunities and Future Outlook
A primary opportunity set sits in refurbishment, repositioning, and financing solutions tied to EPBD compliance, as the transposition deadline of 29 May 2026 forces clearer national pathways for non-residential energy performance and retrofit obligations. This anchors demand for measurable energy upgrades (heat pumps, facade works, rooftop solar, controls), and for transaction structuring that prices capex and obsolescence risk transparently, widening the role of technical due diligence, ESG-linked lending, and asset-level monitoring in cross-border investment.
New supply remains selective, concentrating opportunity in projects that clear planning, deliver certified Grade A space, and secure credible pre-leasing in constrained submarkets. In 2026, Covivio unveiled its 030BLN project at Berlin Alexanderplatz; Skanska signed a contract with AshbyCapital to deliver the 55 Old Broad Street commercial office project for GBP 282 million with construction scheduled to start in October 2026, while Railpen secured planning permission for the 12 Smithfield redevelopment (122,000 sq ft) in London in July 2026.
Recent Industry Developments in Europe Office Real Estate Market
- July 2026: Railpen secured planning permission for the 12 Smithfield redevelopment (122,000 sq ft) in London, advancing a central London Grade A project and signaling regulatory momentum for high-spec refurbishments.
- June 2026: LaSalle Investment Management secured a EUR 450 million custom account mandate from a German pension fund to target core office investments across France, Germany, the Netherlands, and Spain. The mandate signals renewed institutional appetite for stabilized, prime offices in liquid European markets.
- May 2026: Covivio unveiled its 030BLN project at Berlin Alexanderplatz, underscoring continued capital flows to centrally located, high-spec schemes and reinforcing the market's refurbishment and upgrade trajectory.
Europe Office Real Estate Market Report Scope and Research Methodology
Market Definition and Coverage
For this study, the market is defined as the value of office real estate activity across Europe, measured through office building assets that are leased or sold, including both income-producing and owner-occupied offices.
Scope exclusions: We exclude coworking memberships and serviced-office fees, property-management revenues, land banks, student housing, and mixed-use properties where offices are under 50% of net lettable area.
Segments Covered in This Report
- By Building Grade
- Grade A
- Grade B
- Grade C
- By Transaction Type
- Rental
- Sales
- By End User
- Information Technology (IT & ITES)
- BFSI (Banking, Financial Services and Insurance)
- Business Consulting & Professional Services
- Other Services (Retail, Lifescience, Energy, Legal)
- By Country
- Germany
- UK
- France
- Italy
- Spain
- Rest of Europe
Data Sources, Market Sizing, and Validation
Desk Research
Desk work starts with building a clear picture of office stock, leasing activity, and investment conditions across European countries, then mapping which indicators can be refreshed consistently. We rely on public and official datasets such as Eurostat (construction and price indices), the European Central Bank (interest-rate and credit signals), national statistics offices for building permits and completions, and land registry or cadastre publications where accessible. We also review central bank releases and supervisory notes to understand changes in lending standards that can feed into office pricing relatively quickly.
We use company filings, audited financial statements, investor presentations, and reputable press to track transaction trends, valuation markdowns, and shifts in tenant demand. For harder-to-compile facts, like fragmented ownership structures and cross-border deal visibility, we use paid subscriptions for company financials and intelligence, plus news and financials, and then reconcile those to public market indicators. The desk sources mentioned here are illustrative, and we checked additional sources to support data collection, validation, and clarification.
Primary Interviews and Surveys
Primary work focused on validating how office assets are being priced and absorbed in different European hubs, especially when yields and vacancy are moving quickly. We spoke with a mix of property owners, developers, brokers, lenders, and large occupiers to confirm leasing terms, cap-rate movements, and the timing gap between signed deals and recorded transactions. Where public data lagged, we cross-checked inputs across countries and then reconciled them to a consistent currency and time window, so the final model stays comparable.
Distribution of primary research fieldwork respondents
| Company type | Respondent position |
|---|---|
| Top tier: 34% | CXOs: 13% |
| Mid tier: 45% | Functional/Unit leaders: 43% |
| Smaller Players: 21% | Managers: 44% |
Market-Sizing & Forecasting
Sizing was built using a top-down approach where Europe-level office asset value is reconstructed from country indicators such as office stock completion flow, transaction activity, vacancy and absorption, and observed yield and pricing benchmarks, then normalized to a single USD basis. After creating initial totals, we corroborated them with selective bottom-up approximations, including sampled deal values by key hubs, typical rent-to-value relationships, and sanity checks against listed owner disclosures, then adjusted for coverage gaps.
In practice, a few inputs drove most of the model: net absorption and take-up direction, vacancy and availability, prime and average rents, yield or cap-rate movement, and the pace of new completions entering service. Because interest rates and risk premia can change valuations quickly, scenario analysis was used for the forecast to reflect different paths for financing costs and leasing recovery, then narrowed to a base case based on what primary respondents considered most likely. When some countries had thin public disclosure, we filled gaps by applying hub-level pricing ranges to estimated stock and tested the result against transaction signals before finalizing.
Data Validation & Update Cycle
Outputs were checked in several passes so obvious mismatches were caught early and clarified before sign-off. We compared final totals against independent signals such as office investment volumes, reported yield ranges, and changes in leasing activity, then reviewed outliers at country and hub level to confirm they were not caused by timing or currency effects. If a variance looked material, we re-checked the source series, revisited assumptions, and re-contacted select respondents to confirm what had changed.
The report is refreshed annually, with interim updates when major market events shift rates, pricing, or transaction volumes enough to alter the near-term view. Before delivery, an analyst runs a final update pass so the published values reflect the latest available information and consistent cut-off dates.
Mordor Intelligence's Europe Office Real Estate Market Size Compared Against Other Published Estimates
Published values for Europe office real estate do not always align because the cut-off date, currency conversion timing, and what each source counts in the market can differ quietly. We kept the model tied to observable leasing and investment signals, and we separated office building asset value from adjacent service revenues so the figure stays traceable.
A common gap driver is refresh cadence, since office pricing can shift within a few quarters when yields move, and older conversion rates can distort USD values even if local pricing is unchanged. The table highlights this spread, and the market size here is aligned to current-year currency timing and rechecked against recent leasing and capital-markets signals, using a refresh-led discipline applied by Mordor Intelligence.
Benchmark comparison
| Source | Market Size | Gaps in Research Methodology |
|---|---|---|
| Mordor Intelligence | USD 378.74 B (2025) | |
| Industry Association A | USD 40.70 B (2024) | Uses annual office investment transaction volume for Europe as the market size, which reflects deal flow in one year rather than the broader office asset value base, and it is often reported in EUR with point-in-time conversions. |
| Global Consultancy B | USD 48.00 B (2024) | Reports office transaction volume across a wider EMEA lens and treats it as market size, which can differ from an office real estate asset-value view, and the year-end reporting cut-off can miss late-recorded deals. |
Taken together, the differences mostly come from whether a source measures annual transaction volume or the broader office real estate value pool, and from how currency timing and reporting lags are handled. By keeping scope boundaries clear and validating totals against leasing and pricing indicators, we deliver a market size that is easier to track forward and repeat with the same inputs.
Key Questions Answered in the Report
How large is the Europe office real estate market in 2026?
The Europe office real estate market size is USD 392.48 billion in 2026.
What is the forecast CAGR for European offices to 2031?
The market is projected to grow at a 4.05% CAGR between 2026 and 2031.
Which tenant group drives the fastest demand growth?
IT & ITES firms are expanding leasable footprints fastest at a 5.37% CAGR through 2031.
Why are Grade A rents rising despite higher vacancy in older stock?
Corporations chasing energy-positive, amenity-rich buildings will pay 25%-30% premiums, widening the grade spread.
How do EU carbon rules affect new office development?
Embodied-carbon caps and the 2026 zero-emission mandate push developers toward refurbishments and timber-hybrid designs, cutting speculative ground-up starts.
Which geography is expected to grow quickest through 2031?
Rest of Europe, including Central-Eastern and Nordic hubs, is expected to post the strongest 5.52% CAGR as nearshoring and data-center projects accelerate demand.