
Market Overview
| Study Period | 2020 - 2031 |
|---|---|
| Forecast Data Period | 2026 - 2031 |
| Base Year Market Size (2025) | USD 41.54 Trillion |
| Market Size (2026) | USD 43.01 Trillion |
| Market Size (2031) | USD 51.18 Trillion |
| Growth Rate (2026 - 2031) | 3.54 % |
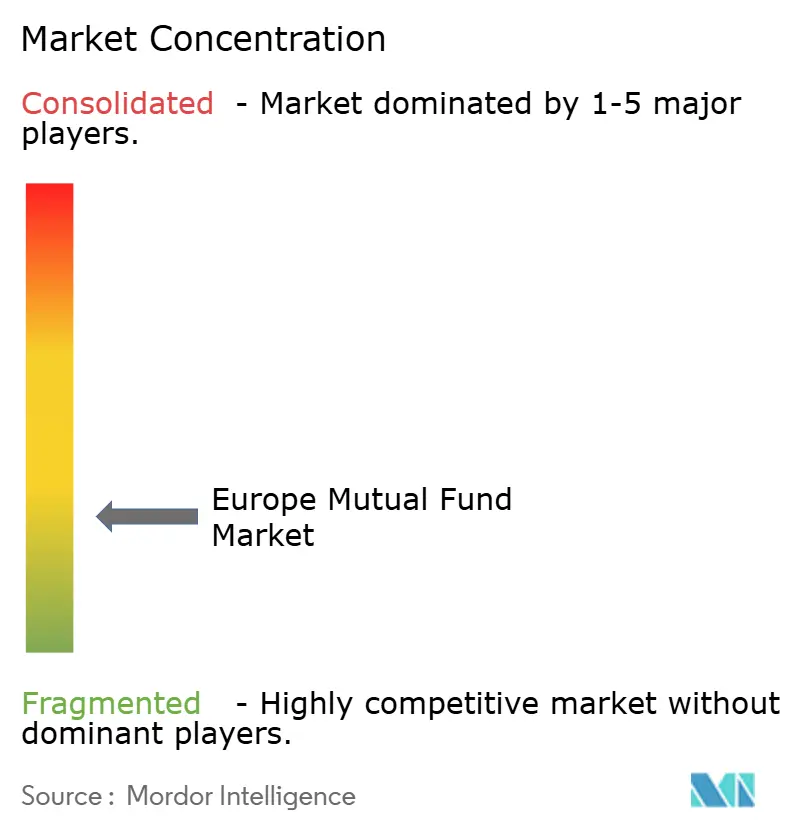
| Market Concentration | Low |
Major Players *Disclaimer: Major Players sorted in no particular order Image © Mordor Intelligence. Reuse requires attribution under CC BY 4.0. | |
Europe Mutual Fund Market Analysis by Mordor Intelligence
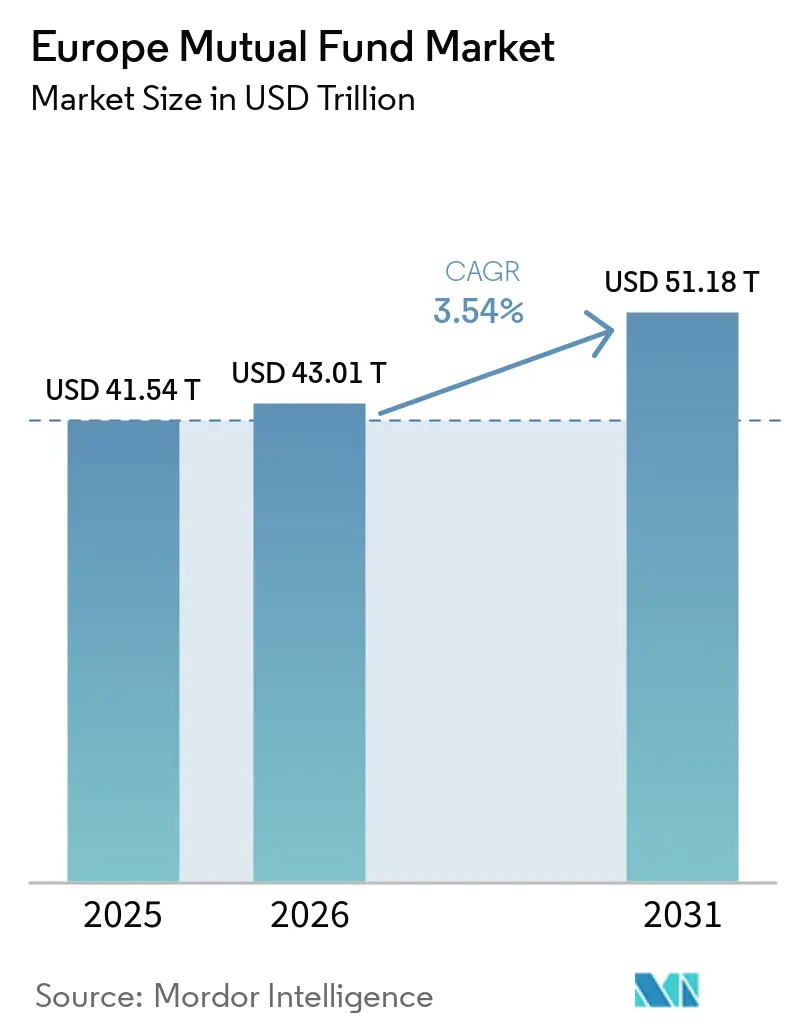
Europe Mutual Fund Market size in 2026 is estimated at USD 43.01 trillion, growing from 2025 value of USD 41.54 trillion with 2031 projections showing USD 51.18 trillion, growing at 3.54% CAGR over 2026-2031. Steady asset growth rests on a blend of supportive regulation, rising digital distribution, and deepening investor appetite for ESG strategies. Fee compression remains a headwind, yet scale economies, product innovation, and cross-border passporting are helping managers protect margins. The European Securities and Markets Authority’s stricter ESG-name guidelines, combined with the Sustainable Finance Disclosure Regulation’s Article 8 and Article 9 classifications, are channelling new money into compliant products while accelerating product rationalization among laggards. Capital Markets Union reforms continue to trim frictions in multi-jurisdictional marketing and settlement, giving the Europe mutual fund market wider access to both retail and institutional flows. Technology adoption from robo-advice to fund-unit tokenization is widening the addressable audience, cutting distribution costs, and providing data-rich servicing models that improve client retention. Macroeconomic normalization is reviving bond-fund demand as investors seek duration and credit-spread capture without abandoning equity allocations. With the top five managers controlling only 30.80% of assets, competitive intensity remains high, creating room for specialized boutiques to scale on thematic and alternative strategies.
Key Report Takeaways
- By asset class, equity funds captured 38.35% of the Europe mutual Fund Market size in 2025, while bond funds are forecast to post the fastest 9.98% CAGR through 2031.
- By investor type, retail investors accounted for 56.10% of the Europe mutual Fund Market size in 2025, whereas institutional assets exhibit the highest projected 7.49% CAGR to 2031.
- By distribution channel, banks led with 44.20% of the Europe mutual Fund Market size in 2025, but online platforms are advancing at a 16.85% CAGR through 2031.
- By geography, the United Kingdom commanded 26.18% of the Europe mutual Fund Market size in 2025, yet Spain is poised to expand at a 9.14% CAGR to 2031.
Note: Market size and forecast figures in this report are generated using Mordor Intelligence’s proprietary estimation framework, updated with the latest available data and insights as of 2026.
Market Trends and Insights
Drivers Impact Analysis of Europe Mutual Fund Market*
| Driver | (~) % Impact on CAGR Forecast | Geographic Relevance | Impact Timeline |
|---|---|---|---|
| ESG-aligned fund shift | +1.2% | Core EU with spillover to UK | Medium term (2-4 years) |
| Persistently low rates until 2027 | +0.8% | Eurozone core | Short term (≤ 2 years) |
| Capital Markets Union expansion | +0.6% | EU-27 excluding UK and Switzerland | Long term (≥ 4 years) |
| Rising robo-advisory adoption | +0.9% | Nordic leadership | Medium term (2-4 years) |
| Tokenization of fund units | +0.3% | Luxembourg-centered pilot markets | Long term (≥ 4 years) |
| ELTIF 2.0 cross-border passporting | +0.4% | EU-27 retail | Medium term (2-4 years) |
| Source: Mordor Intelligence | |||
ESG-aligned fund shift
Demand for sustainable strategies has vaulted Article 8 and Article 9 funds to the forefront of the Europe mutual fund market, pulling in USD 191–195 billion (EUR 180 billion) of net inflows during 2024, or 75% of aggregate mutual fund subscriptions[1]Autorité des Marchés Financiers, “Annual Report 2024 – Asset Management,” amf-france.org. . ESMA’s 2024 naming guidance tightened eligibility, forcing widespread reclassifications and temporary outflows from marginal products before stabilizing with more robust disclosure. Larger managers have exploited their research scale to meet the Sustainable Finance Disclosure Regulation’s Principal Adverse Impact demands, thereby shielding fee structures from the wider compression trend. France’s taxonomy-driven incentives catalyzed fresh thematic launches, including climate-transition and biodiversity strategies that command premium pricing. Institutional allocators now use ESG credentials as a gating criterion for manager selection, steering mandates toward platforms with proven stewardship frameworks. Retail investors, empowered by transparent impact metrics delivered through digital dashboards, are allocating a growing share of recurring monthly savings plans to sustainability-labeled funds. The evolving EU taxonomy, poised to add nuclear and gas to transition activities in 2025, is expected to unlock adjacent product lines and maintain inflow momentum into the Europe mutual fund market.
Rising robo-advisory adoption
Digital platforms that automate portfolio construction are carving out double-digit market-share gains, particularly across Nordic retail channels where 18% of assets already sit in automated mandates[2]Nordea Asset Management, “Nordic Investment Trends 2024,” nordea.com.. Algorithmic advice, now blessed by clarified MiFID II suitability rules, enables cost-effective offerings that charge 0.25–0.75% versus 1.5–2.5% at traditional branches. Germany’s BaFin green-lit 12 new robo licenses during 2024, signaling regulatory comfort with algorithmic services so long as governance and transparency standards are met. Vanguard’s European robo business logged 40% asset growth year-on-year, driven by tax-loss harvesting and low minimums that appeal to mass-affluent savers. Banks have responded by embedding white label robo modules into mobile apps, defending their 44.87% distribution share while bluntly lowering operating costs. Customer experience improvements, including straight-through KYC and biometric onboarding, shorten the investment funnel and accelerate AUM conversion. As artificial-intelligence engines mature, robo platforms will integrate ESG scoring and personalized retirement glide paths, raising the ceiling on digital penetration within the Europe mutual fund market.
Expansion of EU Capital Markets Union reforms
The third CMU action plan boosted cross-border passporting notifications by 25% in 2024, widening the Europe Mutual Fund Market’s addressable investor base across EU jurisdictions[3]European Commission, “Capital Markets Union Progress Report 2024,” ec.europa.eu. . Standardized withholding-tax procedures shaved operational friction, especially for Luxembourg and Irish UCITS seeking multi-country distribution. ESMA’s move toward a consolidated tape for funds improved price transparency, leveling the field for retail investors historically disadvantaged by fragmented data. Harmonized depositary rules under UCITS V let small and mid-sized managers secure pan-European custody at scale-economy pricing, lowering entry barriers for thematic and alternative strategies. The forthcoming European Single Access Point is set to centralize corporate-disclosure data, streamlining fund due diligence processes for institutions. Germany’s withholding-tax complexities remain a lingering bottleneck, showing that local idiosyncrasies can temper CMU benefits. Despite uneven rollout, aggregate cost savings from CMU initiatives support positive operating-leverage effects that underpin the 3.58% CAGR expectation for the Europe mutual fund market.
Cross-border passporting efficiencies post-ELTIF 2.0
ELTIF 2.0 slashed minimum ticket sizes from USD 10,700 to USD 1,070 (EUR 10,000 to EUR 1,000), unlocking an estimated USD 577.5 billion (EUR 500 billion) of European retail savings for infrastructure, private equity and real-estate strategies. Luxembourg’s CSSF approved 15 new structures in 2024, many marketed across borders in turnkey wrappers that simplify KYC and settlement. Enhanced liquidity provisions, including mandated redemption windows and secondary-market access, calmed past concerns about long lockups. Amundi’s inaugural retail infrastructure ELTIF attracted USD 2.31 billion (EUR 2 billion) in six months, illustrating pent-up appetite for alternatives among mass-affluent savers. Alignment with EU taxonomy goals enables managers to notch both sustainability and diversification credentials, creating halo effects that resonate with institutional consultants. Banks bundle ELTIFs alongside retirement offerings, using simplified disclosure templates to satisfy MiFID II cost-clarity requirements while deepening wallet share. Over time, retail alternative inflows are likely to mitigate the demographic drawdown drag on traditional equity allocations in the Europe mutual fund market.
Restraints Impact Analysis of Europe Mutual Fund Market*
| Restraint | (~) % Impact on CAGR Forecast | Geographic Relevance | Impact Timeline |
|---|---|---|---|
| Fee compression from passive products | -0.9% | Global with UK and Netherlands leadership | Short term (≤ 2 years) |
| SFDR Level 2 disclosure uncertainty | -0.4% | EU-27 with limited UK spillover | Medium term (2-4 years) |
| Heightened cybersecurity and data-privacy risk | -0.3% | Global with GDPR focus | Long term (≥ 4 years) |
| Demographic shift to decumulation | -0.6% | Germany and Italy core | Long term (≥ 4 years) |
| Source: Mordor Intelligence | |||
Fee compression from passive products
Index-tracking vehicles continue to siphon flows from higher-fee active peers, dragging average mutual-fund expense ratios in Germany down to 1.15% in 2024 from 1.45% in 2020. Vanguard’s European ETF book surged 35% to USD 207.9 billion (EUR 180 billion), emboldened by government-backed savings plans that waive transaction fees for ETF allocation. Fixed-income ETFs now offer 0.05% headline TERs, forcing active bond managers to justify fees north of 0.75% with demonstrable alpha or bespoke mandates. Product rationalization accelerated, with 15% of European fund ranges consolidated or liquidated during 2024, shedding sub-scale offerings that cannot compete on price. Managers responded by introducing factor-based hybrids and performance-fee share classes, but these measures often cannibalize legacy revenue streams. Margin contraction has intensified M&A rationales as mid-tier platforms search for cost synergies and digital operating leverage. Sustained price competition is forecast to shave 0.9 percentage points off aggregate CAGR potential for the Europe Mutual Fund Market over the next two years.
Demographic shift to decumulation among aging investors
Europe’s median age continues to rise, shifting household financial priorities from capital accumulation to income generation and capital preservation. German and Italian retirees are redeeming equity-heavy mutual-fund positions in favor of drawdown strategies, tilting net flows away from growth products. Pension reforms that expand defined-contribution coverage blunt the outflow, but younger cohorts save less than their elders did at comparable life stages, slowing absolute AUM growth. Managers are launching target-date and managed-payout funds, yet these conservative allocations earn lower all-in fees, compressing top-line revenue even when assets stabilize. Italy’s recent pension reforms accelerate liquidity needs, compelling managers to hold more cash or shorter-duration bonds, which erodes return potential. Robo-advisors cater to aging clients with automated withdrawal schedules, adding competitive pressure on traditional distributors that rely on human advice for retiree segments. Overall, demographic decumulation is projected to trim 0.6 percentage points from the Europe Mutual Fund Market’s forecast CAGR by 2030.
*Our forecasts treat driver/restraint impacts as directional, not additive. The impact forecasts reflect baseline growth, mix effects, and variable interactions.
Europe Mutual Fund Market Segment Analysis
By Asset Class:
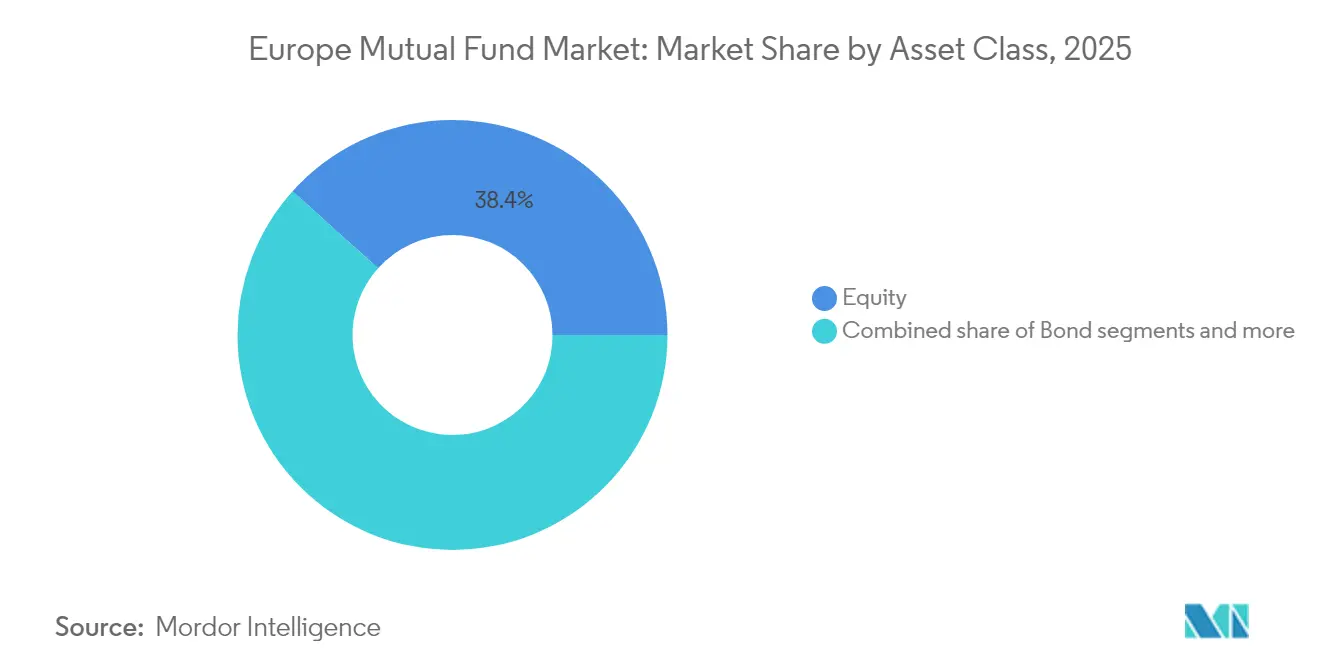
Equity Leadership Meets ESG TransformationEquity funds commanded 38.35% of the Europe mutual fund market share in 2025, reflecting a sustained appetite for growth themes and the rapid mainstreaming of ESG mandates. Bond funds followed closely at 35.42% as investors sought duration and inflation hedges amid ECB tightening cycles that nudged yields off historic lows without triggering recession. Hybrid allocations captured 15.62%, appealing to balanced-profile savers who value downside buffers during volatile rate regimes. Money-market strategies maintained 8.01% as corporate treasurers parked cash to earn improved overnight returns in a recovering rate backdrop. Alternative UCITS, though only 2.60%, grew swiftly on infra-debt and private-credit replication funds that promise diversification plus liquidity. The forecast 6.18% CAGR for equity funds implies that the Europe mutual fund markett size for equities could surpass USD 22.27 trillion by 2031 if current inflow momentum persists. Regulatory clarity under the Digital Operational Resilience Act requires each asset-class platform to invest in cyber infrastructure, lifting compliance spend to USD 2.88 million (EUR 2.5 million) per manager on average.
Equity funds are increasingly Article 8 or Article 9-labeled, with ESG screening embedded into standard prospectus language rather than marketed as stand-alone features. Bond funds benefit from renewed institutional allocations to investment-grade credit, particularly in the UK, where pension fund LDI unwind has freed balance-sheet capacity for traditional mutual-fund vehicles. Hybrid strategies leverage automated rebalancing engines to maintain risk bands, offering comfort to retail investors wary after the 2022-2023 volatility episodes. Money-market offerings reinvented themselves through tokenized share classes that settle on blockchain within minutes, reducing counterparty and settlement risk while meeting MiFID cost-transparency rules. Alternative UCITS continue to harvest relative-value and macro-trend opportunities, attracting institutions that want daily dealing with lower operational due diligence overheads than private fund structures. As a result, the Europe mutual fund market size dedicated to alternatives is projected to triple by 2030, albeit from a low base, contributing marginally but meaningfully to overall diversification. Cross-asset correlations will dictate product development velocity, encouraging managers to bundle multi-asset ESG, climate, and factor overlays into turnkey wrappers for both retail and institutional clients.


By Investor Type:
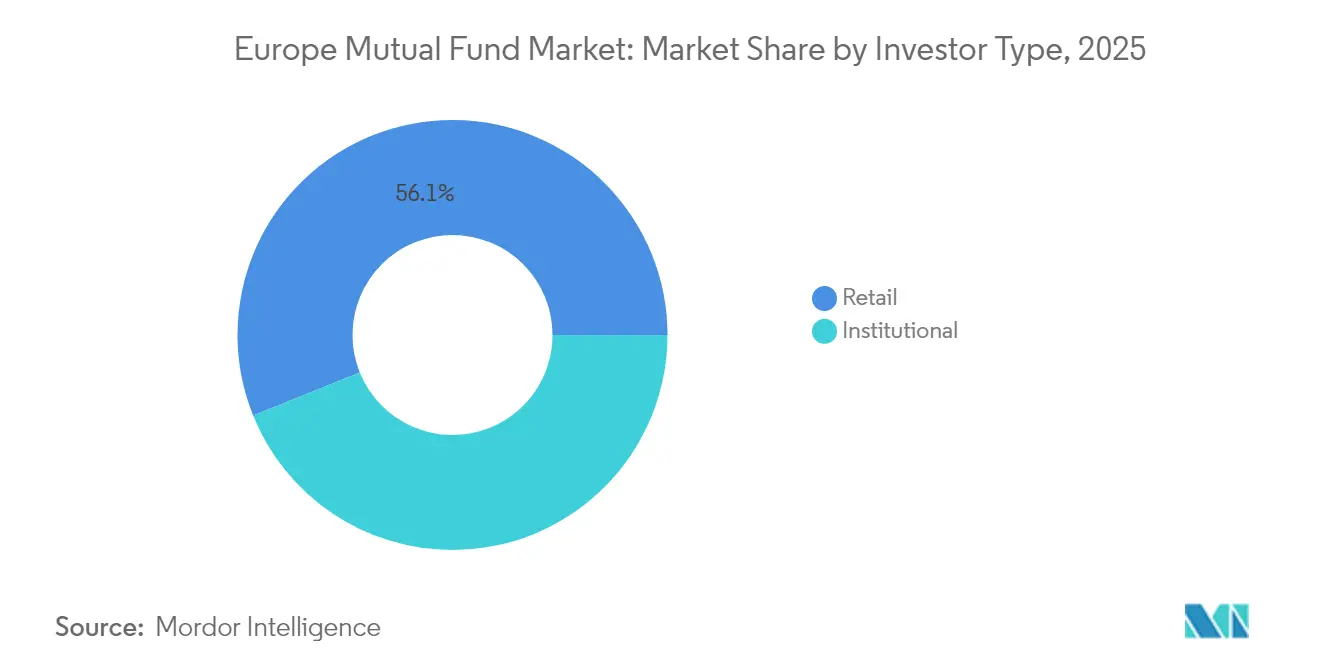
Retail Resilience and Institutional PrecisionRetail investors held 56.10% of aggregate AUM in 2025, cementing their pivotal role in the Europe mutual fund market. Digital on-ramps, fee transparency, and the rise of low-minimum thematic funds are expanding participation among first-time investors across Spain, France, and the Nordics. Workplace auto-enrolment schemes are steering incremental salary deferrals into diversified multi-asset funds, mitigating demographic headwinds from aging populations. Regulators have mandated cost-breakdown dashboards, empowering individuals to compare TERs and steering flows toward competitive vehicles, including ELTIFs newly available at USD 1,155 (EUR 1,000) minimums. Meanwhile, institutional investors, responsible for 43.90% of assets, deploy precision mandates driven by solvency and accounting constraints, often insisting on customized ESG exclusions aligned with fiduciary duty. Norwegian and Dutch pension funds boosted European equity exposure by double digits in 2024, capitalizing on sector leadership in renewable-energy and tech enablers. The convergence of retail and institutional preferences on sustainability enables economies of scale for managers, though institutional clients negotiate fee breaks that temper revenue uplift.
Retail growth, forecast at 7.12% CAGR through 2031, depends on continued fintech penetration and robust investor-protection frameworks that maintain confidence after market drawdowns. Robo-platforms educate younger cohorts via gamified apps, while banks deploy hybrid advisory models that blend human coaching with algorithmic rebalancing to preserve legacy relationships. Institutional inflows remain lumpy, tied to AL rebalancing and regulatory capital shifts, yet structured-product wrappers linked to mutual-fund baskets are gaining traction among insurers seeking capital-efficient yield. Harmonized reporting standards under the Corporate Sustainability Reporting Directive foster cross-segment product portability, enabling managers to clone retail strategies for institutional bespoke tranches with minimal incremental cost. Both investor segments now expect real-time ESG metrics and scenario-analysis dashboards, a demand that pressures back-office data infrastructures but strengthens client stickiness once implemented. Fee negotiations gravitate toward performance-linked structures, particularly among institutional allocations to active ESG equity, thereby aligning economics with alpha delivery. Robust custody and trustee supervision help reinforce trust, ensuring that the Europe mutual fund market retains its central position in European household portfolios despite growing ETF competition.
By Distribution Channel:
Digital Disruption Reshapes the Value ChainBanks continued to dominate with a 44.20% share in 2025, yet online platforms logged a blistering 16.85% CAGR that is forecast to persist through 2031. Swift digital onboarding, low fees, and intuitive UX attract millennials and Gen-Z savers who now account for a rising slice of monthly systematic investment plans. Financial advisors remained relevant at 17.60%, serving the complex needs of high-net-worth clients who value estate planning, tax optimization, and bespoke ESG tilts. Direct-to-fund distribution channelled 12.40% of flows, largely via asset-manager websites offering zero-commission subscriptions funded by payment-for-order-flow economics. Open-banking legislation unlocked third-party data aggregation, allowing fintechs to present 360-degree balance sheets and push personalized mutual fund nudges based on cash flow analytics. Banks strike back by embedding robo modules and upgrading mobile interfaces, illustrated by UBS’s digital wealth arm adding 45% AUM in 2024 after integrating AI chatbots for goal planning. Tokenized units traded 24/7 on permissioned blockchains reduce settlement latency, enhancing liquidity perception and appealing to younger investors accustomed to real-time finance.
Platform competition compresses front-end fees but multiplies asset velocity, as frictionless switching rebalances portfolios faster and increases advisory-engagement touchpoints. Regulators monitor inducement models to ensure that zero-commission offers do not hide indirect costs, compelling platforms to display total expense ratios prominently. Banks leverage their balance sheets to wrap funds in insurance-linked savings, an approach that bundles capital guarantees with fund upside, preserving margins even when headline fees fall. Financial-advisor networks adopt holistic wellness frameworks, integrating cash flow planning, pension projections, and ESG preferences into a unified dashboard that enhances stickiness. Direct channels evolve toward community-driven investing with social-sharing features, gamifying progress toward goals, and viralizing thematic fund launches. AML/KYC protocols become API-based, shortening account-opening times to minutes and aligning with European e-ID initiatives, thereby boosting subscription conversion rates. Ultimately, digital engagement deepens investor education and expands the Europe mutual fund market size by tapping unbanked or under-invested cohorts across the continent.
Geography Analysis
Western Europe Mutual Fund Market
The Europe mutual fund market reflects a diverse and evolving landscape, with the United Kingdom, Germany, and France holding leading positions. The UK continues to leverage London’s financial depth and global distribution despite Brexit, while reforms like Mansion House have streamlined fund approvals. Regulatory divergence has spurred innovation, including climate-transition funds aimed at domestic pensions, while fintech clusters and favorable FX dynamics attract international flows. Germany benefits from a strong institutional base and retail engagement driven by tax incentives and ESG product credibility. Established asset managers, favorable savings vehicles, and green-finance alignment with national policy goals propel France’s market. Together, these core markets form the backbone of mutual fund growth across the region.
Southern and Western Europe Mutual Fund Market
Southern and Western European countries, Spain, Italy, and the BENELUX bloc, are contributing increasingly to market expansion. Spain leads in forecast growth due to pension reforms and rapid digital adoption among younger savers, while banks drive fund flows through new third-pillar structures. Italy's market skews conservative due to demographics, cs yet sees rising interest in managed payout and target-date solutions, with Milan growing as a fund-servicing hub. BENELUX countries, though small by investor domicile, play an outsized role in fund administration, with Luxembourg acting as a central hub for cross-border UCITS distribution. Regulatory agility and infrastructure advantages make BENELUX a crucial logistical base for global sponsors. These countries' strategic positions support the broader efficiency and competitiveness of the European fund ecosystem.
Nordics and Central Europe Mutual Fund Market
In Northern and Emerging Europe, innovation and convergence are key growth drivers. The Nordics lead in digital adoption, ESG integration, and tokenization pilots, with strong state and retail alignment around green finance. High incomes and mobile-friendly platforms sustain steady contributions, while local regulators support cutting-edge product experimentation. Emerging markets like Poland and the Czech Republic are catching up via employer-sponsored schemes and improved market access through cross-listed UCITS. Fintech partnerships and digital-only offerings are reducing entry barriers and broadening investor bases. Currency-hedged products and tax reforms enhance appeal among more sophisticated investors. These regions, though varied in maturity, are increasingly important engines of growth for the Europe mutual fund market.
Regulatory Landscape
The Europe mutual fund market operates primarily under the UCITS and AIFMD frameworks, with regulators tightening both liquidity-risk and sustainability guardrails. Directive (EU) 2024/927 introduced enhanced liquidity-risk management expectations for UCITS management companies and AIFMs, requiring the availability of at least two liquidity management tools (LMTs) from a prescribed set. ESMA published Guidelines on LMTs in March 2026 to standardize selection, governance, and activation across jurisdictions.
Supervisory reporting is also shifting toward harmonization and simplification. The European Commission published the Market Integration and Supervision Package (MISP) on 4 December 2025, proposing amendments to the UCITS Directive and broader supervisory convergence, while ESMA released a May 2026 final report outlining an EU-wide integrated collection framework for fund data. Commission Delegated Regulation (EU) 2026/465 set RTS on LMT characteristics, effective from 16 April 2026, raising the need for managers to update prospectuses, operational procedures, and reporting systems ahead of more unified EU supervision.
Value Chain Analysis
The European mutual fund value chain runs from product manufacturing by asset managers (UCITS ManCos and AIFMs), supported by delegated portfolio management, index and data inputs, fund administration and transfer agency, depositary and custody, audit and legal structuring, and then distribution into retail and institutional channels. Industry associations point to the concentration of domiciles and servicing hubs, with Luxembourg and Ireland acting as key cross-border structuring and administration centers, while larger promoter markets such as the UK, Germany, and France anchor end-investor demand.
Distribution and servicing economics increasingly shape competitiveness, since distribution costs account for a large share of total fund costs (48% of UCITS costs and 27% of AIF costs, per ESMA-referenced cost breakdowns in the evidence pack). Cross-border distribution continues to favor larger, scalable funds, with the average fund size in cross-border distribution reaching EUR 558 million in 2025. ALFI also noted in its May 2026 cross-border distribution study that assets grew faster than the number of funds in 2025, totaling EUR 8.5 trillion for the cross-border segment discussed, reinforcing the role of platform access, distributor due diligence, and operational scale, including standardized reporting and liquidity-tool readiness, across the value chain.
Competitive Landscape
Competition in the Europe mutual fund market remains moderate, with the top five managers holding 30.80% of combined assets, leaving meaningful headroom for mid-sized and niche specialists. BlackRock leads at 9.8%, leveraging broad passive, active, and alternative capabilities and the Aladdin risk-analytics platform that deepens institutional partnerships. Amundi follows at 7.3%, combining scale manufacturing with local-market proximity and recently finalized partnerships that expand U.S. distribution while funneling ESG UCITS back into Europe. Vanguard’s cost-leadership model magnifies passive pressure, while DWS and UBS round out the top five through robust regional wealth networks and focused thematic strategies. Fee compression stimulates consolidation; Goldman Sachs Asset Management’s acquisition of NN Investment Partners underscores the trend toward bolting on European distribution and ESG competence.
Strategic differentiation increasingly rests on sustainable-investing credentials, data-science prowess, and digital client engagement. Firms pour capital into AI infrastructure to automate portfolio construction, classify ESG controversies, and personalize reporting, thereby spreading fixed costs across larger asset bases. Tokenization pilots, such as DWS’s money-market-fund launch on Polygon, showcase attempts to redefine liquidity and settlement speed, forging first-mover advantages in operational efficiency. Partnerships between asset managers and fintechs, typified by Intesa Sanpaolo’s 10-year pact with BlackRock’s Aladdin Wealth, signal a shift toward ecosystem playbooks rather than purely organic buildouts. Middle-office outsourcing gains traction as managers focus on alpha-generation and distribution, handing non-core functions to specialized providers who enjoy economies of scale across multiple sponsors.
Regulation acts as both a moat and a catalyst: MiFID II cost-transparency requirements elevate switching sensitivity, rewarding firms with clean-share structures and competitive TERs; SFDR compliance costs hamper small entrants yet advantage incumbents that amortize data frameworks across hundreds of strategies. Cross-border marketing efficiencies from CMU lower marginal expansion cost, enabling scalable platforms to penetrate secondary markets quickly and crowd out local boutiques without a differentiated edge. Specialty managers able to articulate high-conviction thematic or alternative expertise maintain pricing power despite ongoing fee wars. Overall, innovation, cost discipline, and regulatory fluency determine winners and dictate how quickly the Europe mutual fund market consolidates or fragments over the next five years.
Europe Mutual Fund Industry Leaders
BlackRock
Amundi
DWS Group
Schroders
Allianz Global Investors
- *Disclaimer: Major Players sorted in no particular order
Europe Mutual Fund Market Companies Covered in this Report
- BlackRock
- Amundi
- DWS Group
- Schroders
- Allianz Global Investors
- J.P. Morgan Asset Management
- UBS Asset Management
- AXA Investment Managers
- Legal & General Investment Management
- Invesco
- Fidelity International
- Franklin Templeton
- Pictet Asset Management
- abrdn
- M&G Investments
- Robeco
- BNP Paribas Asset Management
- Nordea Asset Management
- Danske Invest
- Goldman Sachs Asset Management (incl. NN IP)

Market Opportunities and Future Outlook
Open, digital distribution and product formats that combine transparency with competitive pricing are broadening the addressable investor base across Europe. EFAMA reported EUR 274 billion of net inflows into UCITS and AIFs in Q1 2026 (with UCITS net sales of EUR 251 billion), alongside quarterly ETF net inflows surpassing EUR 100 billion for the first time, which indicates momentum behind fund wrappers that support intraday access and clear fee outcomes. For managers, this is creating whitespace in low-fee and rules-based lineups, including ETF share classes and active ETFs, while increasing pressure on traditional share-class economics where distributors emphasize cost comparisons.
Operational transformation and regulatory simplification initiatives are also creating an opportunity set focused on data, reporting, and automation. ESMA published its May 2026 final report on an integrated EU framework for funds data collection, and the European Commission’s MISP proposals (published 4 December 2025) aim to reduce national discretions that complicate cross-border activity; both developments push firms toward consolidated data architectures and more standardized supervisory interfaces. ESMA also highlighted in March 2026 evidence on AI adoption that 53% of firms in the surveyed sample still had no AI use cases in production or development, leaving room for differentiation through targeted automation in client reporting, controls, and back-office processing, particularly for managers with multi-country UCITS ranges who can amortize technology investment across broader distribution footprints.
Recent Industry Developments in Europe Mutual Fund Market
- July 2026: Allianz Global Investors listed its first three Active UCITS ETFs on Deutsche Boerse, expanding its European distribution footprint for active strategies in an exchange-traded format. The listing improves price transparency and intraday tradability for strategies that previously sat in traditional mutual fund wrappers, and it points to faster scaling through major European listing venues.
- January 2025: BlackRock completed its acquisition of Preqin for USD 2.55 billion, adding private-markets data and analytics capabilities to its platform. The expanded dataset supports fund selection, benchmarking, and portfolio construction workflows for institutional clients, reinforcing scale advantages in alternatives distribution and servicing across Europe.
- October 2024: DWS Group launched a tokenized money market fund on the Polygon blockchain, enabling fractional ownership and around-the-clock trading mechanics for eligible investors. This approach reduces settlement frictions and shows how tokenized fund units can complement existing UCITS-style structures by improving transfer, ownership recording, and liquidity management processes.


Europe Mutual Fund Market Report Scope and Research Methodology
Market Definition and Coverage
This market is measured as the value of assets held in Europe-focused mutual funds, expressed as assets under management (AUM) and reported in USD for consistency across countries and time.
Scope exclusions: It excludes discretionary mandates, separately managed accounts, and direct holdings outside mutual fund wrappers (including most insurance general account assets).
Segments Covered in This Report
- By Asset Class
- Equity
- Bond
- Hybrid
- Money Market
- Others
- By Investor Type
- Retail
- Institutional
- By Distribution Channel
- Banks
- Online Platforms
- Financial Advisors
- Direct
- By Geography
- United Kingdom
- Germany
- France
- Spain
- Italy
- BENELUX (Belgium, Netherlands, Luxembourg)
- NORDICS (Denmark, Finland, Iceland, Norway, Sweden)
- Rest of Europe
Data Sources, Market Sizing, and Validation
Desk Research
Desk work starts by defining which fund types count as mutual funds and then mapping the country coverage, fund classifications, and reporting dates so the inputs can be compared on the same basis. We rely on public datasets and rulebooks that describe the investable fund universe and its reporting structure, including EFAMA statistics, European Central Bank investment fund data, ESMA guidance notes, and publications from national regulators.
To build the sizing backbone, we also review fund-industry flow and AUM releases, central bank exchange-rate series for FX conversion, and inflation and rate indicators from sources such as Eurostat and the IMF. We then cross-check whether country-level growth drivers, like net flows and market returns, align with what the model implies. Where needed, our team references paid subscriptions for company financials and investor materials. For background checks on distribution and fund-operations technology, we use an importable patent database only, since it is not part of the core AUM estimate. These examples are not exhaustive, and the team also used other public sources for data collection, validation, and clarification.
Primary Interviews and Surveys
Fieldwork focused on validating how AUM is mapped into the report scope and how quickly the measure changes with market moves and investor flows. We interviewed asset managers, distributors, and industry specialists across major European markets so assumptions on net sales, product mix shifts, and fee trends could be tested and adjusted when needed.
Distribution of primary research fieldwork respondents
| Company type | Respondent position |
|---|---|
| Top tier: 36% | CXOs: 14% |
| Mid tier: 43% | Functional/Unit leaders: 29% |
| Smaller Players: 21% | Managers: 57% |
Market-Sizing & Forecasting
Sizing starts with a top-down build where reported Europe fund net assets are reconstructed by country and fund category, then aligned onto one reporting calendar and currency basis before totals are rolled up. We corroborate the result with selective bottom-up checks, including sampled AUM by major fund groups, distribution channel splits, and implied fee yield reasonableness tests, which helps identify and correct overcounts.
We track model inputs that move the market value in visible ways, including net sales versus redemptions, equity and bond market return proxies, interest rate and yield shifts that influence money market funds, changes in the active versus index product mix, and FX movements between the euro, pound, and USD reporting. Forecasts use scenario analysis anchored on these drivers so bull and bear market conditions, along with flow momentum, are reflected rather than assuming a smooth trend. When a country or category has gaps in public disclosure, we fill it using peer ratios and then test those inferred values against aggregate fund statistics before finalizing the number.
Data Validation & Update Cycle
Outputs are checked in several steps so the market size stays tied to real signals. We compare model totals against independent AUM and flow indicators, then review outliers by country, asset class, and channel before sign-off.
If a variance is driven by a reporting-date mismatch, a currency move, or an unusual quarter for flows, the assumption is revisited and experts are re-contacted. Reports are refreshed annually, and interim updates are made when material events shift AUM materially. Before delivery, the latest public releases are re-checked so clients receive the most current view.
Mordor Intelligence's Europe Mutual Fund Market Sizing Compared With Other Published Estimates
Published market values for Europe mutual funds often differ because the underlying datasets do not match on what counts as a fund, which geography is included, and which date is used for assets under management. Differences also show up when one source reports end-year values while another uses rolling quarters, which can move the number quickly in a market where prices and flows move together.
In practice, the larger gaps usually come from mixing UCITS with broader asset management pools, converting EUR values to USD using different FX dates, and treating ETFs and index-tracking funds inconsistently. By using defined FX timing, checking implied fee yield trends against the AUM path, and revalidating the latest quarterly signals before final sign-off, the refresh cadence stays tight within Mordor Intelligence.
Benchmark comparison
| Source | Market Size | Gaps in Research Methodology |
|---|---|---|
| Mordor Intelligence | USD 41.54 T (2025) | |
| Industry Association A | USD 25.74 T (2024) | Reported as Europe investment funds net assets in EUR at end-2024 (UCITS plus AIFs), and the USD figure depends heavily on the EUR-USD conversion date and whether the UK and non-domiciled holdings are treated the same way. |
| Industry Data Publisher B | USD 17.03 T (2024) | Often reflects a narrower Europe fund industry view focused on mutual funds and ETFs with end-2024 EUR AUM, which can understate totals if cross-border domiciles, non-ETF index funds, or broader mutual fund wrappers are not fully aligned to the report scope. |
The spread in the table mainly comes down to scope boundaries and timing choices, not just math. When the same AUM concept is aligned to one calendar point, one currency timing, and one included fund universe, the market total becomes easier to trace back to flows, returns, and product mix changes.


Key Questions Answered in the Report
How large is the Europe Mutual Fund Market in 2026?
It reached USD 43.01 trillion in 2026 and is projected to grow at a 3.54% CAGR to USD 51.18 trillion by 2031.
Which asset class holds the biggest share of European mutual-fund assets?
Equity funds lead with a 38.35% share, reflecting sustained demand for growth and ESG-tilted strategies.
Which distribution channel is growing fastest across Europe?
Online investment platforms post the quickest expansion, advancing at a 16.85% CAGR through 2031 as digital engagement deepens.
Why is Spain considered a high-growth mutual-fund market?
Pension reforms that shift responsibility to individuals, coupled with mobile-first platforms, fuel a 9.14% forecast CAGR for Spanish-domiciled assets.
How are demographic trends influencing mutual-fund flows?
Aging populations in Germany and Italy are shifting assets toward income-focused and decumulation strategies, moderating overall equity inflows.
What role does tokenization play in European mutual funds?
Pilot projects such as tokenized money-market funds promise near-instant settlement and fractional ownership, potentially reshaping liquidity and investor access.
Page last updated on:


 Your data is secure and never sold or shared.


