
Market Overview
| Study Period | 2020 - 2031 |
|---|---|
| Forecast Data Period | 2026 - 2031 |
| Base Year Market Size (2025) | USD 136.45 Billion |
| Market Size (2026) | USD 174.05 Billion |
| Market Size (2031) | USD 587.95 Billion |
| Growth Rate (2026 - 2031) | 27.55% CAGR |
| Market Concentration | Medium |
Major Players *Disclaimer: Major Players sorted in no particular order Image © Mordor Intelligence. Reuse requires attribution under CC BY 4.0. | |
Europe Mobile Payments Market Analysis by Mordor Intelligence
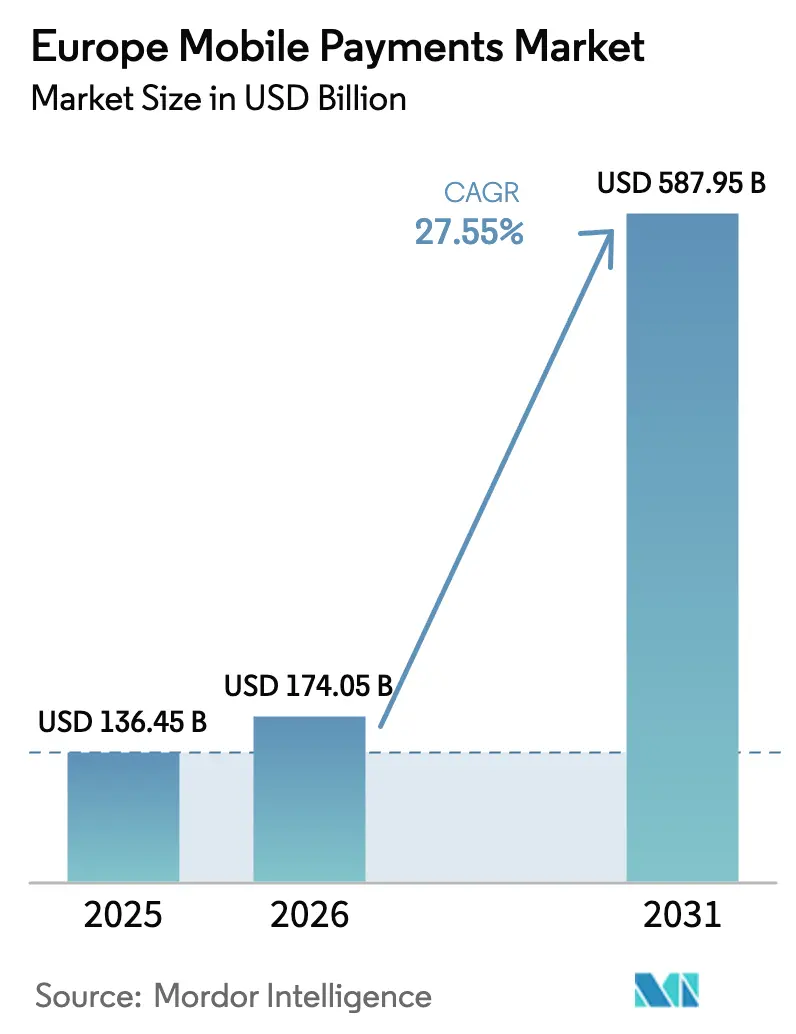
The Europe mobile payments market size was valued at USD 136.45 billion in 2025 and estimated to grow from USD 174.05 billion in 2026 to reach USD 587.95 billion by 2031, at a CAGR of 27.55% during the forecast period (2026-2031). Rapid scale-up stems from PSD2-enabled open banking rails, near-ubiquitous NFC acceptance, and deepening smartphone penetration. Instant payments regulation now obliges eurozone banks to execute account-to-account transfers in seconds, while more than 90% of point-of-sale (POS) terminals already support contactless functionality. Retailers, transit operators, and digital-first merchants are integrating mobile wallets, biometric authentication, and tokenization to lift checkout conversion and reduce fraud. Regionally, mature fintech ecosystems in the United Kingdom, Germany, and France dominate volumes, but Spain, Portugal, and the Nordic states are posting the steepest growth curves as domestic wallet schemes expand cross-border reach. Competitive intensity is rising as European processors such as Worldline defend share against global technology giants and agile fintech entrants.
Key Report Takeaways
- By payment type, proximity payments led with 67.18% of Europe mobile payments market share in 2025; remote payments are forecast to grow at a 30.48% CAGR through 2031.
- By transaction type, POS transactions accounted for 44.60% of the Europe mobile payments market size in 2025, while peer-to-peer (P2P) transfers are set to expand at 31.40% CAGR to 2031.
- By application, retail and eCommerce contributed 34.55% revenue share in 2025; transportation and logistics is the fastest-growing application segment, advancing at a 31.95% CAGR.
- By end-user, individual consumers held 79.35% share in 2025, whereas business users are projected to record a 30.10% CAGR between 2026 and 2031.
- By geography, the United Kingdom captured 19.05% of the Europe mobile payments market in 2025; Spain is forecast to grow at a market-leading 30.60% CAGR to 2031.
Note: Market size and forecast figures in this report are generated using Mordor Intelligence’s proprietary estimation framework, updated with the latest available data and insights as of 2026.
Europe Mobile Payments Market Trends and Insights
Drivers Impact Analysis*
| Driver | (~) % Impact on CAGR Forecast | Geographic Relevance | Impact Timeline |
|---|---|---|---|
| PSD2-Driven Open-Banking Mandates Accelerating Instant Account-to-Account Mobile Payments | +4.2% | EU-wide, strongest in Germany, France, Netherlands | Medium term (2-4 years) |
| Contactless Adoption Surging with more than 90% NFC-Enabled POS Penetration Across Eurozone | +3.8% | Eurozone core, spillover to UK and Nordic | Short term (≤ 2 years) |
| Integration of Mobile Wallets into Urban Transport Ticketing Ecosystems | +2.1% | Major metropolitan areas across Europe | Medium term (2-4 years) |
| BNPL Expansion within Mobile Checkout Flows in DACH & Nordic Countries | +3.5% | Germany, Austria, Switzerland, Denmark, Sweden, Norway | Short term (≤ 2 years) |
| Cross-Border E-commerce Growth under EU Digital Single Market Rules | +2.8% | EU-wide with concentration in major e-commerce hubs | Medium term (2-4 years) |
| Tokenisation & Biometric SCA Lowering Fraud and Raising Consumer Trust | +2.4% | Global, with early adoption in UK, Netherlands, Nordic | Long term (≥ 4 years) |
| Source: Mordor Intelligence | |||
PSD2-driven open-banking mandates accelerating instant account-to-account mobile payments
The EU Instant Payments Regulation requires every euro-denominated account in the Single Euro Payments Area to support real-time transfers by October 2025. Banks must clear ≤ EUR 100,000 (USD 110,000) in ≤10 seconds and verify payee details before posting funds.[1]ACI Worldwide, “EU Instant Payments Regulation Explained,” aciworldwide.com Wero, the European Payments Initiative’s wallet, already counts 14 million users in Germany, France, and Belgium and processes cross-border payments via the EuroPA alliance.[2]European Payments Initiative, “Wero Launch Update,” epi.com These measures lower scheme fees, reduce settlement risk, and give merchants an alternative to card rails, adding structural lift to the Europe mobile payments market.
Contactless adoption surging with >90% NFC-enabled POS penetration across eurozone
European Central Bank data show that 53.8% of all card transactions in 2024 were contactless, up nearly 20 percentage-points year on year.[3]European Central Bank, “Study on Payment Attitudes,” ecb.europa.eu Denmark leads with 90% contactless share, followed by Norway at 87%, supported by over 90% NFC-enabled POS coverage. Apple’s Tap to Pay on iPhone arrived in nine more European countries in March 2025, giving small merchants an in-hand acceptance option without extra hardware. The European Commission accepted Apple’s commitment to open NFC to third-party wallets, which is expected to intensify competition among wallet providers.
Integration of mobile wallets into urban transport ticketing ecosystems
Transport authorities are deploying open-loop acceptance to streamline boarding and cut ticketing costs. France’s Tisséo network completed full contactless rollout in 2024, while FAIRTIQ’s pay-as-you-go solution now covers Denmark nationwide and multiple German states, processing more than 176 million trips in 2023. Samsung Wallet integrates with Île-de-France Mobilités to allow riders in the Paris region to tap phones or watches instead of paper tickets. These deployments extend use cases beyond retail, widening the Europe mobile payments market.
BNPL expansion within mobile checkout flows in DACH & Nordic countries
Buy Now Pay Later (BNPL) penetration reached 43% of European online shoppers in 2024, propelled by Klarna’s SEK 1 trillion (USD 0.1 trillion) annualised GMV and partnerships with Apple Pay and Google Pay. The Consumer Credit Directive revisions mandate clearer disclosures and cooling-off periods, which should enhance consumer trust while sustaining growth. In Germany, Austria, and the Nordics, high digital literacy and strong bank coverage enable friction-free BNPL settlement inside mobile wallets, driving incremental volumes for the Europe mobile payments industry.
Restraints Impact Analysis*
| Restraint | (~) % Impact on CAGR Forecast | Geographic Relevance | Impact Timeline |
|---|---|---|---|
| Regulatory Fragmentation Post-Brexit & in Non-EU States Elevates Integration Complexity | -2.8% | UK, Switzerland, Norway, with spillover effects to EU border regions | Long term (≥ 4 years) |
| Higher Merchant Service Fees for Wallet Transactions in Southern Europe | -1.9% | Italy, Spain, Portugal, Greece | Medium term (2-4 years) |
| Cash Preference among Micro-Merchants in Italy & Spain | -1.4% | Italy, Spain, with concentration in rural and traditional retail areas | Medium term (2-4 years) |
| Escalating Cyber-Attacks on Soft-POS and Wallets Impacting Senior Demographics | -1.1% | Global, with higher impact in countries with aging populations | Short term (≤ 2 years) |
| Source: Mordor Intelligence | |||
Regulatory fragmentation post-Brexit & in non-EU states elevates integration complexity
Divergent frameworks between the EU’s PSD2 regime and the UK’s Financial Services and Markets Act 2023 create parallel compliance tracks, forcing processors to maintain dual authorisations and distinct strong-customer-authentication flows. Switzerland and Norway are outside SEPA Instant’s mandatory scope, requiring bespoke bilateral agreements that extend onboarding timelines for pan-European wallets. This fragmentation raises cost-to-serve and tempers cross-border adoption within the Europe mobile payments market.
Higher merchant service fees for wallet transactions in Southern Europe
Micro-merchants in Italy and Spain pay wallet fees exceeding 1.0% per transaction plus equipment rental, compared with sub-0.3% domestic debit interchange for cards. The Italian Revenue Agency’s 2025 mandate to couple POS terminals with fiscal registers adds capex for small retailers, reinforcing cash preference at low ticket values. Unless fee structures fall or incentives rise, digital wallet uptake among Southern European micro-merchants will stay muted, restraining overall market growth.
*Our forecasts treat driver/restraint impacts as directional, not additive. The impact forecasts reflect baseline growth, mix effects, and variable interactions.
Segment Analysis
By Payment Type: Proximity Payments Hold the Advantage
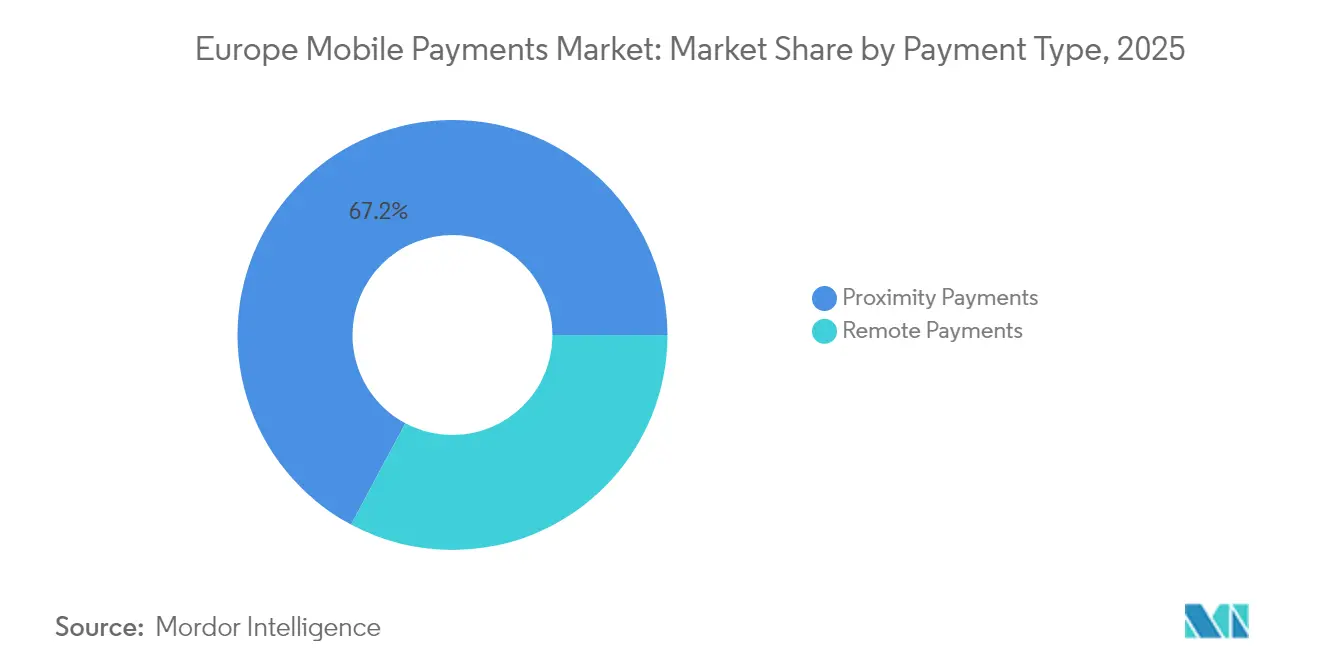
Proximity transactions captured a dominant 67.18% share of the Europe mobile payments market in 2025 as retailers capitalised on >90% NFC penetration and consumer confidence in tap-and-go checkout. NFC-enabled wearables and Apple’s Tap to Pay expansion further reduce friction at physical touchpoints. Contactless validation in transit systems such as Tisséo is adding new high-frequency use cases that cement daily habits. Remote payments, while representing a 32.82% slice, are scaling at a 30.48% CAGR as mobile-optimised eCommerce, tokenised card-on-file, and open-banking pay-by-bank offers gather steam. BNPL integration inside remote mobile flows lifts basket sizes and conversion. The widening reach of Wero’s account-to-account rail and Worldline’s Bank Transfer product across 14 markets augments remote acceptance breadth. Tokenisation commitments from Mastercard and Visa promise lower fraud and higher approval rates, reinforcing remote momentum.
Despite faster growth, proximity retains a structural edge through omnichannel acceptance and tactile immediacy. Merchants use SoftPOS and Tap on Mobile to turn smartphones into terminals, shrinking hardware costs. Conversely, remote transactions benefit from higher margins and richer data for loyalty orchestration. Over the forecast period, channel convergence will blur distinctions as super-apps offer both in-store QR or NFC and in-app checkout anchored on a single credential. Nevertheless, proximity is expected to remain the anchor channel owing to Europe’s dense physical retail footprint and accelerating transport integrations.


By Transaction Type: POS Still Largest, P2P Fastest Growing
POS transactions accounted for 44.60% of the Europe mobile payments market size in 2025, reflecting deep merchant acceptance and consumer familiarity. Retailers continue to replace legacy terminals with cloud-based, Android-powered devices that natively run loyalty, inventory, and payments, boosting in-store operational agility. Widespread EU regulations mandating real-time account crediting enhance settlement certainty for merchants, encouraging further POS digitisation.
Peer-to-peer (P2P) flows, while smaller, are projected to surge at a 31.40% CAGR as domestic wallet schemes interconnect through the EuroPA framework. Bizum in Spain, BANCOMAT Pay in Italy, and Vipps MobilePay in the Nordics are moving from domestic P2P into retail and micro-merchant acceptance, widening addressable volume. Instant settlement, zero or low fees, and ease of entry make P2P an accessible alternative to cash for informal exchanges. Over time, as QR codes and alias-based identifiers proliferate, P2P volumes will spill into person-to-merchant micro-payments, further diminishing cash usage.
By Application: Retail Leads, Transport Races Ahead
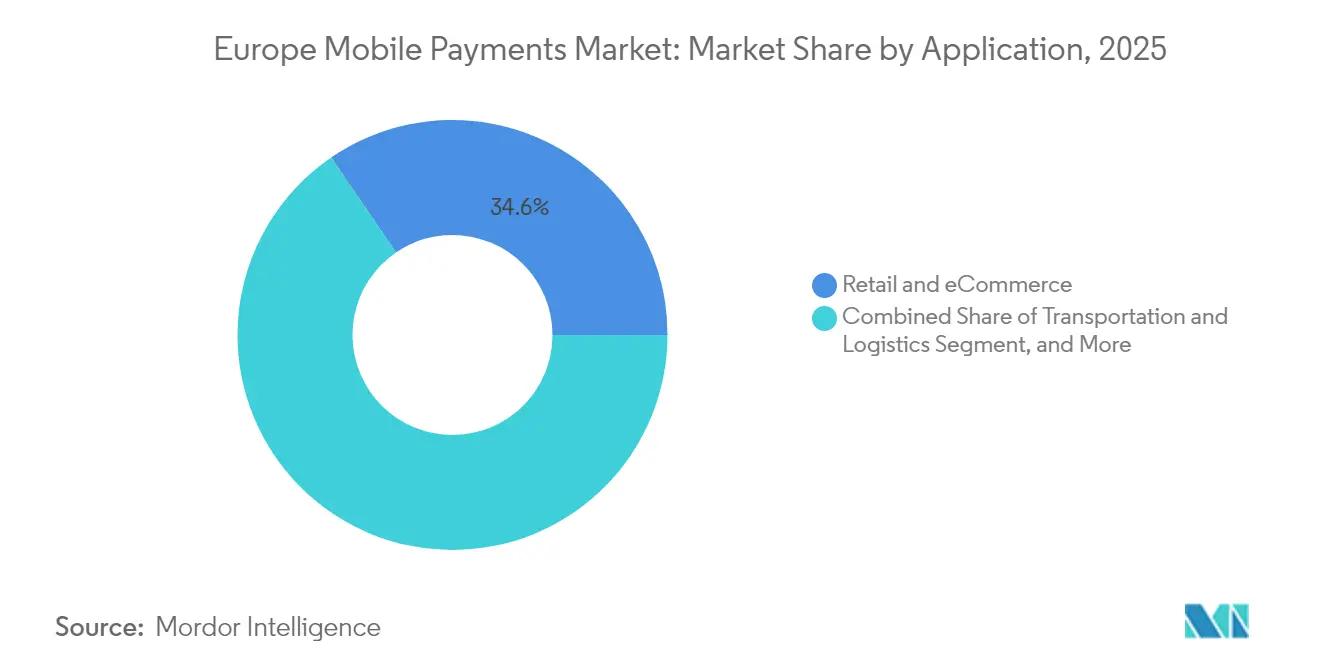
Retail and eCommerce generated 34.55% of 2025 value, driven by omnichannel strategies that merge click-and-collect, curb-side pickup, and self-checkout. Merchants deploy token vaults and embedded wallets to marry fast checkout with loyalty accrual, raising repeat purchase rates. Dynamic pay-by-bank and vault-on-file tokenisation remove card entry friction, boosting mobile conversion.
Transportation and logistics, though smaller, will rise at a 31.95% CAGR as contactless turnstiles and mobile wallets replace paper tickets. Open-loop models give operators lower cost-of-fare collection, accurate demand data, and reduced fraud. Integrations such as Samsung Wallet in Paris and FAIRTIQ in Denmark prove scalable. As European cities mandate low-emission zones and MaaS (Mobility-as-a-Service) platforms, mobile payments become the orchestration layer for multimodal journeys, cementing the segment’s growth trajectory.
By End-user: Consumers Dominate, Businesses Accelerate
Individuals represented 79.35% of 2025 transaction value, sustained by widespread smartphone adoption and digital wallet familiarity. Consumers engage with super-apps that combine payments, loyalty, and micro-investing, making mobile the primary wallet in markets such as the Nordics and the UK. Biometric authentication and tokenised credentials reduce perceived risk and drive habitual usage.
Business users, currently 20.65% of revenue, are forecast to grow at 30.10% CAGR as small enterprises embrace SoftPOS and embedded finance. Worldline’s soft terminal has onboarded 6,300 micro-merchants, while Extenda Retail and Softpay help chains reduce queue times via line-busting. Enterprises adopt real-time payroll and expense reimbursement via mobile rails, replacing batch bank transfers. B2B BNPL emerges as a working-capital tool for SMEs, promising to unlock further adoption and diversify the Europe mobile payments industry revenue base.
Geography Analysis
The United Kingdom holds 19.05% share of the Europe mobile payments market on the back of an advanced fintech stack, strong Open Banking uptake, and proactive regulators who balance innovation with consumer safeguards. The National Payments Vision prioritises next-generation rails, including a potential shift to ISO 20022 and real-time data-rich messaging, ensuring future-proof infrastructure. Domestic schemes like Pay.UK’s Paym and Confirmation of Payee bolster fraud mitigation, promoting consumer confidence.
Germany follows closely, propelled by high BNPL usage, robust bank-led wallets, and Wero’s launch across major lenders. Real-time settlement and broad merchant penetration spur both POS and remote volumes. France benefits from the dominance of Cartes Bancaires and the nationwide rollout of contactless transit ticketing, which embeds habitual wallet usage. The Netherlands maintains advanced digital payment maturity, with iDEAL’s migration toward the Open Payments Framework setting a benchmark for user-centric interoperability.
Spain is the fastest-growing geography at a 30.60% CAGR to 2031. Bizum’s rapid user acquisition, the forthcoming Bizum Pay NFC retail solution, and high smartphone penetration create fertile conditions. Government incentives for digitalisation under Spain’s Recovery and Resilience Plan channel funds toward merchant enablement. Nordic countries, already near-cashless, push growth through wallet consolidation: Vipps and MobilePay merged to deepen scale and entered the EuroPA alliance to enable P2P across Southern Europe. Outside the EU, Switzerland and Norway deliver strong domestic adoption but face interoperability friction due to regulatory divergence, tempering cross-border flows.
Post-Brexit complexity hampers seamless UK-EU integration, compelling processors to duplicate compliance controls. Still, the UK’s dynamic fintech venture capital ecosystem continues to pilot innovations such as variable recurring payments, maintaining its influence on Europe-wide product roadmaps. Across Southern Europe, elevated merchant service fees restrain adoption, but fiscal mandates and the 2025 Italian POS-register integration requirement should gradually bring micro-merchants into the digital fold, supporting incremental gains.
Regulatory Landscape
Europe mobile payments operate under a tightening EU framework that links open access, strong authentication, and instant settlement. Regulation (EU) 2022/1925 (Digital Markets Act) restricts gatekeepers from forcing exclusive use of their own payment services and supports open, non-discriminatory access to device NFC, reinforcing multi-wallet competition for proximity payments in the EEA. In parallel, the EU Instant Payments Regulation requires instant euro credit transfers by 9 January 2025 and instant sending by 9 October 2025, accelerating account-to-account mobile payment use cases alongside card and wallet rails.
Rules for payment institutions and e-money are also being modernized through the PSD3 and Payment Services Regulation (PSR) package. In May 2026, the European Parliament ECON committee approved the interinstitutional negotiated text for PSD3/PSR, pointing to progress toward more unified authorization, clearer liability and fraud provisions, and updated requirements for mobile and online payment services. On the digital euro track, the European Central Bank (ECB) advanced front-end and scheme specifications for mobile and online acceptance, including NFC support and biometric or PIN-based authentication, while aligning with existing European standards bodies to limit fragmentation for PSPs and merchants.
Value Chain Analysis
The Europe mobile payments value chain starts with funding sources (cards, SEPA credit transfers, and SEPA Instant), then moves through issuing banks and wallet providers such as Apple Pay, Google Pay, Samsung Pay, PayPal, and bank-led wallets including Wero into merchant acceptance. Acquirers and processors (including Worldline, Adyen, Nexi and other PSPs) connect merchants and platforms to schemes and bank rails, supported by tokenization, risk and fraud systems, identity and authentication (SCA), and device capabilities such as NFC and SoftPOS. For person-to-person and pay-by-bank use cases, overlay services and standards (for example EPC scheme rulebooks and API specifications) govern interoperability and clearing behavior across participating PSPs.
Regulatory and standards milestones are reshaping integration work across the chain. The European Payments Council published the 2025 SCT Inst rulebook v1.1 in October 2025, aligning scheme requirements with Regulation (EU) 2024/886 and pushing PSP readiness for instant euro transfers, along with upgrades in fraud checks, reconciliation, and exception handling. In 2026, the ECB progressed the digital euro ecosystem by publishing a digital euro rulebook (v0.91) and selecting 36 PSPs for a pilot exercise scheduled to begin in the second half of 2027, encouraging earlier investments in acceptance devices, wallet UX, and interoperability with existing SEPA-based rails.
Competitive Landscape
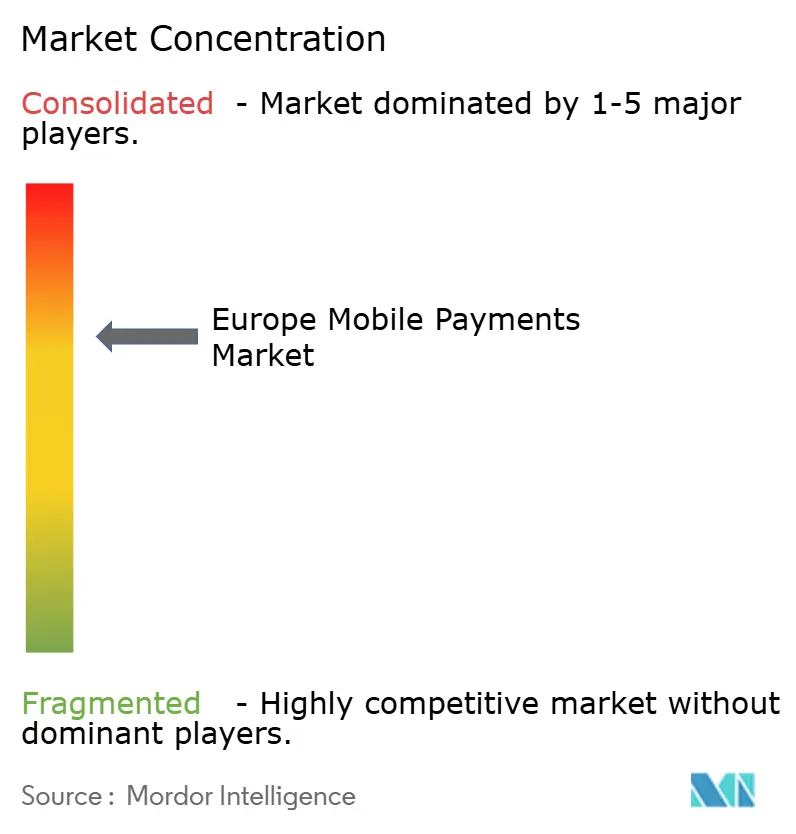
Europe’s mobile payments arena shows moderate concentration. The top five acquirers process over 70% of regional volume, warranting a market concentration score of 7. Worldline leads with EUR 4.632 billion (USD 5.1 billion) 2024 revenue, yet organic growth slowed to 0.5% as emerging rivals undercut pricing. Merchant Services forms 72% of its income, prompting the firm to invest in data-rich fraud management with Visa Acceptance Solutions to defend margins. Adyen posted 23% net revenue growth to EUR 2 billion (USD 2.2 billion) by leveraging a single global platform and superior approval optimisation. Its strategic agenda focuses on enterprise in-app experiences and unified commerce, capturing share from legacy processors.
Apple generated EUR 24.92 billion (USD 27.4 billion) European revenue in Q4 2024, driven by services such as Apple Pay. The EU-brokered opening of iPhone NFC to third parties is a strategic shift that reduces Apple’s moat and enables challengers such as Samsung Pay and Curve to innovate on-device acceptance. Klarna returned to profitability with SEK 216 million (USD 23.8 million) Q3 2024 net income and is pushing into shopping loyalty and personal finance, extending beyond pure BNPL to deepen ecosystem stickiness. Emerging disruptors include Stripe, which processed USD 1.4 trillion global volume in 2024 and is investing in European licenses to localise settlement, and FAIRTIQ, which applies distance-based fare optimisation to transit payments. Regulatory scrutiny on foreign scheme dominance may favour European processors, while open-banking wallets gain momentum as cost-effective alternatives.
Europe Mobile Payments Industry Leaders
Google LLC (Google Pay)
Apple Inc. (Apple Pay)
Amazon.com, Inc. (Amazon Pay)
PayPal Holdings, Inc.
Samsung Electronics Co., Ltd. (Samsung Pay)
- *Disclaimer: Major Players sorted in no particular order

Market Opportunities and Future Outlook
Account-to-account mobile payments and interoperable wallet schemes create whitespace for merchants seeking alternatives to traditional card economics, particularly in remote checkout and other high-frequency use cases. The instant payments regulatory deadlines (receive by 9 January 2025 and send by 9 October 2025 in the euro area) support pay-by-bank at the point of need, while domestic and bank-led wallet schemes can extend beyond P2P into in-store and e-commerce acceptance. European Payments Initiative expansion provides a concrete example of this direction: Wero launched e-commerce payments in Belgium with merchants such as Ahold Delhaize, Lidl, and Bpost (March 2026), and later launched in Luxembourg across P2P, QR-code in-store, and e-commerce payments (June 2026), accelerating merchant onboarding pathways on SEPA-based rails.
Platform openness and standardization work also broaden the opportunity set for new wallet entrants, acquirers, and enabling technologies. The Digital Markets Act constraints on gatekeepers, together with the ECB signing agreements in April 2026 with ECPC, nexo standards and the Berlin Group to leverage existing open standards for future digital euro online and contactless payments, points to a more standardized acceptance environment across devices and terminals. At the same time, PSD3/PSR progress in May 2026 (ECON committee approval of the negotiated text) supports cross-border product expansion for licensed PSPs through clearer rules for mobile and online services, enabling more consistent rollout of tokenized checkout, SCA optimization, and merchant-integrated wallet and pay-by-bank options across European markets.
Recent Industry Developments
- July 2026: PayPal joined the European Payments Council (EPC). The move links PayPal more directly to European scheme rulemaking and SEPA infrastructure discussions, supporting deeper alignment with regional standards that shape pay-by-bank and instant payment experiences.
- June 2026: PayPal partnered with PPRO to add 30+ local payment methods to its platform, including Swish (Sweden), MB WAY (Portugal), and BLIK Pay Later (Poland). This expands PayPal-enabled mobile checkout localization for European merchants and strengthens coverage in markets where domestic methods drive conversion.
- March 2025: Apple expanded Tap to Pay on iPhone to nine additional European countries, working with acquirers such as Nexi and Adyen. Wider iPhone-based acceptance reduces entry friction for micro-merchants and supports faster rollout of contactless mobile payments without dedicated POS hardware.


Research Methodology Framework and Report Scope
Market Definition and Coverage
For this study, the Europe mobile payments market is defined as the value of payments completed using a mobile device at checkout or within an in-app or browser flow, including proximity and remote mobile payments across European countries.
Scope exclusions: We exclude card or bank transfers that are initiated without a mobile device, along with pure back-end processing fees that do not reflect the payment value.
Segmentation Overview
- By Payment Type
- Proximity Payments
- Remote Payments
- By Transaction Type
- Peer-to-Peer (P2P)
- In-store Point-of-Sale (POS)
- Person-to-Merchant (P2M/Checkout)
- Other Transaction Types
- By Application
- Retail and eCommerce
- Transportation and Logistics
- Hospitality and Food-Service
- Government and Public Sector
- Other Applications (Education, Healthcare)
- By End-user
- Personal
- Business
- By Country
- United Kingdom
- Germany
- France
- Italy
- Spain
- Netherlands
- Rest of Europe
Data Sources, Market Sizing, and Validation
Desk Research
Desk research was used to set the base demand pool and to keep the model tied to observable payments activity in Europe. We referenced public sources such as the European Central Bank payments statistics, the European Commission and PSD2 related publications, national central bank releases, and Eurostat indicators that help explain consumer spend patterns and digital behavior.
To translate those signals into a workable sizing structure, we also reviewed materials like annual reports and investor decks from relevant ecosystem participants, reputable payments press, and association updates (such as card and payments industry bodies). In addition, our analysts used paid subscriptions for company financials and intelligence, as well as news and financials, to cross-check reported trends and timeline events that could shift volumes. The sources listed here are illustrative, and many other public documents and datasets were also consulted to collect data, validate assumptions, and clarify unclear points.
Primary Interviews and Surveys
Primary interviews and short surveys were used to pressure-test desk assumptions that are hard to observe directly, especially around wallet usage mix, merchant acceptance progress, and how remote payments behave versus proximity payments. We spoke with stakeholders across issuers, acquirers, payment facilitators, merchants, and ecosystem enablers, and we ensured coverage across major European markets plus smaller countries where adoption patterns can differ.
Distribution of primary research fieldwork respondents
| Company type | Respondent position | Region |
|---|---|---|
| Top tier: 28% | CXOs: 18% | |
| Mid tier: 54% | Functional/Unit leaders: 23% | |
| Smaller Players: 18% | Managers: 59% |
Market-Sizing & Forecasting
Market sizing was built using a top-down and bottom-up logic, but it is anchored in a demand-pool reconstruction approach for Europe, where payments statistics and adoption indicators are translated into mobile-initiated transaction value. We start from payment activity and digital commerce signals, and then we apply mobile payment penetration by mode (proximity versus remote) to estimate the share that is realistically initiated via mobile devices.
To keep the totals realistic, selective bottom-up checks were then used, such as sampled merchant and category level adoption inputs, wallet and device enablement trends, and sense checks on implied average ticket sizes by use case (for example, transit and quick service versus higher value retail). When a bottom-up input was missing for a country, we filled the gap using nearest-market proxies based on similar regulatory environment, contactless maturity, and smartphone usage, and those assumptions were subsequently rechecked through interviews.
Forecasting was run using scenario analysis supported by a small set of drivers that can be tracked each year. Key inputs included smartphone and contactless capable device penetration, merchant acceptance progression, e-commerce share of retail spend, instant payment and account-to-account adoption signals, and the pace of regulatory and scheme changes that influence customer onboarding. For years with unusual volatility, a conservative, base, and accelerated scenario set was used, and final values were aligned to the consensus view heard from market participants.
Data Validation & Update Cycle
Validation was done through multiple checks, so that one data series does not drive the final result. We compared modeled totals against independent signals such as published payment transaction value trends, country level adoption benchmarks, and step changes visible in major policy or infrastructure announcements, and then outliers were investigated before numbers were finalized.
A second analyst review is performed to confirm that assumptions are consistent across countries and that currency conversion and inflation handling do not distort trends. If a large variance shows up versus a prior edition or a key external signal, respondents are re-contacted to confirm what changed and when it changed. Reports are refreshed annually, with interim updates for material events, and a final pre-delivery review is completed so clients receive the latest adjusted view.
Mordor Intelligence's Europe Mobile Payments Market Size Compared With Other Published Estimates
Published market sizes for Europe mobile payments often vary because the underlying definitions are not consistent, and that makes even the same year look different across sources. Differences usually come from what is counted as mobile payment value, whether proximity and remote are both included, and how cross-border or wallet funded transactions are treated.
Some published figures lean toward a broader concept that can blend in wider digital payments or general wallet spending even when a mobile device is not the true initiator. In Mordor Intelligence modeling, the value is counted only when the payment is initiated via a mobile device in either proximity or remote mode, and adjacent non-mobile digital payment value is kept out so totals do not get inflated by overlap.
Benchmark comparison
| Source | Market Size | Gaps in Research Methodology |
|---|---|---|
| Mordor Intelligence | USD 136.45 B (2025) | |
| Trade Journal A | USD 1342.50 B (2025) | Often reported as mobile payment industry value that can include broader digital wallet payment value across channels, which may mix in non-mobile initiated transactions and create double counting versus a mobile-initiated definition. |
| Press Release B | USD 291.47 B (2028) | Typically presented as a single-point forecast with limited clarity on proximity versus remote splits, currency timing, and whether the figure reflects transaction value, revenue, or a blended payments scope. |
The spread across the table is mainly explained by scope and counting logic rather than a disagreement on growth direction. When device initiation, payment mode, and country coverage are defined clearly and then cross-checked with adoption and payments statistics, the resulting market size becomes easier to reproduce and to use for planning.


Key Questions Answered in the Report
What is the projected size of the Europe mobile payments market by 2031?
The market is forecast to reach USD 587.95 billion by 2031, reflecting a 27.55% CAGR between 2026 and 2031.
Which payment channel is growing fastest in Europe?
Remote mobile payments are expanding at a 30.48% CAGR as eCommerce, tokenisation, and pay-by-bank rails proliferate.
Why is Spain the fastest-growing geography?
Bizum’s wallet expansion, NFC retail rollout, and supportive digitalisation funding drive Spain’s 30.60% CAGR outlook.
How are European regulations shaping instant payments?
The EU Instant Payments Regulation mandates sub-10-second settlement and payee verification for all euro accounts by October 2025, accelerating account-to-account mobile payment adoption.
What strategic moves are incumbents making to stay competitive?
Worldline is partnering with Visa on data-driven fraud tools, Adyen is scaling unified commerce capabilities, and Apple is enabling Tap to Pay to widen merchant acceptance without extra hardware.
How are transport operators contributing to mobile payment growth?
Networks such as France’s Tisséo and Germany’s FAIRTIQ adopt open-loop contactless ticketing, embedding high-frequency mobile wallet usage into daily commutes.
Page last updated on:






