
| Study Period | 2017 - 2029 |
| Base Year For Estimation | 2024 |
| Forecast Data Period | 2025 - 2029 |
| Market Size (2025) | USD 97.85 Billion |
| Market Size (2029) | USD 132.5 Billion |
| CAGR (2025 - 2029) | 7.87 % |
| Market Concentration | Medium |
Major Players*Disclaimer: Major Players sorted in no particular order |


Europe Light Commercial Vehicles Market Analysis
The Europe Light Commercial Vehicles Market size is estimated at 97.85 billion USD in 2025, and is expected to reach 132.5 billion USD by 2029, growing at a CAGR of 7.87% during the forecast period (2025-2029).
The European light commercial vehicles market demonstrated remarkable resilience in 2022, achieving a robust 6.2% growth in sales volume despite challenging macroeconomic conditions. This growth trajectory reflects the sector's fundamental strength and its critical role in supporting various industries across the region. The market's performance has been particularly notable in supporting the expansion of urban logistics networks and facilitating the growing demands of the e-commerce sector. Infrastructure development projects across Europe have further catalyzed market growth, with the construction and utilities sectors emerging as key demand drivers for commercial vehicles.
The industry landscape is experiencing a significant transformation driven by changing business models and operational requirements. The expansion of last-mile delivery networks has emerged as a crucial factor reshaping the LCV market dynamics, with logistics companies and retailers adapting their fleets to meet evolving consumer expectations. This shift has been particularly evident in urban areas, where the demand for efficient and versatile commercial vehicles has intensified. The market has responded with innovations in vehicle design and functionality, focusing on improving cargo capacity and maneuverability for urban operations.
Regional economic variations have significantly influenced market performance across Europe, with different countries experiencing distinct growth patterns. Germany's market demonstrated exceptional resilience with a 6.3% growth in 2022, while other major markets like France, Italy, and Spain faced moderate declines ranging from 3% to 5%. These variations reflect the diverse economic conditions and industrial policies across European nations, with some markets showing stronger recovery potential than others. The industry's response to these regional differences has included tailored product offerings and market-specific strategies.
The market is witnessing a fundamental shift in product development and industry focus, with sustainability becoming a core consideration in fleet decisions. Major manufacturers are accelerating their product development cycles to meet evolving market demands, particularly in urban areas where environmental regulations are becoming increasingly stringent. This transformation is evident in the industry's investment patterns, with significant resources being directed toward developing more efficient and environmentally compatible vehicles. The sector's adaptation to these changes while maintaining operational efficiency demonstrates its agility and commitment to sustainable growth.
Europe Light Commercial Vehicles Market Trends
Environmental concerns, government support, and decarbonization goals fuel European electric vehicle demand and sales
- The demand and sales of electric vehicles in European countries have grown significantly over the past few years. Germany witnessed a growth in the sales of electric cars by 22% in 2022 over 2021, followed by the United Kingdom with an 18.40% increase in 2022 over 2021. Growing environmental concerns, stringent governmental norms, advantages of electric vehicles such as fuel efficiency, low service cost, no carbon emissions, and subsidies by the government are some of the factors contributing to the growth of electric vehicles in European countries.
- The demand for electric commercial vehicles, especially light trucks, is growing gradually in European countries. Moreover, the governments of various countries are also supporting the adoption of electric vehicles. In November 2021, the government of the United Kingdom announced a pledge that all heavy-duty vehicles would be zero-emission by the year 2040. Such factors have increased the sales of electric commercial vehicles in the United Kingdom by 23.17% in 2022 over 2021, and similar practices in various countries are enhancing the demand for electric commercial vehicles across Europe.
- It is projected that the electrification of vehicles in European countries is expected to grow tremendously in the next few years. The efforts of the governments in the regions for decarbonization are expected to drive the electric commercial vehicle market in Europe. For instance, in January 2022, the transport minister of Germany announced a goal to put 15 million electric vehicles on the road by 2030. Such factors are expected to increase the sales of electric vehicles during the 2024-2030 period in European countries.

Understand The Key Trends Shaping This Market
Download PDF
OTHER KEY INDUSTRY TRENDS COVERED IN THE REPORT
- Several European countries are facing population declines, while others are growing, indicating a need for targeted policy interventions
- European countries are experiencing growth in CVP, driven by government incentives for eco-friendly vehicles
- The general trend indicates a decline or stabilization in rates, influenced by economic factors and monetary policies
- Declining battery prices and government initiatives drive demand for electric vehicles in Europe
- Europe's advanced logistics, driven by the EU's open trade policies, has faced challenges like Brexit. With a focus on sustainability and technology in 2023, Europe was expected to remain a global logistics leader, poised for further innovation and adaptation
- Within the European truck manufacturing sector, Belgium, Spain, and the UK have witnessed positive growth trajectories. In contrast, Italy and Russia are grappling with hurdles. As the industry looks ahead, the impetus on sustainability is set to define its future. Notably, each country is charting its course, balancing distinctive challenges and potential
- Europe's GDP per capita is on track for steady growth, reflecting resilience and strategic policies
- Europe is poised for economic stability, with concerted efforts to manage inflation and foster a balanced economic landscape
- Europe is demonstrating a robust commitment to enhancing its EV infrastructure, with significant growth in both slow and fast-charging stations
- Electrification in Europe drives the increase in regional battery pack demand
- Since February 2023, diesel imports from the Middle East, Asia, and North America have increased due to the ban on imports from Russia
Segment Analysis: Vehicle Type
Light Commercial Pick-up Trucks Segment in Europe Light Commercial Vehicles Market
Light Commercial Pick-up Trucks dominate the European light commercial vehicles market, commanding approximately 76% market share in 2024. This dominance is driven by their versatility and widespread adoption across various industries. The segment's prominence is attributed to the increasing demand from construction, agriculture, and logistics sectors, where these vehicles excel in both urban and rural environments. The segment is also experiencing the fastest growth trajectory, projected to expand at around 8% annually from 2024 to 2029, fueled by infrastructure development projects and the boom in last-mile delivery services. Growth is further supported by manufacturers introducing advanced features and improved fuel efficiency in their pickup truck models, making them more attractive to both commercial and private users. Additionally, the segment's growth is bolstered by the rising trend of pickup trucks being used as dual-purpose vehicles, serving both business and personal needs, particularly in regions with developing infrastructure and expanding urbanization.
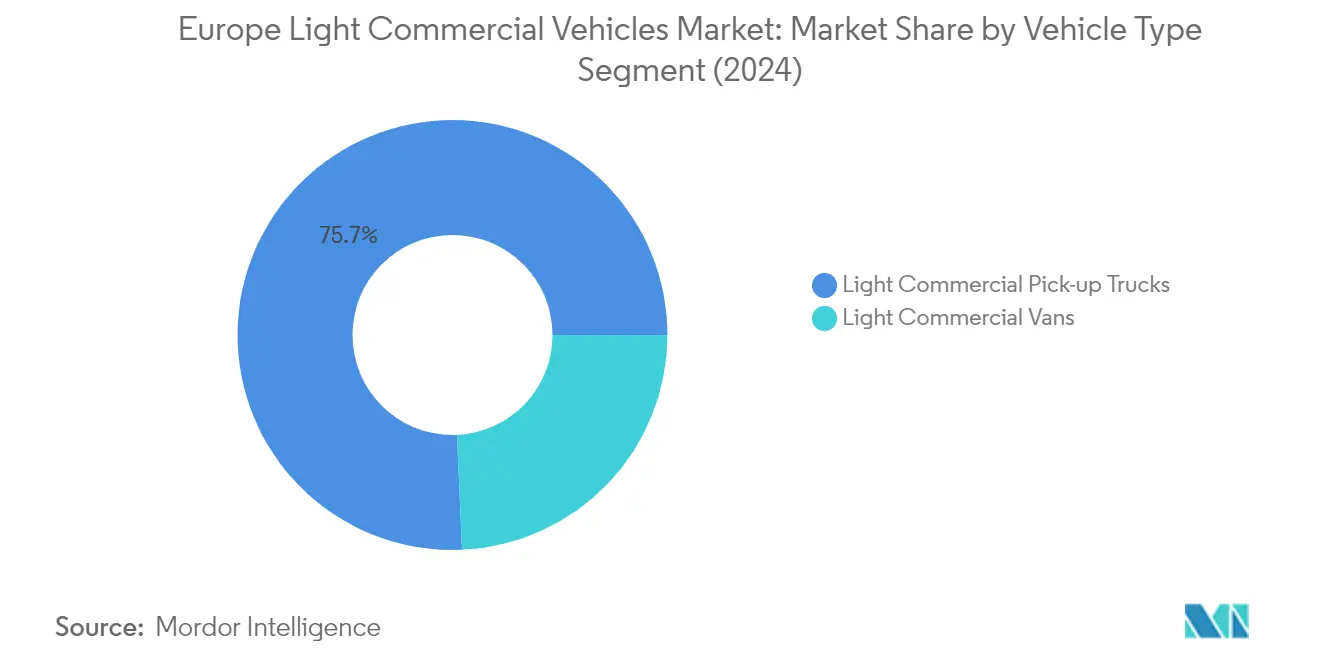
Light Commercial Vans Segment in Europe Light Commercial Vehicles Market
Light Commercial Vans represent a crucial segment in the European light commercial vehicles market, playing a vital role in urban logistics and small-scale transportation needs. These vehicles are particularly favored in densely populated urban areas where their compact size and maneuverability offer significant advantages. The segment's appeal is enhanced by the growing e-commerce sector and the increasing demand for last-mile delivery solutions, especially in metropolitan areas. Manufacturers are responding to market demands by introducing more fuel-efficient and environmentally friendly van models, including electric variants, which is helping to sustain the segment's growth. The versatility of light commercial vans in various applications, from courier services to mobile workshops, continues to drive their adoption across different business sectors. Furthermore, the segment is benefiting from technological advancements in vehicle connectivity and safety features, making these vehicles more attractive to businesses focusing on operational efficiency and driver comfort.
Segment Analysis: Propulsion Type
ICE Segment in Europe Light Commercial Vehicles Market
Internal Combustion Engine (ICE) vehicles continue to dominate the European light commercial vehicles market, commanding approximately 89% market share in 2024. This dominance is primarily attributed to the established infrastructure, lower upfront costs, and proven reliability of ICE vehicles in commercial applications. Diesel engines remain the preferred choice within this segment, particularly for long-haul transportation and heavy-duty applications, due to their superior fuel efficiency and torque characteristics. The segment's strength is further reinforced by the extensive service network, readily available spare parts, and the familiarity of fleet operators with ICE technology. Additionally, in regions with less developed charging infrastructure, ICE vehicles continue to offer practical advantages for commercial operations.
FCEV Segment in Europe Light Commercial Vehicles Market
The Fuel Cell Electric Vehicle (FCEV) segment is emerging as the fastest-growing propulsion type in the European light commercial vehicles market, with a projected growth rate of approximately 25% during 2024-2029. This remarkable growth is driven by increasing investments in hydrogen infrastructure, advancements in fuel cell technology, and growing recognition of FCEVs' potential for zero-emission commercial transportation. The segment's expansion is supported by various European initiatives promoting hydrogen mobility, particularly in heavy-duty applications where battery electric vehicles face range and payload limitations. Major automotive manufacturers are increasingly investing in FCEV technology, launching new models and forming strategic partnerships to accelerate the development and commercialization of fuel cell commercial vehicles.
Remaining Segments in Propulsion Type
The remaining propulsion segments in the European light commercial vehicles market include Battery Electric Vehicles (BEV), Hybrid Electric Vehicles (HEV), and Plug-in Hybrid Electric Vehicles (PHEV). These segments are gaining traction due to increasing environmental regulations and urban access restrictions. BEVs are particularly popular in urban delivery applications, while HEVs and PHEVs serve as transitional technologies, offering reduced emissions while maintaining operational flexibility. The growth of these segments is supported by expanding charging infrastructure, government incentives, and increasing model availability from major manufacturers. Each of these technologies addresses specific market needs, from last-mile delivery to regional distribution, contributing to the overall electrification of commercial transport.
Europe Light Commercial Vehicles Market Geography Segment Analysis
Europe Light Commercial Vehicles Market in France
France continues to dominate the European Light Commercial Vehicles Market landscape, commanding approximately 25% of the total market value in 2024. The country's robust industrial sector, coupled with its strategic position as a logistics hub, has cemented its leadership in the LCV market. The French government's commitment to sustainable transportation solutions has fostered an environment conducive to market growth, particularly in urban areas where last-mile delivery demands are escalating. The country's strong focus on innovation and technology adoption in the commercial vehicle sector has attracted significant investments from major manufacturers. Additionally, France's comprehensive network of charging infrastructure has facilitated the transition to electric LCVs, particularly in metropolitan regions. The growth is further supported by the country's robust construction sector and expanding e-commerce industry, which continue to drive demand for versatile commercial vehicles. The market's resilience is reinforced by strong government support through incentives and regulations that promote the adoption of cleaner transportation solutions.
Europe Light Commercial Vehicles Market in Sweden
Sweden has emerged as the most dynamic market in the European LCV sector, projected to achieve a remarkable growth rate of approximately 11% annually from 2024 to 2029. The country's progressive approach to sustainable transportation has created a fertile ground for LCV market expansion, particularly in the electric vehicle segment. Sweden's commitment to environmental sustainability is reflected in its comprehensive infrastructure development and supportive policy framework for commercial vehicle electrification. The nation's robust manufacturing sector, combined with its emphasis on technological innovation, has attracted significant investments in the LCV space. The country's unique geographical challenges have spurred demand for versatile commercial vehicles capable of operating efficiently in diverse conditions. Furthermore, Sweden's strong focus on urban logistics solutions and last-mile delivery optimization has created new opportunities for LCV manufacturers. The market's growth is also supported by the country's well-developed charging infrastructure and strong government incentives for sustainable transportation solutions.
Europe Light Commercial Vehicles Market in United Kingdom
The United Kingdom maintains its position as a crucial market for light commercial vehicles in Europe, driven by its robust e-commerce sector and evolving urban logistics requirements. The country's comprehensive approach to sustainable transportation has fostered an environment conducive to LCV market development, particularly in the electric vehicle segment. British businesses are increasingly adopting innovative logistics solutions, driving demand for versatile commercial vehicles. The market's resilience is underpinned by strong infrastructure development and supportive government policies promoting cleaner transportation alternatives. The UK's focus on urban mobility solutions and last-mile delivery optimization has created new opportunities for LCV manufacturers and operators. Additionally, the country's commitment to reducing urban emissions has accelerated the adoption of alternative fuel vehicles in the commercial sector. The market continues to benefit from technological advancements and the increasing integration of smart features in commercial vehicles.
Europe Light Commercial Vehicles Market in Germany
Germany's light commercial vehicles market continues to demonstrate remarkable resilience, supported by its strong manufacturing base and sophisticated logistics infrastructure. The country's commitment to technological innovation has positioned it as a key player in the development and adoption of advanced LCV solutions. German businesses are increasingly embracing sustainable transportation options, particularly in urban areas where environmental regulations are becoming more stringent. The market benefits from Germany's robust network of charging infrastructure and comprehensive support system for commercial vehicle operators. The country's emphasis on quality and efficiency in logistics operations has driven consistent demand for advanced commercial vehicles. Furthermore, Germany's strong focus on research and development has led to significant innovations in vehicle technology and operational efficiency. The market's stability is reinforced by strong institutional support and a well-developed ecosystem of suppliers and service providers.
Europe Light Commercial Vehicles Market in Other Countries
The remaining European countries, including Austria, Belgium, Czech Republic, Denmark, Estonia, Ireland, Italy, Latvia, Lithuania, Norway, Poland, Russia, and Spain, collectively represent a diverse and dynamic segment of the light commercial vehicle market. These markets are characterized by varying levels of technological adoption and infrastructure development, each influenced by unique regional factors and economic conditions. The Nordic countries generally demonstrate strong adoption of electric LCVs, while Eastern European markets show increasing demand for conventional commercial vehicles. Southern European countries are experiencing a gradual transition toward sustainable transportation solutions, influenced by EU regulations and local environmental policies. These markets benefit from shared European regulations while maintaining distinct characteristics based on their local economic conditions and infrastructure development levels. The collective growth in these regions is driven by increasing urbanization, expanding e-commerce sectors, and growing awareness of sustainable transportation solutions.
Get Analysis on Important Geographic Markets
Download PDF
Europe Light Commercial Vehicles Industry Overview
Top Companies in Europe Light Commercial Vehicles Market
The European light commercial vehicles market is witnessing significant product innovation trends, with major players focusing on electric and hybrid vehicle development to meet sustainability goals. Companies are demonstrating operational agility through flexible manufacturing processes and rapid response to market demands, particularly in the post-pandemic environment. Strategic moves in the industry are predominantly centered around partnerships for technological advancement, especially in electric drivetrain development and autonomous driving capabilities. Market leaders are expanding their presence through both organic growth and strategic acquisitions, with a particular focus on strengthening their positions in key markets like France, Germany, and the UK. The industry is seeing substantial investments in research and development, with companies prioritizing the development of connected vehicle technologies and advanced safety features to maintain a competitive advantage.
Consolidated Market Led By Global Players
The European light commercial vehicles market is highly consolidated, with major global automotive conglomerates dominating the landscape. Companies like Ford, Renault, Fiat Chrysler, Peugeot, and Volkswagen hold significant market positions through their established brand presence and extensive distribution networks. These players leverage their global manufacturing capabilities and economies of scale to maintain competitive pricing while investing in innovative technologies. The market also features specialized players focusing on specific segments such as electric vans or luxury commercial vehicles, though their market share remains relatively small compared to the major manufacturers.
The industry has witnessed several strategic mergers and acquisitions, reflecting the trend toward consolidation and the need for technological collaboration. Notable examples include the merger between PSA Group and Fiat Chrysler to form Stellantis, demonstrating the industry's move toward creating stronger entities capable of meeting future challenges. Companies are also forming strategic partnerships with technology firms and startups to accelerate innovation in areas like electrification, connectivity, and autonomous driving capabilities, indicating a shift toward collaborative growth strategies rather than traditional competitive approaches.
Innovation and Sustainability Drive Future Success
For incumbent players to maintain and increase their market share, focus on electric vehicle technology and sustainable manufacturing practices has become crucial. Companies are investing heavily in developing advanced powertrains, improving battery technology, and expanding charging infrastructure. Success in the LCV market increasingly depends on the ability to offer comprehensive fleet solutions, including maintenance services, telematics, and fleet management software. Market leaders are also strengthening their after-sales networks and developing digital platforms to enhance customer experience and loyalty.
Contenders looking to gain ground in the LCV market are focusing on niche segments and innovative business models. This includes specializing in specific vehicle categories, targeting underserved markets, or offering unique value propositions such as flexible leasing options or specialized modifications for specific industries. The regulatory environment, particularly regarding emissions standards and urban access restrictions, is reshaping competitive dynamics and creating opportunities for new entrants with innovative clean technology solutions. Success in this evolving landscape requires agility in adapting to changing customer preferences, particularly regarding sustainability and digital integration, while maintaining cost competitiveness through efficient operations and strategic partnerships.
Europe Light Commercial Vehicles Market Leaders
-
Fiat Chrysler Automobiles N.V
-
Ford Motor Company
-
Groupe Renault
-
Peugeot S.A.
-
Volkswagen AG
- *Disclaimer: Major Players sorted in no particular order

Need More Details on Market Players and Competiters?
Download PDF
Europe Light Commercial Vehicles Market News
- June 2023: Mercedes-Benz extended the availability of its DRIVE PILOT system to California, marking a significant milestone. Furthermore, it is introducing a SAE Level 3 system, a first in a standard-production vehicle, for use on public freeways in the state.
- June 2023: FORD NEXT launches New pilot program creates flexible electric solutions for drivers who use the Uber platform in select U.S. markets, allowing them to lease a vehicle for more customized time periods.
- May 2023: Mercedes Benz Vans is set to introduce its new electric small van, the eCitan, designed specifically for inner-city deliveries and servicing. The eCitan comes in two size variants: a compact version measuring 4498 mm and a larger one at 5922 mm.
Free With This Report
For the Vehicle Hub report, we provide an extensive collection of over 150 free charts, delivering detailed insights on regional and country-level dynamics within the vehicle industry. This encompasses in-depth analyses of vehicle registrations, usage patterns in both consumer and business segments, and evaluations of various vehicle configurations and body types. The report delves into critical industrial trends such as shifts in vehicle production and distribution centers, changes in vehicle ownership costs, and advancements in automotive technologies. Further, our report offers comprehensive market segmentation by vehicle type, body type, propulsion, and fuel categories, providing a nuanced understanding of the market landscape. It also explores the adoption rate of new technologies, the impact of regulatory changes, and the influence of economic factors on the vehicle market. We include a thorough examination of key industry players, regulatory frameworks, and market size in terms of both revenue and unit sales, leading to strategic projections and forecasts that account for emerging trends and potential shifts in the industry.


Europe Light Commercial Vehicles Market Report - Table of Contents
1. EXECUTIVE SUMMARY & KEY FINDINGS
2. REPORT OFFERS
3. INTRODUCTION
- 3.1 Study Assumptions & Market Definition
- 3.2 Scope of the Study
- 3.3 Research Methodology
4. KEY INDUSTRY TRENDS
- 4.1 Population
- 4.2 GDP Per Capita
- 4.3 Consumer Spending For Vehicle Purchase (cvp)
- 4.4 Inflation
- 4.5 Interest Rate For Auto Loans
- 4.6 Impact Of Electrification
- 4.7 EV Charging Station
- 4.8 Battery Pack Price
- 4.9 New Xev Models Announced
- 4.10 Logistics Performance Index
- 4.11 Fuel Price
- 4.12 Oem-wise Production Statistics
- 4.13 Regulatory Framework
- 4.14 Value Chain & Distribution Channel Analysis
5. MARKET SEGMENTATION (includes market size in Value in USD and Volume, Forecasts up to 2029 and analysis of growth prospects)
-
5.1 Vehicle Type
- 5.1.1 Commercial Vehicles
- 5.1.1.1 Light Commercial Pick-up Trucks
- 5.1.1.2 Light Commercial Vans
-
5.2 Propulsion Type
- 5.2.1 Hybrid and Electric Vehicles
- 5.2.1.1 By Fuel Category
- 5.2.1.1.1 BEV
- 5.2.1.1.2 FCEV
- 5.2.1.1.3 HEV
- 5.2.1.1.4 PHEV
- 5.2.2 ICE
- 5.2.2.1 By Fuel Category
- 5.2.2.1.1 CNG
- 5.2.2.1.2 Diesel
- 5.2.2.1.3 Gasoline
- 5.2.2.1.4 LPG
-
5.3 Country
- 5.3.1 Austria
- 5.3.2 Belgium
- 5.3.3 Czech Republic
- 5.3.4 Denmark
- 5.3.5 Estonia
- 5.3.6 France
- 5.3.7 Germany
- 5.3.8 Ireland
- 5.3.9 Italy
- 5.3.10 Latvia
- 5.3.11 Lithuania
- 5.3.12 Norway
- 5.3.13 Poland
- 5.3.14 Russia
- 5.3.15 Spain
- 5.3.16 Sweden
- 5.3.17 UK
- 5.3.18 Rest-of-Europe
6. COMPETITIVE LANDSCAPE
- 6.1 Key Strategic Moves
- 6.2 Market Share Analysis
- 6.3 Company Landscape
-
6.4 Company Profiles
- 6.4.1 Fiat Chrysler Automobiles N.V
- 6.4.2 Ford Motor Company
- 6.4.3 Groupe Renault
- 6.4.4 Mercedes-Benz
- 6.4.5 Peugeot S.A.
- 6.4.6 Toyota Motor Corporation
- 6.4.7 Volkswagen AG
- *List Not Exhaustive
7. KEY STRATEGIC QUESTIONS FOR VEHICLES CEOS
8. APPENDIX
-
8.1 Global Overview
- 8.1.1 Overview
- 8.1.2 Porter’s Five Forces Framework
- 8.1.3 Global Value Chain Analysis
- 8.1.4 Market Dynamics (DROs)
- 8.2 Sources & References
- 8.3 List of Tables & Figures
- 8.4 Primary Insights
- 8.5 Data Pack
- 8.6 Glossary of Terms
You Can Purchase Parts Of This Report. Check Out Prices For Specific Sections
Get Price Break-up Now
List of Tables & Figures
- Figure 1:
- POPULATION TRENDS, VOLUME IN UNITS, EUROPE, 2017 - 2030
- Figure 2:
- GDP PER CAPITA AT CURRENT PRICES, VALUE IN USD, EUROPE, 2017 - 2030
- Figure 3:
- AVERAGE CONSUMER SPENDING PER CAPITA ON PURCHASE OF VEHICLES, VALUE IN USD, EUROPE, 2017 - 2030
- Figure 4:
- INFLATION RATE AT AVERAGE CONSUMER PRICES, PERCENTAGE CHANGE, EUROPE, 2017 - 2030
- Figure 5:
- AUTO LOAN INTEREST RATES, PERCENTAGE, EUROPE, 2017 - 2022
- Figure 6:
- ELECTRIC VEHICLE MARKET PENETRATION RATE, BY VEHICLE TYPE, PERCENTAGE OF VOLUME, EUROPE, 2017 - 2030
- Figure 7:
- CHARGING STATION DEPLOYMENT, BY TYPE, VOLUME IN UNITS, EUROPE, 2017 - 2022
- Figure 8:
- AVERAGE LITHIUM-ION BATTERY PACK PRICE, VALUE IN USD, EUROPE, 2017 - 2030
- Figure 9:
- ANNOUNCEMENT OF NEW XEV MODELS, BY VEHICLE TYPE, VOLUME IN UNITS, EUROPE, 2023 - 2027
- Figure 10:
- WORLD BANK LOGISTICS PERFORMANCE INDEX, EUROPE, 2017 - 2030
- Figure 11:
- FUEL PRICE, BY FUEL TYPE, USD/LITER, EUROPE, 2017 - 2022
- Figure 12:
- OEM-WISE PRODUCTION STATISTICS, VOLUME IN UNITS, EUROPE, 2017 - 2022
- Figure 13:
- EUROPE LIGHT COMMERCIAL VEHICLES MARKET, VOLUME IN UNITS, 2017 - 2030
- Figure 14:
- EUROPE LIGHT COMMERCIAL VEHICLES MARKET, VALUE IN USD, 2017 - 2030
- Figure 15:
- EUROPE LIGHT COMMERCIAL VEHICLES MARKET, BY VEHICLE BODY TYPE, BY VOLUME IN UNITS, 2017 - 2030
- Figure 16:
- EUROPE LIGHT COMMERCIAL VEHICLES MARKET, BY VEHICLE BODY TYPE, BY VALUE IN USD, 2017 - 2030
- Figure 17:
- EUROPE LIGHT COMMERCIAL VEHICLES MARKET MARKET, SHARE(%), BY VEHICLE BODY TYPE, 2017 - 2030
- Figure 18:
- EUROPE LIGHT COMMERCIAL VEHICLES MARKET MARKET, SHARE(%), BY VEHICLE BODY TYPE, 2017 - 2030
- Figure 19:
- EUROPE LIGHT COMMERCIAL VEHICLES MARKET, BY LIGHT COMMERCIAL PICK-UP TRUCKS, BY VOLUME IN UNITS, 2017 - 2030
- Figure 20:
- EUROPE LIGHT COMMERCIAL VEHICLES MARKET, BY LIGHT COMMERCIAL PICK-UP TRUCKS, BY VALUE IN USD, 2017 - 2030
- Figure 21:
- EUROPE LIGHT COMMERCIAL VEHICLES MARKET MARKET, SHARE(%), BY COUNTRY, 2017 - 2030
- Figure 22:
- EUROPE LIGHT COMMERCIAL VEHICLES MARKET, BY LIGHT COMMERCIAL VANS, BY VOLUME IN UNITS, 2017 - 2030
- Figure 23:
- EUROPE LIGHT COMMERCIAL VEHICLES MARKET, BY LIGHT COMMERCIAL VANS, BY VALUE IN USD, 2017 - 2030
- Figure 24:
- EUROPE LIGHT COMMERCIAL VEHICLES MARKET MARKET, SHARE(%), BY COUNTRY, 2017 - 2030
- Figure 25:
- EUROPE LIGHT COMMERCIAL VEHICLES MARKET, BY PROPULSION TYPE, BY VOLUME IN UNITS, 2017 - 2030
- Figure 26:
- EUROPE LIGHT COMMERCIAL VEHICLES MARKET, BY PROPULSION TYPE, BY VALUE IN USD, 2017 - 2030
- Figure 27:
- EUROPE LIGHT COMMERCIAL VEHICLES MARKET MARKET, SHARE(%), BY PROPULSION TYPE, 2017 - 2030
- Figure 28:
- EUROPE LIGHT COMMERCIAL VEHICLES MARKET MARKET, SHARE(%), BY PROPULSION TYPE, 2017 - 2030
- Figure 29:
- EUROPE LIGHT COMMERCIAL VEHICLES MARKET, BY FUEL CATEGORY, BY VOLUME IN UNITS, 2017 - 2030
- Figure 30:
- EUROPE LIGHT COMMERCIAL VEHICLES MARKET, BY FUEL CATEGORY, BY VALUE IN USD, 2017 - 2030
- Figure 31:
- EUROPE LIGHT COMMERCIAL VEHICLES MARKET MARKET, SHARE(%), BY FUEL CATEGORY, 2017 - 2030
- Figure 32:
- EUROPE LIGHT COMMERCIAL VEHICLES MARKET MARKET, SHARE(%), BY FUEL CATEGORY, 2017 - 2030
- Figure 33:
- EUROPE LIGHT COMMERCIAL VEHICLES MARKET, BY BEV, BY VOLUME IN UNITS, 2017 - 2030
- Figure 34:
- EUROPE LIGHT COMMERCIAL VEHICLES MARKET, BY BEV, BY VALUE IN USD, 2017 - 2030
- Figure 35:
- EUROPE LIGHT COMMERCIAL VEHICLES MARKET MARKET, SHARE(%), BY FUEL CATEGORY, 2017 - 2030
- Figure 36:
- EUROPE LIGHT COMMERCIAL VEHICLES MARKET, BY FCEV, BY VOLUME IN UNITS, 2017 - 2030
- Figure 37:
- EUROPE LIGHT COMMERCIAL VEHICLES MARKET, BY FCEV, BY VALUE IN USD, 2017 - 2030
- Figure 38:
- EUROPE LIGHT COMMERCIAL VEHICLES MARKET MARKET, SHARE(%), BY FUEL CATEGORY, 2017 - 2030
- Figure 39:
- EUROPE LIGHT COMMERCIAL VEHICLES MARKET, BY HEV, BY VOLUME IN UNITS, 2017 - 2030
- Figure 40:
- EUROPE LIGHT COMMERCIAL VEHICLES MARKET, BY HEV, BY VALUE IN USD, 2017 - 2030
- Figure 41:
- EUROPE LIGHT COMMERCIAL VEHICLES MARKET MARKET, SHARE(%), BY FUEL CATEGORY, 2017 - 2030
- Figure 42:
- EUROPE LIGHT COMMERCIAL VEHICLES MARKET, BY PHEV, BY VOLUME IN UNITS, 2017 - 2030
- Figure 43:
- EUROPE LIGHT COMMERCIAL VEHICLES MARKET, BY PHEV, BY VALUE IN USD, 2017 - 2030
- Figure 44:
- EUROPE LIGHT COMMERCIAL VEHICLES MARKET MARKET, SHARE(%), BY FUEL CATEGORY, 2017 - 2030
- Figure 45:
- EUROPE LIGHT COMMERCIAL VEHICLES MARKET, BY FUEL CATEGORY, BY VOLUME IN UNITS, 2017 - 2030
- Figure 46:
- EUROPE LIGHT COMMERCIAL VEHICLES MARKET, BY FUEL CATEGORY, BY VALUE IN USD, 2017 - 2030
- Figure 47:
- EUROPE LIGHT COMMERCIAL VEHICLES MARKET MARKET, SHARE(%), BY FUEL CATEGORY, 2017 - 2030
- Figure 48:
- EUROPE LIGHT COMMERCIAL VEHICLES MARKET MARKET, SHARE(%), BY FUEL CATEGORY, 2017 - 2030
- Figure 49:
- EUROPE LIGHT COMMERCIAL VEHICLES MARKET, BY CNG, BY VOLUME IN UNITS, 2017 - 2030
- Figure 50:
- EUROPE LIGHT COMMERCIAL VEHICLES MARKET, BY CNG, BY VALUE IN USD, 2017 - 2030
- Figure 51:
- EUROPE LIGHT COMMERCIAL VEHICLES MARKET MARKET, SHARE(%), BY FUEL CATEGORY, 2017 - 2030
- Figure 52:
- EUROPE LIGHT COMMERCIAL VEHICLES MARKET, BY DIESEL, BY VOLUME IN UNITS, 2017 - 2030
- Figure 53:
- EUROPE LIGHT COMMERCIAL VEHICLES MARKET, BY DIESEL, BY VALUE IN USD, 2017 - 2030
- Figure 54:
- EUROPE LIGHT COMMERCIAL VEHICLES MARKET MARKET, SHARE(%), BY FUEL CATEGORY, 2017 - 2030
- Figure 55:
- EUROPE LIGHT COMMERCIAL VEHICLES MARKET, BY GASOLINE, BY VOLUME IN UNITS, 2017 - 2030
- Figure 56:
- EUROPE LIGHT COMMERCIAL VEHICLES MARKET, BY GASOLINE, BY VALUE IN USD, 2017 - 2030
- Figure 57:
- EUROPE LIGHT COMMERCIAL VEHICLES MARKET MARKET, SHARE(%), BY FUEL CATEGORY, 2017 - 2030
- Figure 58:
- EUROPE LIGHT COMMERCIAL VEHICLES MARKET, BY LPG, BY VOLUME IN UNITS, 2017 - 2030
- Figure 59:
- EUROPE LIGHT COMMERCIAL VEHICLES MARKET, BY LPG, BY VALUE IN USD, 2017 - 2030
- Figure 60:
- EUROPE LIGHT COMMERCIAL VEHICLES MARKET MARKET, SHARE(%), BY FUEL CATEGORY, 2017 - 2030
- Figure 61:
- EUROPE LIGHT COMMERCIAL VEHICLES MARKET, BY COUNTRY, BY VOLUME IN UNITS, 2017 - 2030
- Figure 62:
- EUROPE LIGHT COMMERCIAL VEHICLES MARKET, BY COUNTRY, BY VALUE IN USD, 2017 - 2030
- Figure 63:
- EUROPE LIGHT COMMERCIAL VEHICLES MARKET MARKET, SHARE(%), BY COUNTRY, 2017 - 2030
- Figure 64:
- EUROPE LIGHT COMMERCIAL VEHICLES MARKET MARKET, SHARE(%), BY COUNTRY, 2017 - 2030
- Figure 65:
- EUROPE LIGHT COMMERCIAL VEHICLES MARKET, BY AUSTRIA, BY VOLUME IN UNITS, 2017 - 2030
- Figure 66:
- EUROPE LIGHT COMMERCIAL VEHICLES MARKET, BY AUSTRIA, BY VALUE IN USD, 2017 - 2030
- Figure 67:
- EUROPE LIGHT COMMERCIAL VEHICLES MARKET MARKET, SHARE(%), BY PROPULSION TYPE, 2017 - 2030
- Figure 68:
- EUROPE LIGHT COMMERCIAL VEHICLES MARKET, BY BELGIUM, BY VOLUME IN UNITS, 2017 - 2030
- Figure 69:
- EUROPE LIGHT COMMERCIAL VEHICLES MARKET, BY BELGIUM, BY VALUE IN USD, 2017 - 2030
- Figure 70:
- EUROPE LIGHT COMMERCIAL VEHICLES MARKET MARKET, SHARE(%), BY PROPULSION TYPE, 2017 - 2030
- Figure 71:
- EUROPE LIGHT COMMERCIAL VEHICLES MARKET, BY CZECH REPUBLIC, BY VOLUME IN UNITS, 2017 - 2030
- Figure 72:
- EUROPE LIGHT COMMERCIAL VEHICLES MARKET, BY CZECH REPUBLIC, BY VALUE IN USD, 2017 - 2030
- Figure 73:
- EUROPE LIGHT COMMERCIAL VEHICLES MARKET MARKET, SHARE(%), BY PROPULSION TYPE, 2017 - 2030
- Figure 74:
- EUROPE LIGHT COMMERCIAL VEHICLES MARKET, BY DENMARK, BY VOLUME IN UNITS, 2017 - 2030
- Figure 75:
- EUROPE LIGHT COMMERCIAL VEHICLES MARKET, BY DENMARK, BY VALUE IN USD, 2017 - 2030
- Figure 76:
- EUROPE LIGHT COMMERCIAL VEHICLES MARKET MARKET, SHARE(%), BY PROPULSION TYPE, 2017 - 2030
- Figure 77:
- EUROPE LIGHT COMMERCIAL VEHICLES MARKET, BY ESTONIA, BY VOLUME IN UNITS, 2017 - 2030
- Figure 78:
- EUROPE LIGHT COMMERCIAL VEHICLES MARKET, BY ESTONIA, BY VALUE IN USD, 2017 - 2030
- Figure 79:
- EUROPE LIGHT COMMERCIAL VEHICLES MARKET MARKET, SHARE(%), BY PROPULSION TYPE, 2017 - 2030
- Figure 80:
- EUROPE LIGHT COMMERCIAL VEHICLES MARKET, BY FRANCE, BY VOLUME IN UNITS, 2017 - 2030
- Figure 81:
- EUROPE LIGHT COMMERCIAL VEHICLES MARKET, BY FRANCE, BY VALUE IN USD, 2017 - 2030
- Figure 82:
- EUROPE LIGHT COMMERCIAL VEHICLES MARKET MARKET, SHARE(%), BY PROPULSION TYPE, 2017 - 2030
- Figure 83:
- EUROPE LIGHT COMMERCIAL VEHICLES MARKET, BY GERMANY, BY VOLUME IN UNITS, 2017 - 2030
- Figure 84:
- EUROPE LIGHT COMMERCIAL VEHICLES MARKET, BY GERMANY, BY VALUE IN USD, 2017 - 2030
- Figure 85:
- EUROPE LIGHT COMMERCIAL VEHICLES MARKET MARKET, SHARE(%), BY PROPULSION TYPE, 2017 - 2030
- Figure 86:
- EUROPE LIGHT COMMERCIAL VEHICLES MARKET, BY IRELAND, BY VOLUME IN UNITS, 2017 - 2030
- Figure 87:
- EUROPE LIGHT COMMERCIAL VEHICLES MARKET, BY IRELAND, BY VALUE IN USD, 2017 - 2030
- Figure 88:
- EUROPE LIGHT COMMERCIAL VEHICLES MARKET MARKET, SHARE(%), BY PROPULSION TYPE, 2017 - 2030
- Figure 89:
- EUROPE LIGHT COMMERCIAL VEHICLES MARKET, BY ITALY, BY VOLUME IN UNITS, 2017 - 2030
- Figure 90:
- EUROPE LIGHT COMMERCIAL VEHICLES MARKET, BY ITALY, BY VALUE IN USD, 2017 - 2030
- Figure 91:
- EUROPE LIGHT COMMERCIAL VEHICLES MARKET MARKET, SHARE(%), BY PROPULSION TYPE, 2017 - 2030
- Figure 92:
- EUROPE LIGHT COMMERCIAL VEHICLES MARKET, BY LATVIA, BY VOLUME IN UNITS, 2017 - 2030
- Figure 93:
- EUROPE LIGHT COMMERCIAL VEHICLES MARKET, BY LATVIA, BY VALUE IN USD, 2017 - 2030
- Figure 94:
- EUROPE LIGHT COMMERCIAL VEHICLES MARKET MARKET, SHARE(%), BY PROPULSION TYPE, 2017 - 2030
- Figure 95:
- EUROPE LIGHT COMMERCIAL VEHICLES MARKET, BY LITHUANIA, BY VOLUME IN UNITS, 2017 - 2030
- Figure 96:
- EUROPE LIGHT COMMERCIAL VEHICLES MARKET, BY LITHUANIA, BY VALUE IN USD, 2017 - 2030
- Figure 97:
- EUROPE LIGHT COMMERCIAL VEHICLES MARKET MARKET, SHARE(%), BY PROPULSION TYPE, 2017 - 2030
- Figure 98:
- EUROPE LIGHT COMMERCIAL VEHICLES MARKET, BY NORWAY, BY VOLUME IN UNITS, 2017 - 2030
- Figure 99:
- EUROPE LIGHT COMMERCIAL VEHICLES MARKET, BY NORWAY, BY VALUE IN USD, 2017 - 2030
- Figure 100:
- EUROPE LIGHT COMMERCIAL VEHICLES MARKET MARKET, SHARE(%), BY PROPULSION TYPE, 2017 - 2030
- Figure 101:
- EUROPE LIGHT COMMERCIAL VEHICLES MARKET, BY POLAND, BY VOLUME IN UNITS, 2017 - 2030
- Figure 102:
- EUROPE LIGHT COMMERCIAL VEHICLES MARKET, BY POLAND, BY VALUE IN USD, 2017 - 2030
- Figure 103:
- EUROPE LIGHT COMMERCIAL VEHICLES MARKET MARKET, SHARE(%), BY PROPULSION TYPE, 2017 - 2030
- Figure 104:
- EUROPE LIGHT COMMERCIAL VEHICLES MARKET, BY RUSSIA, BY VOLUME IN UNITS, 2017 - 2030
- Figure 105:
- EUROPE LIGHT COMMERCIAL VEHICLES MARKET, BY RUSSIA, BY VALUE IN USD, 2017 - 2030
- Figure 106:
- EUROPE LIGHT COMMERCIAL VEHICLES MARKET MARKET, SHARE(%), BY PROPULSION TYPE, 2017 - 2030
- Figure 107:
- EUROPE LIGHT COMMERCIAL VEHICLES MARKET, BY SPAIN, BY VOLUME IN UNITS, 2017 - 2030
- Figure 108:
- EUROPE LIGHT COMMERCIAL VEHICLES MARKET, BY SPAIN, BY VALUE IN USD, 2017 - 2030
- Figure 109:
- EUROPE LIGHT COMMERCIAL VEHICLES MARKET MARKET, SHARE(%), BY PROPULSION TYPE, 2017 - 2030
- Figure 110:
- EUROPE LIGHT COMMERCIAL VEHICLES MARKET, BY SWEDEN, BY VOLUME IN UNITS, 2017 - 2030
- Figure 111:
- EUROPE LIGHT COMMERCIAL VEHICLES MARKET, BY SWEDEN, BY VALUE IN USD, 2017 - 2030
- Figure 112:
- EUROPE LIGHT COMMERCIAL VEHICLES MARKET MARKET, SHARE(%), BY PROPULSION TYPE, 2017 - 2030
- Figure 113:
- EUROPE LIGHT COMMERCIAL VEHICLES MARKET, BY UK, BY VOLUME IN UNITS, 2017 - 2030
- Figure 114:
- EUROPE LIGHT COMMERCIAL VEHICLES MARKET, BY UK, BY VALUE IN USD, 2017 - 2030
- Figure 115:
- EUROPE LIGHT COMMERCIAL VEHICLES MARKET MARKET, SHARE(%), BY PROPULSION TYPE, 2017 - 2030
- Figure 116:
- EUROPE LIGHT COMMERCIAL VEHICLES MARKET, BY REST-OF-EUROPE, BY VOLUME IN UNITS, 2017 - 2030
- Figure 117:
- EUROPE LIGHT COMMERCIAL VEHICLES MARKET, BY REST-OF-EUROPE, BY VALUE IN USD, 2017 - 2030
- Figure 118:
- EUROPE LIGHT COMMERCIAL VEHICLES MARKET MARKET, SHARE(%), BY PROPULSION TYPE, 2017 - 2030
- Figure 119:
- EUROPE LIGHT COMMERCIAL VEHICLES MARKET, MOST ACTIVE COMPANIES, BY NUMBER OF STRATEGIC MOVES, 2017 - 2030
- Figure 120:
- EUROPE LIGHT COMMERCIAL VEHICLES MARKET, MOST ADOPTED STRATEGIES, 2017 - 2030
- Figure 121:
- EUROPE LIGHT COMMERCIAL VEHICLES MARKET SHARE(%), BY MAJOR PLAYERS
Europe Light Commercial Vehicles Industry Segmentation
Commercial Vehicles are covered as segments by Vehicle Type. Hybrid and Electric Vehicles, ICE are covered as segments by Propulsion Type. Austria, Belgium, Czech Republic, Denmark, Estonia, France, Germany, Ireland, Italy, Latvia, Lithuania, Norway, Poland, Russia, Spain, Sweden, UK, Rest-of-Europe are covered as segments by Country.| Vehicle Type | Commercial Vehicles | Light Commercial Pick-up Trucks | ||
| Light Commercial Vans | ||||
| Propulsion Type | Hybrid and Electric Vehicles | By Fuel Category | BEV | |
| FCEV | ||||
| HEV | ||||
| PHEV | ||||
| ICE | By Fuel Category | CNG | ||
| Diesel | ||||
| Gasoline | ||||
| LPG | ||||
| Country | Austria | |||
| Belgium | ||||
| Czech Republic | ||||
| Denmark | ||||
| Estonia | ||||
| France | ||||
| Germany | ||||
| Ireland | ||||
| Italy | ||||
| Latvia | ||||
| Lithuania | ||||
| Norway | ||||
| Poland | ||||
| Russia | ||||
| Spain | ||||
| Sweden | ||||
| UK | ||||
| Rest-of-Europe | ||||
Need A Different Region or Segment?
Customize Now
Market Definition
- Vehicle Type - The category covers light commercial vehicle.
- Vehicle Body Type - This includes Light Commercial Pick-up Trucks and Light Commercial Vans.
- Fuel Category - The category includes various fuel types such as Gasoline, Diesel, LPG (Liquefied Petroleum Gas), CNG (Compressed Natural Gas), HEV (Hybrid Electric Vehicles), PHEV (Plug-in Hybrid Electric Vehicles), BEV (Battery Electric Vehicles), and FCEV (Fuel Cell Electric Vehicles)
| Keyword | Definition |
|---|---|
| Electric Vehicle (EV) | A vehicle which uses one or more electric motors for propulsion. Includes cars, buses, and trucks. This term includes all-electric vehicles or battery electric vehicles and plug-in hybrid electric vehicles. |
| BEV | A BEV relies completely on a battery and a motor for propulsion. The battery in the vehicle must be charged by plugging it into an outlet or public charging station. BEVs do not have an ICE and hence are pollution-free. They have a low cost of operation and reduced engine noise as compared to conventional fuel engines. However, they have a shorter range and higher prices than their equivalent gasoline models. |
| PEV | A plug-in electric vehicle is an electric vehicle that can be externally charged and generally includes all-electric vehicles as well as plug-in hybrids. |
| Plug-in Hybrid EV | A vehicle that can be powered either by an ICE or an electric motor. In contrast to normal hybrid EVs, they can be charged externally. |
| Internal combustion engine | An engine in which the burning of fuels occurs in a confined space called a combustion chamber. Usually run with gasoline/petrol or diesel. |
| Hybrid EV | A vehicle powered by an ICE in combination with one or more electric motors that use energy stored in batteries. These are continually recharged with power from the ICE and regenerative braking. |
| Commercial Vehicles | Commercial vehicles are motorized road vehicles designed for transporting people or goods. The category includes light commercial vehicles (LCVs) and medium and heavy-duty vehicles (M&HCV). |
| Passenger Vehicles | Passenger cars are electric motor– or engine-driven vehicles with at least four wheels. These vehicles are used for the transport of passengers and comprise no more than eight seats in addition to the driver’s seat. |
| Light Commercial Vehicles | Commercial vehicles that weigh less than 6,000 lb (Class 1) and in the range of 6,001–10,000 lb (Class 2) are covered under this category. |
| M&HDT | Commercial vehicles that weigh in the range of 10,001–14,000 lb (Class 3), 14,001–16,000 lb (Class 4), 16,001–19,500 lb (Class 5), 19,501–26,000 lb (Class 6), 26,001–33,000 lb (Class 7) and above 33,001 lb (Class 8) are covered under this category. |
| Bus | A mode of transportation that typically refers to a large vehicle designed to carry passengers over long distances. This includes transit bus, school bus, shuttle bus, and trolleybuses. |
| Diesel | It includes vehicles that use diesel as their primary fuel. A diesel engine vehicle have a compression-ignited injection system rather than the spark-ignited system used by most gasoline vehicles. In such vehicles, fuel is injected into the combustion chamber and ignited by the high temperature achieved when gas is greatly compressed. |
| Gasoline | It includes vehicles that use gas/petrol as their primary fuel. A gasoline car typically uses a spark-ignited internal combustion engine. In such vehicles, fuel is injected into either the intake manifold or the combustion chamber, where it is combined with air, and the air/fuel mixture is ignited by the spark from a spark plug. |
| LPG | It includes vehicles that use LPG as their primary fuel. Both dedicated and bi-fuel LPG vehicles are considered under the scope of the study. |
| CNG | It includes vehicles that use CNG as their primary fuel. These are vehicles that operate like gasoline-powered vehicles with spark-ignited internal combustion engines. |
| HEV | All the electric vehicles that use batteries and an internal combustion engine (ICE) as their primary source for propulsion are considered under this category. HEVs generally use a diesel-electric powertrain and are also known as hybrid diesel-electric vehicles. An HEV converts the vehicle momentum (kinetic energy) into electricity that recharges the battery when the vehicle slows down or stops. The battery of HEV cannot be charged using plug-in devices. |
| PHEV | PHEVs are powered by a battery as well as an ICE. The battery can be charged through either regenerative breaking using the ICE or by plugging into some external charging source. PHEVs have a better range than BEVs but are comparatively less eco-friendly. |
| Hatchback | These are compact-sized cars with a hatch-type door provided at the rear end. |
| Sedan | These are usually two- or four-door passenger cars, with a separate area provided at the rear end for luggage. |
| SUV | Popularly known as SUVs, these cars come with four-wheel drive, and usually have high ground clearance. These cars can also be used as off-road vehicles. |
| MPV | These are multi-purpose vehicles (also called minivans) designed to carry a larger number of passengers. They carry between five and seven people and have room for luggage too. They are usually taller than the average family saloon car, to provide greater headroom and ease of access, and they are usually front-wheel drive. |
Need More Details on Market Definition?
Ask a Question
Research Methodology
Mordor Intelligence follows a four-step methodology in all its reports.
- Step-1: Identify Key Variables: To build a robust forecasting methodology, the variables and factors identified in Step-1 are tested against available historical market numbers. Through an iterative process, the variables required for market forecast are set and the model is built based on these variables.
- Step-2: Build a Market Model: Market-size estimations for the historical and forecast years have been provided in revenue and volume terms. Market revenue is calculated by multiplying the sales volume with their respective average selling price (ASP). While estimating ASP factors like average inflation, market demand shift, manufacturing cost, technological advancement, and varying consumer preference, among others have been taken into account.
- Step-3: Validate and Finalize: In this important step, all market numbers, variables, and analyst calls are validated through an extensive network of primary research experts from the market studied. The respondents are selected across levels and functions to generate a holistic picture of the market studied.
- Step-4: Research Outputs: Syndicated Reports, Custom Consulting Assignments, Databases & Subscription Platforms.

Get More Details On Research Methodology
Download PDF


