
Europe Kiwi Fruit Market Analysis by Mordor Intelligence
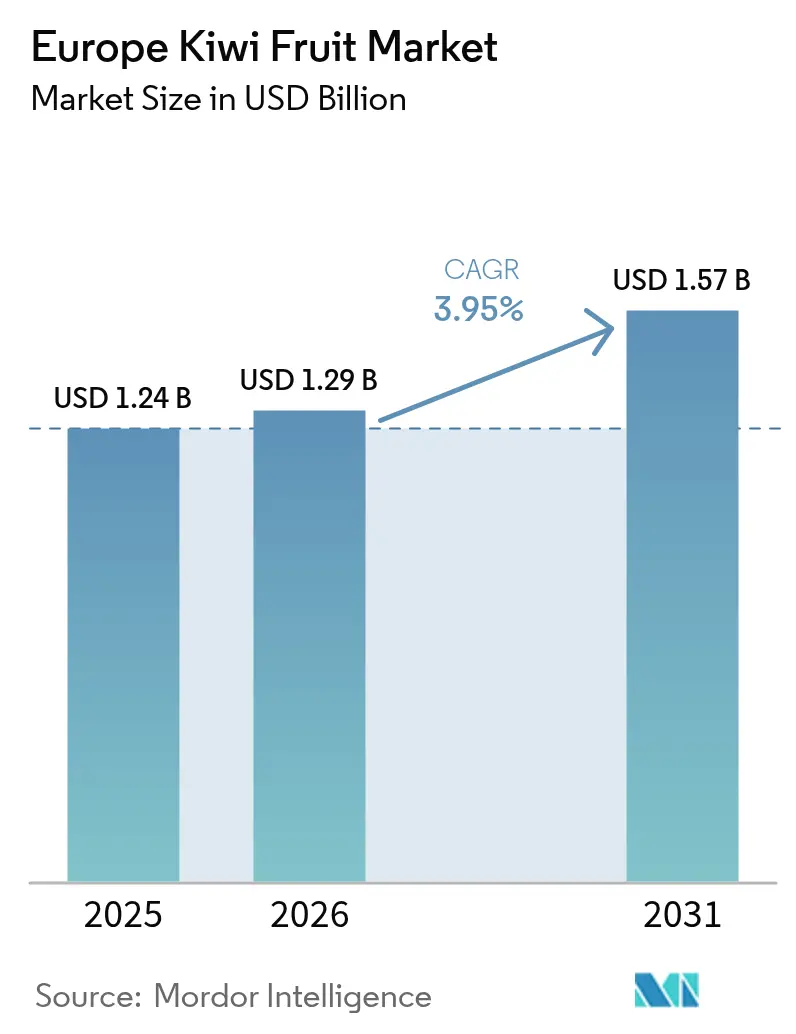
The Europe kiwi fruit market size was valued at USD 1.24 billion in 2025 and estimated to grow from USD 1.29 billion in 2026 to reach USD 1.57 billion by 2031, at a CAGR of 3.95% during the forecast period (2026-2031). The market growth is driven by varietal innovation, traceability systems, and improved controlled-atmosphere storage rather than acreage expansion. The development of sweeter yellow- and red-flesh varieties, supported by European Union research grants for disease-resistant breeding, helps stabilize prices and reduce seasonal supply fluctuations. The market benefits from reduced transportation distances, which lower emissions, support retail sustainability initiatives, and deliver fresher produce to consumers in Germany, France, and the United Kingdom. European growers maintain strong relationships with supermarket chains through their proximity advantages, adherence to phytosanitary standards, and the use of blockchain traceability systems.[1]
Key Report Takeaways
- By geography, Italy led with a 32.10% Europe kiwi fruit market share in 2025, while Spain recorded the swiftest climb with a 4.90% CAGR through 2031.
Note: Market size and forecast figures in this report are generated using Mordor Intelligence’s proprietary estimation framework, updated with the latest available data and insights as of 2026.
Market Trends and Insights
Drivers Impact Analysis of Europe Kiwi Fruit Market*
| Driver | (~) % Impact on CAGR Forecast | Geographic Relevance | Impact Timeline |
|---|---|---|---|
| Farm-to-Fork Traceability Premiums | +0.8% | EU-wide, strongest in Germany and France | Medium term (2-4 years) |
| Expansion of Premium Yellow and Red-flesh Kiwi Varieties | +1.2% | Italy, Spain, Greece with spillover to Northern Europe | Long term (≥ 4 years) |
| European Union-funded Varietal Research and Development Programs | +0.6% | EU member states, concentrated in Italy and Spain | Long term (≥ 4 years) |
| Expansion of Controlled-Atmosphere Storage Capacity | +0.9% | Italy, Spain, Germany distribution hubs | Medium term (2-4 years) |
| Rising Per-capita Fresh-fruit Intake | +0.7% | Northern Europe, UK, Germany, France | Medium term (2-4 years) |
| Post-Brexit Tariff Realignments Boosting Intra-EU Trade | +0.5% | Continental EU, particularly Spain-Germany-France corridors | Short term (≤ 2 years) |
| Source: Mordor Intelligence | |||
Farm-to-Fork Traceability Premiums
Consumer demand for transparent supply chains is transforming procurement practices in Germany and France. Retail audits indicate widespread implementation of QR-enabled origin tracking systems that monitor orchard practices, pesticide usage, and carbon footprints in near real time. Consumers are willing to pay a 15-25% premium for traceable fruit, prompting growers in Italy and Spain to implement orchard-to-checkout blockchain systems for verifying harvest dates and cold-chain compliance. The European Union's farm-to-fork legislation requires enhanced labeling transparency, providing regional producers a competitive advantage over non-EU suppliers. The resulting price premiums enhance grower margins and support continued investment in digital infrastructure. As downstream audit requirements increase, supply chain traceability has evolved from a market differentiator to an essential requirement in the European kiwi fruit market.[2]
Expansion of Premium Yellow and Red-flesh Kiwi Varieties
Golden and red kiwifruit cultivars command 40-60% higher retail prices compared to traditional Hayward varieties. Golden varieties constitute approximately 25% of global kiwifruit volume, but generate a significantly larger share of category revenue due to their enhanced sweetness and attractive coloring. Zespri's SunGold expansion across Europe demonstrates strong consumer demand, which has prompted Italian and Spanish breeding programs to develop cultivars adapted to Mediterranean growing conditions. The adoption of genomic selection and marker-assisted breeding techniques has accelerated cultivar development timelines, enabling European producers to compete with New Zealand's market position. French and German supermarkets have increased premium kiwifruit shelf space by 100% in the past two seasons, indicating that premium varieties will continue to influence retail assortments throughout the forecast period.
Expansion of Controlled-Atmosphere Storage Capacity
Modern modular cold storage facilities with controlled-atmosphere technology extend fruit shelf life up to 12 months. In Italy's Latina province, growers increased storage capacity, reducing post-harvest losses and maintaining consistent export volumes during peak Southern Hemisphere production. Similar storage facilities in Galicia, Spain, help manage seasonal oversupply and stabilize prices by extending marketing periods. The facilities use ethylene removal systems and controlled oxygen levels to maintain nutritional value, enabling retailers to command premium prices through quality-focused labeling. These storage investments increase per-kilogram revenue while providing buffer inventory against supply chain disruptions.
Post-Brexit Tariff Realignments Boosting Intra-EU Trade
British wholesalers have increased fruit sourcing from Spain and Italy to avoid delays related to phytosanitary protocols.[3] Growers have adapted by implementing staggered harvest schedules to meet short-term demand fluctuations, which helps maintain revenue stability in the European kiwi fruit market. This market adjustment has led to increased investment in cold chain infrastructure, improving product shelf-life and reducing waste. European producers have also enhanced their cooperative networks, allowing for better coordination in marketing and faster responses to market demand changes.
Restraints Impact Analysis of Europe Kiwi Fruit Market*
| Restraint | (~) % Impact on CAGR Forecast | Geographic Relevance | Impact Timeline |
|---|---|---|---|
| Bacterial Canker (Psa) Flare-ups | -1.1% | Italy, Spain, Greece with potential EU-wide spread | Short term (≤ 2 years) |
| Labor Shortages During Peak Harvest | -0.8% | Italy, Spain, Southern European growing regions | Medium term (2-4 years) |
| Exchange-rate Volatility | -0.4% | EU exporters, particularly affecting Italy-UK trade | Short term (≤ 2 years) |
| Intensifying Competition from Southern-hemisphere Off-season Supply | -0.9% | EU-wide, strongest impact on premium market segments | Medium term (2-4 years) |
| Source: Mordor Intelligence | |||
Bacterial Canker (Psa) Flare-ups
Pseudomonas syringae pv. actinidiae (Psa) reduces kiwifruit orchard longevity and necessitates replanting cycles. In Italy, Psa outbreaks decreased regional yields and caused growers to increase their integrated pest-management costs by three times in the past five seasons. Research indicates that iron deficiency and water stress intensify disease symptoms, highlighting the importance of proper fertilization and canopy management. While breeding programs are developing resistant varieties, their commercial implementation requires several years, leaving current production vulnerable. Despite early warning systems through coordinated monitoring across Greek and Spanish growing regions, Psa continues to be the primary biological threat affecting the European kiwifruit market.
Labor Shortages During Peak Harvest
Kiwi harvesting continues to be labor-intensive due to the risk of bruising that affects premium fruit quality. In 2024, the availability of migrant workers decreased as seasonal laborers shifted to the construction and logistics sectors. In Italy, pickers earn EUR 5-7 per hour (USD 5.40-7.56), below the mandated EUR 9 hourly rate, indicating profit margin pressures that affect workforce retention. With few automation alternatives available, orchards must either increase wages or accept fruit losses, both impacting profitability. The labor shortage is particularly severe in Spain's new plantations, which lack established local workforce networks, constraining the European kiwi fruit market growth.
*Our forecasts treat driver/restraint impacts as directional, not additive. The impact forecasts reflect baseline growth, mix effects, and variable interactions.
Geography Analysis
Italy Kiwi Fruit Market
Italy's commanding 32.10% of the Europe kiwi market share in 2025 reflects decades of strategic investment in orchard development, regional branding, and export logistics. Italian growers have built a robust distribution network that extends deep into Northern Europe, supported by advanced infrastructure such as controlled-atmosphere storage that prolongs shelf life and stabilizes seasonal supply. Cooperative marketing structures, particularly in the Latina province, enable early-season supermarket contracts and consistent export volumes. Despite this dominance, challenges persist: bacterial canker and labor shortages hinder orchard renewal, prompting a shift toward disease-resistant cultivars and high-density planting models to sustain future competitiveness.
Spain Kiwi Fruit Market
Spain's kiwi sector is undergoing rapid transformation, with a projected CAGR of 4.90% through 2031. This momentum stems from new orchards in Galicia, Asturias, and the Basque Country, where mild Atlantic climates enhance fruit quality and pack-out efficiency. Regional authorities have supported horticultural modernization, implementing precision irrigation and digital climate monitoring. While Spain's market size remains smaller than Italy's, its focus on golden kiwis positions growers to capture premium retail segments, particularly in Germany and the United Kingdom. As new plantings mature, Spain's role in the European kiwi market will expand significantly.
Europe Kiwi Fruit Market
Germany anchors continental demand, with kiwi fruit reaching high household penetration rates and supermarket chains emphasizing sustainability certifications. This preference favors regional producers, even at higher price points. The United Kingdom faces post-Brexit logistical challenges, leading wholesalers to prefer Spanish exporters for faster delivery. France maintains consistent consumption but implements strict residue standards, encouraging procurement from certified European sources and strengthening intra-EU trade dynamics.
Regulatory Landscape
In the European Union, kiwifruit placed on the market is governed by harmonized marketing and quality rules, including maturity requirements for Actinidia chinensis and Actinidia deliciosa (minimum 6.2 Brix or 15% dry matter at packing) and mandatory classification and labeling. These controls run in parallel with plant-health requirements for trade, where imported kiwifruit must meet EU phytosanitary requirements, including phytosanitary certificates for regulated plant products, to demonstrate freedom from quarantine pests.
Food safety compliance is reinforced through pesticide residue controls under Regulation (EC) No 396/2005, with periodic updates to maximum residue limits and scientific opinions guiding changes. In 2026, EFSA published an opinion supporting a modified MRL for deltamethrin in kiwifruit (0.15 mg/kg), and the European Commission updated MRLs via Official Journal publications, increasing the need for dynamic residue-management programs across EU growers and non-EU suppliers. The EU also refreshed its multiannual pesticide control program for 2027-2029, with kiwifruit scheduled for analysis in 2029, keeping residue monitoring and audit-ready compliance documentation central to market access.
Value Chain Analysis
The European kiwi fruit value chain starts with nurseries and licensed plant material, including proprietary yellow and red-flesh cultivars, then moves into orchard production concentrated in Italy, Spain, and Greece. Aggregation through cooperatives and producer organizations follows, with these groups coordinating agronomy protocols, varietal licensing, harvest planning, and commercialization to help fragmented growers meet retailer audit requirements for traceability, residues, and uniform quality specifications.
Post-harvest handling and logistics are key value-add steps, as packhouses grade fruit to EU marketing standards and route volumes into controlled-atmosphere storage to extend shelf life and smooth seasonal supply. Cold-chain nodes in producing regions and Northern European distribution hubs support supermarket programs and cross-border flows, while major brand owners and marketers shape channel access through contracted logistics and retailer-facing quality systems. Recent supply-chain reconfiguration by Zespri, including its planned shift of a key European import logistics hub from the Port of Zeebrugge (Belgium) to Vlissingen (Netherlands), also points to how port selection, inland connectivity, and temperature-controlled infrastructure affect landed cost, service levels, and freshness outcomes.
Market Opportunities and Future Outlook
Premiumization around yellow- and red-flesh kiwifruit remains a strong focus area for European growers and marketer-led consortium models, given the category price ladder versus traditional green Hayward and the retail emphasis on differentiated eating quality. Recent actions support this direction: Zespri approved a structured European expansion plan that allocates new SunGold plantings annually over multiple years, with defined tranches for Italy, France, and Greece, while consortia such as Kiwi Passion continue coordinating protected-variety programs across multiple European producing countries. Together, these developments back a shift toward varietal innovation rather than acreage-only expansion, and they provide a basis for tighter agronomic control, brand consistency, and retailer program execution.
Compliance-led differentiation is another active opportunity for suppliers that can scale traceability, residue discipline, and sustainability documentation. EU marketing standards, including maturity thresholds and labeling rules, combined with evolving MRL requirements, create advantages for producer organizations and integrated exporters that standardize field practices and deliver audit-ready data. Product communication is also broadening beyond origin and class: the European Commission authorization of a health claim for Hayward kiwifruit (Implementing Regulation (EU) 2025/1560, published in 2026) creates room for on-pack claims and retailer education, as long as suppliers align messaging with the approved conditions of use and maintain consistent quality through controlled-atmosphere storage and disciplined cold-chain execution.
Recent Industry Developments in Europe Kiwi Fruit Market
- June 2026: Zespri announced it will end its long-standing import logistics operations at the Port of Zeebrugge, Belgium, and transition its European hub to Vlissingen, Netherlands, with the move planned for completion by 2028. The shift reorganizes Northern Europe inbound flows and can alter service levels and cost-to-serve for importers and retailers relying on Zespri-managed logistics.
- May 2026: Agrintesa advanced a new kiwifruit-oriented facility in Castrovillari, Italy, combining 10,000 tons of refrigeration with packaging capacity of about 180 tons per day, targeting full production in the 2026 season. Added cold-chain and packing throughput support longer marketing windows and higher specification programs for premium grades.
- October 2024: Zespri initiated pre-commercial trials of Italian-grown red kiwifruit (RubyRed) in selected stores in Belgium. Expanding trials for red-flesh fruit strengthens the premium portfolio available to European retailers and encourages local production pathways for proprietary varieties within the region.
Europe Kiwi Fruit Market Report Scope and Research Methodology
Market Definition and Coverage
For this study, the Europe kiwi fruit market is defined as the value of kiwi fruit consumed in Europe, expressed in USD, based on volumes available to the market (local production plus imports minus exports) and the related price realization.
Scope exclusions: This sizing excludes retail and logistics margins and it does not treat processed kiwi products as part of fresh kiwi fruit.
Segments Covered in This Report
- By Geography
- Germany
- Production Analysis (Volume)
- Consumption Analysis (Value and Volume)
- Import Analysis (Value and Volume)
- Export Analysis (Value and Volume)
- Price Trend Analysis
- United Kingdom
- Production Analysis (Volume)
- Consumption Analysis (Value and Volume)
- Import Analysis (Value and Volume)
- Export Analysis (Value and Volume)
- Price Trend Analysis
- France
- Production Analysis (Volume)
- Consumption Analysis (Value and Volume)
- Import Analysis (Value and Volume)
- Export Analysis (Value and Volume)
- Price Trend Analysis
- Spain
- Production Analysis (Volume)
- Consumption Analysis (Value and Volume)
- Import Analysis (Value and Volume)
- Export Analysis (Value and Volume)
- Price Trend Analysis
- Italy
- Production Analysis (Volume)
- Consumption Analysis (Value and Volume)
- Import Analysis (Value and Volume)
- Export Analysis (Value and Volume)
- Price Trend Analysis
- Germany
Data Sources, Market Sizing, and Validation
Desk Research
To set a clean base, we first map the supply and demand picture using public agriculture and trade datasets. Common starting points include Eurostat for production and trade flows, FAOSTAT for longer time series, UN Comtrade for product-level import and export values, and official customs or statistical releases published by European national agencies.
Pricing and market signals are then checked using sources such as wholesale market bulletins, agricultural ministry dashboards, and peer-reviewed produce and post-harvest research that tracks storage life, losses, and quality. We also review company filings, investor presentations, and association websites to understand sourcing seasonality and route-to-market practices, and then we cross-check some assumptions using paid subscriptions for company financials, patent tracking, and shipment-level trade reads where needed. The sources mentioned above are illustrative only, and many other public references were also used for collecting, validating, and clarifying the data points in the model.
Primary Interviews and Surveys
Expert interviews and short surveys were completed with growers, importers, exporters, and produce distributors, along with retail and foodservice buyers who track category movement. Because this is a Europe-wide market, feedback was gathered across the main consuming and trading hubs, so assumptions on seasonality, loss factors, and price realization could be refined and then carried into the final model outputs.
Distribution of primary research fieldwork respondents
| Company type | Respondent position |
|---|---|
| Top tier: 30% | CXOs: 12% |
| Mid tier: 56% | Functional/Unit leaders: 35% |
| Smaller Players: 14% | Managers: 53% |
Market-Sizing & Forecasting
Sizing is built using a top-down approach where production and trade data reconstruct the available consumption pool for Europe, which is then valued using observed wholesale and import price trends. The model uses repeatable inputs such as harvested volume, import dependence by country, re-export intensity through trade hubs, seasonal price spreads, and post-harvest loss and storage assumptions that affect sellable availability.
The total is corroborated with selective bottom-up approximations, mainly sampled price times volume checks for key trading corridors and distributor channel checks on typical pack sizes and price realization. When bottom-up coverage is incomplete, gaps are handled by applying conservative ranges anchored to the closest comparable country patterns, then validating back to trade and price series.
For forecasting, scenario analysis is used because supply is sensitive to crop outcomes and trade timing. Assumptions for yields, planted area changes, and price movement are stress-tested with interview feedback, and then converted into a single base case that stays consistent with the observed relationship between volumes, prices, and net trade position.
Data Validation & Update Cycle
Outputs are checked through multiple steps so results do not drift away from real-world signals. Analysts compare implied consumption and value against independent indicators such as trade balances, price movements, and known seasonality, and then investigate unusual jumps before sign-off.
A second analyst review is used to confirm that assumptions, conversions, and country roll-ups are consistent across the workbook. Reports refresh annually, and interim updates are triggered when a material event changes trade flows or pricing, after which key experts may be re-contacted to confirm the direction of change. Before delivery, we do a final pass to ensure the latest public data releases are reflected.
Mordor Intelligence's Europe Kiwi Fruit Market Size Measured Against Other Published Estimates
Published values for the Europe kiwi fruit market can vary even when they look like they cover the same geography, because the underlying value point in the chain is not always the same. Differences usually come from whether the estimate is closer to import or wholesale values, or closer to a fuller retail value, and from how re-exports through European trade hubs are handled.
Trade flow totals, net import signals, and observed wholesale price ranges are the checks that keep Mordor Intelligence's 2025 value tied to fresh kiwi fruit available for consumption in Europe, rather than a broader retail-priced number. In other publications, the scope can expand through wider country lists, a different price basis, or a longer forecast horizon that implicitly assumes faster price progression.
Benchmark comparison
| Source | Market Size | Gaps in Research Methodology |
|---|---|---|
| Mordor Intelligence | USD 1.24 B (2025) | |
| Regional Consultancy A | USD 1.68 B (2024) | Uses a different base year and appears to apply a broader value basis with limited clarity on whether values reflect wholesale, import, or retail realization, which can lift the total when prices are not normalized. |
| Trade Journal B | USD 2.60 B (2024) | Values are presented using nominal wholesale pricing and can reflect producer and importer revenues, which may also be affected by how re-exports and intra-Europe trade are netted out across hub countries. |
Taken together, the spread in the table is mainly explained by price point selection, treatment of re-exports, and base-year choice. Our approach stays traceable because each country roll-up ties back to volumes available to the market and a clearly stated price logic, which makes the final number easier to reconcile and update when trade or pricing shifts.
Key Questions Answered in the Report
How large is the European kiwi fruit market in 2026?
The market is valued at USD 1.29 billion in 2026 with a 3.95% CAGR projected to 2031.
Which country holds the biggest share of European kiwi production?
Italy leads with 32.10% share, supported by mature orchards and extensive cold-storage capacity.
Why is Spain considered the fastest-growing country?
Spain records a 4.90% CAGR through 2031 thanks to new plantings in Galicia and a focus on premium golden cultivars.
How does the EU-New Zealand trade deal affect European producers?
The tariff elimination intensifies competition by allowing more New Zealand fruit into EU markets, pushing European growers to raise quality and traceability standards.
Which varieties command the highest retail prices?
Yellow-flesh and red-flesh kiwis earn 40-60% higher prices than traditional green Hayward due to sweeter flavor and vibrant appearance.