
Europe Intralogistics Automation Market Size and Share
Market Overview
| Study Period | 2020 - 2031 |
|---|---|
| Forecast Data Period | 2026 - 2031 |
| Base Year Market Size (2025) | USD 6.84 Billion |
| Market Size (2026) | USD 7.72 Billion |
| Market Size (2031) | USD 12.89 Billion |
| Growth Rate (2026 - 2031) | 10.79% CAGR |
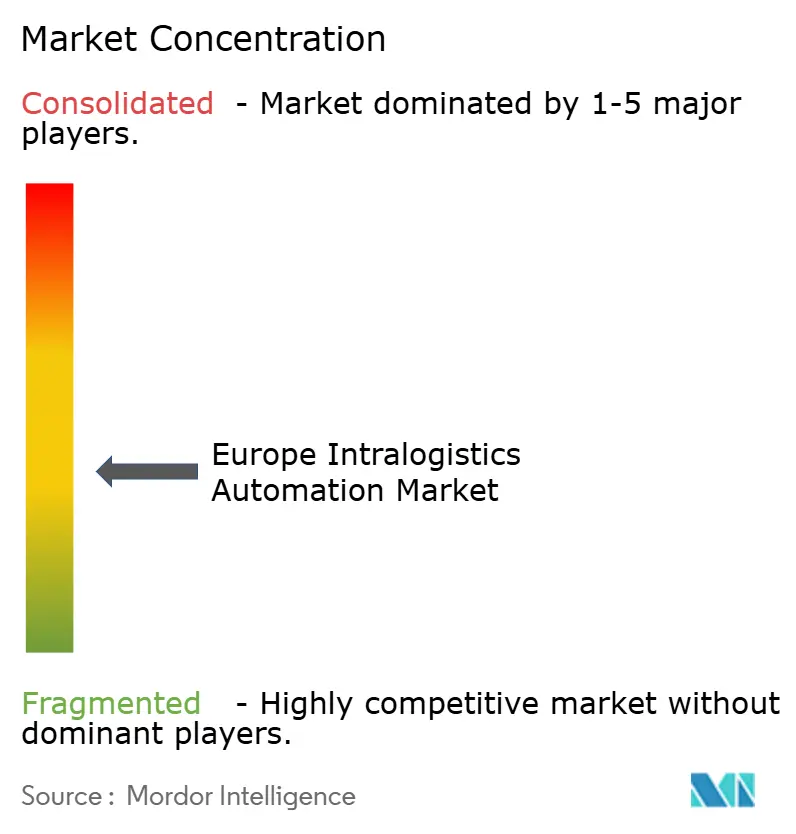
| Market Concentration | Medium |
Major Players *Disclaimer: Major Players sorted in no particular order Image © Mordor Intelligence. Reuse requires attribution under CC BY 4.0. | |
Europe Intralogistics Automation Market Analysis by Mordor Intelligence
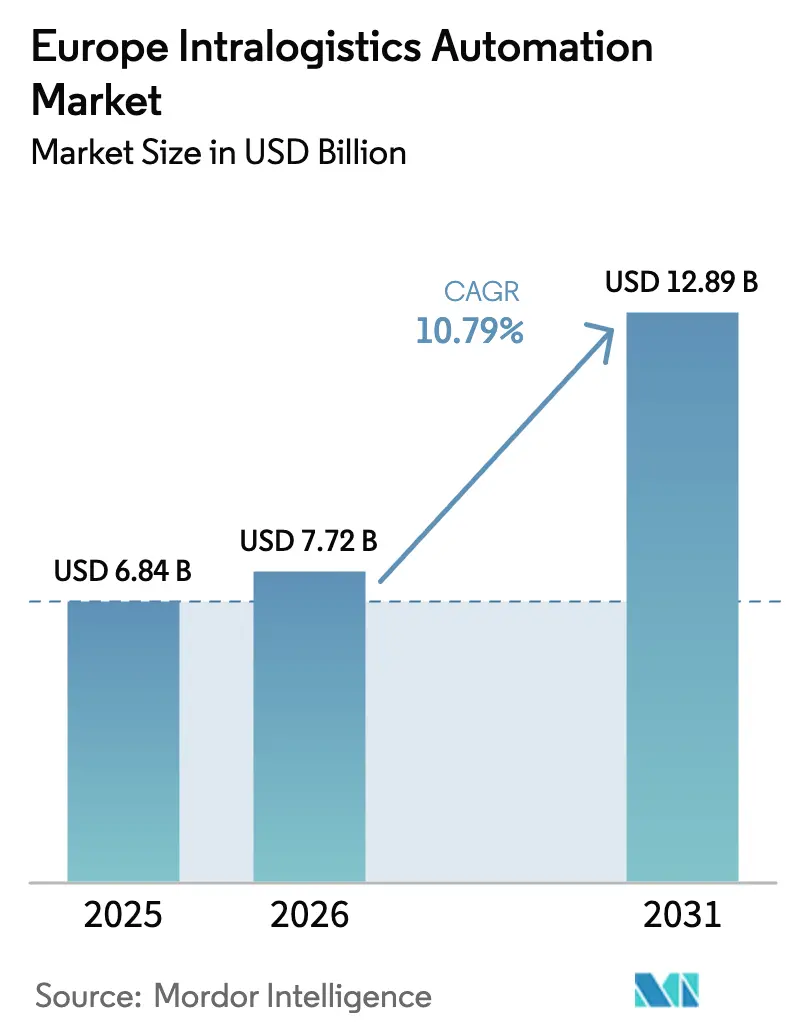
The Europe Intralogistics Automation Market size is expected to increase from USD 6.84 billion in 2025 to USD 7.72 billion in 2026 and reach USD 12.89 billion by 2031, growing at a CAGR of 10.79% over 2026-2031. E-commerce fulfillment pressures are accelerating “lights-out” warehouse projects, while wage inflation and an aging labor pool are shortening the payback horizons for flexible automation. Rapid gains in AI-enabled mobile robots, the maturation of VDA 5050 interoperability, and private-5G deployments are lowering technical risk and unlocking multi-vendor integration. Green-deal incentives channel public funding toward energy-efficient systems that regenerate braking energy and couple with on-site renewables, further boosting the Europe intralogistics automation market. Competitive dynamics center on software-driven differentiation, with incumbents integrating digital twins and predictive analytics to defend aftermarket revenue, while disruptors attack with subscription-priced robot fleets.
Key Report Takeaways
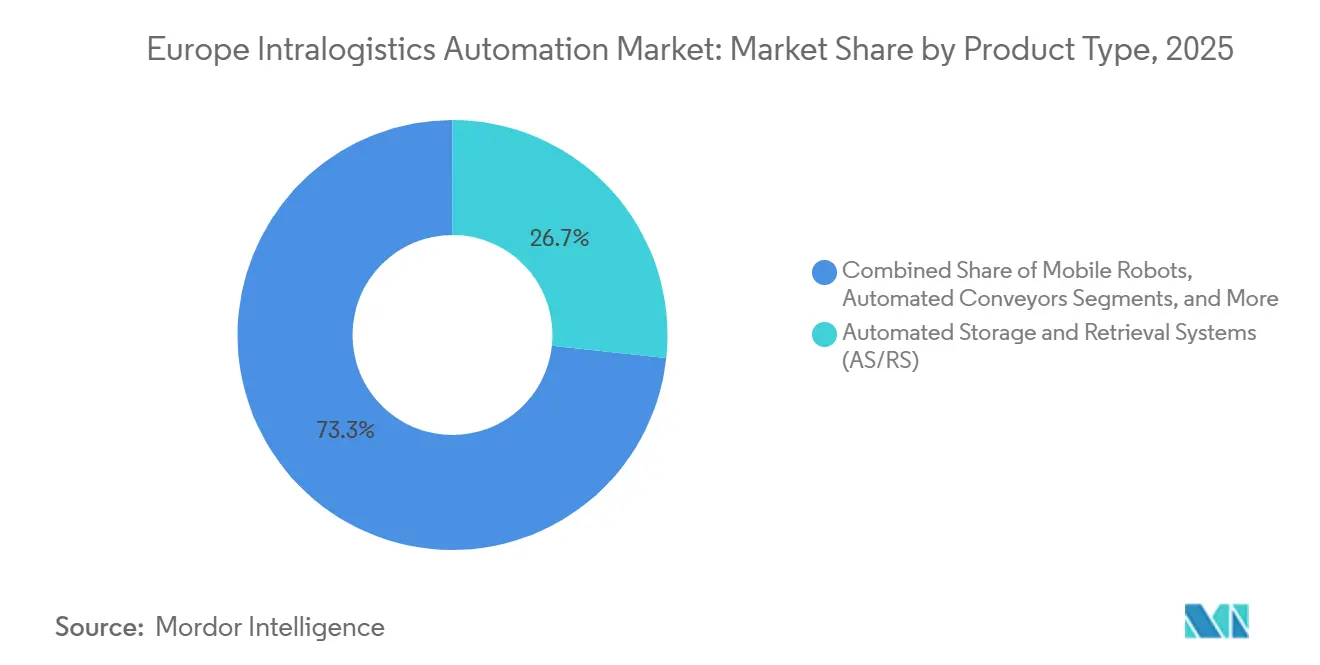
- By product type, automated storage and retrieval systems commanded 26.71% of Europe intralogistics automation market share in 2025, while mobile robots are projected to advance at an 11.91% CAGR through 2031.
- By end-user industry, retail, warehousing, and distribution led with 29.43% revenue share in 2025, while the sector is forecast to expand at a 12.02% CAGR to 2031.
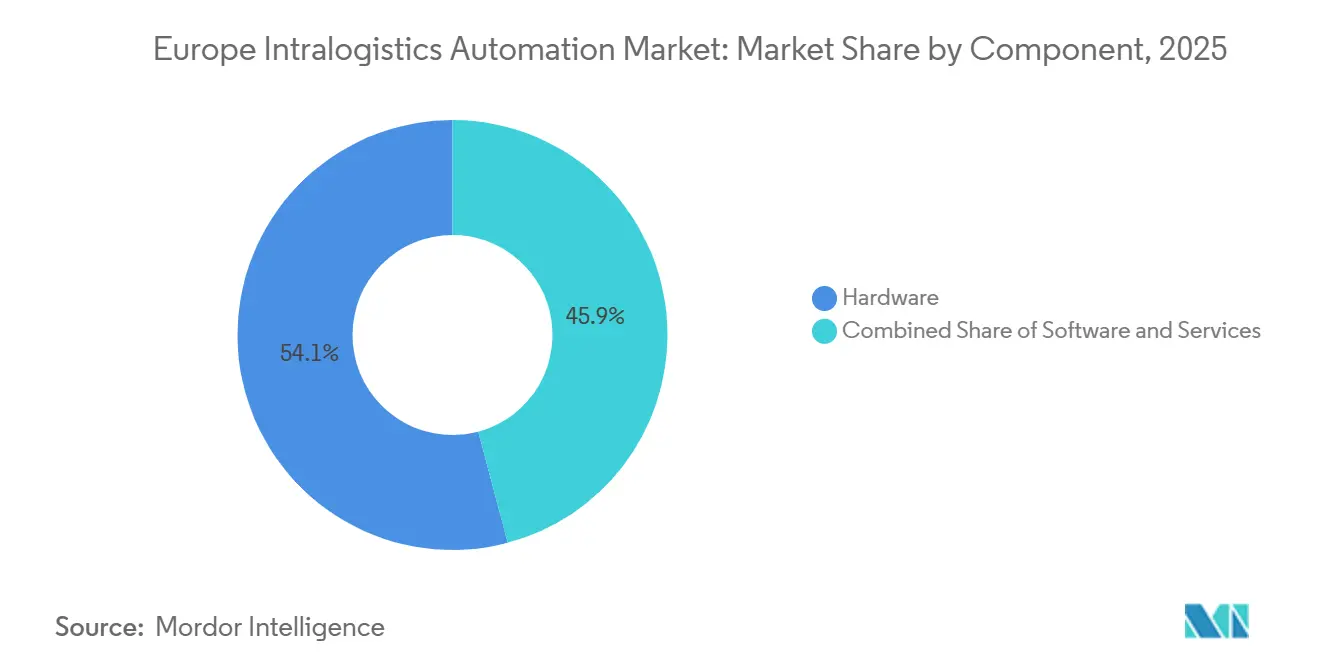
- By component, hardware captured 54.14% of the European intralogistics automation market size in 2025, and software is set to post an 11.32% CAGR between 2026-2031.
- By function, storage accounted for 32.38% of the Europe intralogistics automation market in 2025, and order-picking systems are expected to expand at a 11.68% CAGR through 2031.
- Germany accounted for 23.54% of regional revenue in 2025, whereas France is anticipated to be the fastest-growing national market at a 11.93% CAGR over 2026-2031.
Note: Market size and forecast figures in this report are generated using Mordor Intelligence’s proprietary estimation framework, updated with the latest available data and insights as of 2026.
Europe Intralogistics Automation Market Trends and Insights
Drivers Impact Analysis*
| Driver | (~) % Impact on CAGR Forecast | Geographic Relevance | Impact Timeline |
|---|---|---|---|
| E-Commerce Boom And Omnichannel Fulfilment Pressure | +2.8% | Western Europe, Iberia, Central Europe | Short term (≤ 2 years) |
| Labour Shortages And Wage Inflation Across EU27 | +2.4% | EU27-wide | Medium term (2-4 years) |
| Rapid Advances In AI-Powered Mobile Robotics And IoT | +2.1% | Germany, France, UK, Nordics | Medium term (2-4 years) |
| 5G And Private-LTE Roll-Outs Enabling Real-Time Orchestration | +1.3% | Germany, Netherlands, UK, France | Short term (≤ 2 years) |
| EU Green Deal Incentives For Low-Carbon Intralogistics | +1.2% | EU27 | Long term (≥ 4 years) |
| Interoperability Standards (VDA 5050) Enabling Multi-Vendor Integration | +0.9% | Germany, Central Europe | Medium term (2-4 years) |
| Source: Mordor Intelligence | |||
E-Commerce Boom And Omnichannel Fulfilment Pressure
Online retail penetration reached 18.3% of total Western European sales in 2025, intensifying the race to keep inventory within 20 kilometers of demand hotspots.[1]European E-Commerce Foundation, “European E-Commerce Report 2025,” ecommerce-europe.eu Micro-fulfillment centers rely on goods-to-person shuttles that cut order cycle time to 90 seconds and raise storage density fourfold, enabling a single 5,000 m² dark store to ship 10,000 daily orders. Grocery leaders such as Carrefour adopted cube-storage grids in dense urban nodes, freeing scarce floor space for last-mile staging. High-speed sorters now process up to 50,000 parcels per hour, a capability vital as cross-border parcel volumes grew 23% year-on-year in 2025. Omnichannel workflows require real-time slotting algorithms that only automated orchestration platforms can execute at scale.
Labour Shortages And Wage Inflation Across EU27
A structural shortfall of 2.1 million logistics workers in 2025 pushed fully loaded labor costs per FTE to over EUR 35,000 (USD 39,550) in 19 member states. Germany alone reported 387,000 vacancies in Q4 2025. Autonomous mobile robots allow one worker to supervise 8-12 stations, effectively quadrupling productivity. Wage convergence eroded Eastern Europe’s labor arbitrage, prompting Polish 3PLs to pilot robot fleets in 2025. The European Commission projects logistics labor supply to contract 0.3% annually through 2030, widening the automation imperative.
Rapid Advances In AI-Powered Mobile Robotics And IoT
Vision-guided mobile robots grasp irregular parcels with 98.5% accuracy, eliminating the need for presorted totes. IoT sensor meshes feed 10,000 data points per facility, enabling predictive maintenance that cuts unplanned downtime by 32%. Collaborative mobile manipulators launched in 2025 blend navigation and kitting to remove human handoffs. Fourteen vendors now support VDA 5050, enabling mixed fleets to share a common command layer and reducing deployment cycles to 16 weeks. Private 5G networks deliver sub-10 ms latency, enabling 200+ robots to be orchestrated in real time without Wi-Fi dead zones.[2]European Telecommunications Standards Institute, “Technical Specifications for Ultra-Reliable Low-Latency Communication in Industrial Settings,” etsi.org
5G And Private-LTE Roll-Outs Enabling Real-Time Orchestration
Private cellular networks in the 3.7-3.8 GHz band guarantee 99.999% availability, critical for dense metal-racked environments that attenuate signals. By end-2025, 23 logistics parks hosted private LTE or standalone 5G networks, including DHL’s Leipzig super-hub. Centralized fleet software can now re-route robots every three seconds, cutting empty travel by 28%. Up-front network costs of EUR 150,000 (USD 169,500) are recouped within 18 months as throughput rises and collision incidents fall. ETSI specifications published in 2024 formalized sub-5 ms industrial latency benchmarks, accelerating telecom-logistics partnerships.
Restraints Impact Analysis*
| Restraint | (~) % Impact on CAGR Forecast | Geographic Relevance | Impact Timeline |
|---|---|---|---|
| High Capex And Long ROI Horizons | −1.4% | Southern and Eastern Europe, SME operators | Short term (≤ 2 years) |
| Legacy IT And OT Integration Complexity | −1.1% | Germany, UK, France | Medium term (2-4 years) |
| Rising Cyber-Security Threats To Networked Robotics | −0.7% | EU27-wide | Short term (≤ 2 years) |
| Grid Power Availability Bottlenecks In Logistics Hubs | −0.5% | Eastern Europe | Medium term (2-4 years) |
| Source: Mordor Intelligence | |||
High Capex And Long ROI Horizons
Turnkey AS/RS projects for a 30,000 m² DC cost EUR 8-12 million (USD 9.04-13.56 million) and repay in 4.5-6 years. SMEs, which control 64% of European warehouse capacity, often lack access to sub-3% financing, delaying adoption despite strong labor-saving cases. Robotics-as-a-Service leases at EUR 2,500-4,000 (USD 2,825-4,520) per robot per month reduce barriers but still demand three-year commitments and facility retrofits. Forty-one percent of operators cited “uncertain demand” when deferring automation in the 2025 EIB survey. Southern Europe trails Northern peers by 30-40 percentage points in penetration as fragmented ownership structures slow board-level approvals.
Legacy IT And OT Integration Complexity
Brownfield sites running proprietary WMS platforms need custom middleware to talk to modern robot APIs, inflating project costs by 20-35%.[3]European Logistics Association, “Benchmarking Study: Warehouse Execution Systems 2025,” elalog.eu Retrofits average 7-11 months and require parallel manual workflows that double labor during transition. More than half of operators faced go-live delays exceeding eight weeks in 2025. Air-gapped networks in automotive and food plants complicate remote diagnostics, pushing operators to spend EUR 150,000-300,000 (USD 169,500-339,000) on external consultants per project. A shortage of cross-disciplinary IT talent keeps integration risk elevated.
*Our forecasts treat driver/restraint impacts as directional, not additive. The impact forecasts reflect baseline growth, mix effects, and variable interactions.
Segment Analysis
By Product Type: Mobile Robots Reshape Fleet Strategies
Automated storage and retrieval systems delivered 26.71% of Europe intralogistics automation market share in 2025, reflecting entrenched cube-storage grids that quadruple space efficiency in urban micro-fulfillment centers. Yet the segment’s single-purpose nature limits redeployability when product profiles shift. Mobile robots are projected to surpass the overall Europe intralogistics automation market at an 11.91% CAGR through 2031, buoyed by lease-based models that let operators scale fleets seasonally and move assets between facilities in weeks. Subscription pricing simplifies board approvals and preserves capital for expansion initiatives.
Mobile robots also benefit from VDA 5050-driven interoperability, which allows heterogeneous fleets to coexist, minimizing the vendor-lock risk that once favored monolithic AS/RS investments. Automated sorting systems dominate parcel hubs that must process 50,000 parcels per hour during Cyber Week peaks, while palletizing cells with vision-guided grippers cut case cycle times to eight seconds. Although automated conveyors remain the backbone for long-haul internal transport, operators increasingly supplement fixed tracks with mobile robots to create flexible “matrix layouts” capable of overnight reconfiguration for new product launches.


By End-User Industry: Retail Growth Masks Automotive Sophistication
Retail, warehousing, and distribution accounted for 29.43% of revenue in 2025 and will lead growth at a 12.02% CAGR, driven by omnichannel businesses striving for two-hour delivery in dense urban areas. The segment’s dependence on piece-level picking aligns with mobile-robot advantages, reinforcing its outsized contribution to the Europe intralogistics automation market. Post-and-parcel operators continue to invest in cross-belt sorters that push Europe intralogistics automation market size upward each holiday season.
Automotive suppliers, while representing a smaller revenue slice, deploy some of the continent’s most sophisticated just-in-sequence systems, demanding 99.8% on-time accuracy that manual tuggers cannot match. Food and beverage facilities add stainless-steel mobile robots to navigate chilled zones, raising unit-cost premiums but trimming compliance risk. General manufacturing favors raw-material sequencing solutions with sub-four-year paybacks, whereas airport baggage handling remains a high-value niche, as European hubs race to cut mishandled-bag rates by one-third ahead of the 2028 travel surge.
By Component: Software Becomes The Competitive Moat
Hardware accounted for 54.14% of spend in 2025, but software revenue is forecast to grow at a 11.32% CAGR as operators demand end-to-end orchestration that unifies order flow, labor scheduling, and robot tasking. Europe intralogistics automation market size for digital twins is expanding because virtual commissioning slashes physical test time from 12 weeks to four. Cloud-native stacks let one engineer supervise 20 facilities, reducing on-site calls by 40% and shifting cost structures from capital to opex.
Interoperability middleware converts VDA 5050 messages into proprietary robot protocols, turning integration from a bespoke coding exercise into plug-and-play IO mapping. Cybersecurity modules compliant with IEC 62443 mitigate ransomware risk, a growing board-level concern after warehouse attacks spiked 37% between 2024-2025. Outcome-based service contracts, where integrators guarantee throughput or uptime, transfer performance risk away from operators and cement long-term customer relationships.
By Function: Order Picking Surpasses Storage Velocity
Storage systems accounted for 32.38% of installations in 2025 as cube-dense AS/RS solutions addressed sky-high urban land costs, securing a strong Europe intralogistics automation market. Yet order-picking and retrieval platforms will grow at a 11.68% CAGR, reflecting the shift from pallet to piece-level fulfillment. Goods-to-person shuttles let one operator process up to 220 lines per hour, a threefold uplift over manual pick-and-pack.
Sorting and consolidation systems form the backbone of cross-border parcel hubs that must achieve 99.95% accuracy at knee-bending volumes. Packaging and palletizing robots adapt to mixed-SKU loads in under five minutes, unlocking late-stage customization. Fixed conveyors continue to dominate long runs, but mobile fleets now shoulder cross-aisle transfers, deferring heavy civil works until volumes stabilize. The convergence of these functions into software-orchestrated workflows blurs segment boundaries, nudging buyers to seek unified control planes rather than discrete point solutions.
Geography Analysis
Germany contributed 23.54% of Europe's intralogistics automation market revenue in 2025, anchored by automotive OEMs that operate highly automated just-in-sequence lines. Federal R&D funding of EUR 1.2 billion (USD 1.36 billion) under Industrie 4.0 accelerated the adoption of cyber-physical systems that link shop-floor robotics directly to enterprise resource planning systems. Real estate developers now pre-install private LTE backbones and laser-level floors to shorten tenant fit-out by 4 months, reinforcing Germany’s role as a testbed for advanced solutions.
France is projected to be the fastest-growing geography, with a 11.93% CAGR between 2026-2031. Hypermarket chains are repurposing dark stores into micro-fulfillment centers, supported by France 2030 funding and a EUR 150 million ADEME grant program that subsidizes energy audits and retrofits. The United Kingdom’s post-Brexit re-routing of trade flows has led to fewer but larger DCs; every new facility over 50,000 m² broke ground with at least one automated subsystem in place.
Italy and Spain accelerate adoption in cold-chain operations where labor shortages in rural zones intersect with stringent hygiene mandates. Rest of Europe tells a bifurcated story: Benelux and the Nordics exhibit world-class robot density, whereas Central and Eastern Europe experiment with semi-automated hybrids that blend manual labor with mechanized transport to sidestep grid-power constraints topping 2 MW. The pending EU Machinery Regulation harmonizing CE marking and France’s dynamic safety-zone guidelines lower compliance friction and hasten multi-country rollouts.
Regulatory Landscape
Intralogistics automation deployments in Europe operate within the EU product-safety and machinery compliance regime. Risk assessment and safeguarding are grounded in widely adopted standards, including ISO 3691-4 for driverless industrial trucks, with functional-safety frameworks such as ISO 13849 and IEC 62061 also informing implementation.
Industry bodies including the European Materials Handling Federation (FEM) and VDMA coordinate guidance for manufacturers and integrators working across multiple European countries, supporting harmonized approaches to safety concepts for autonomous vehicles and integrated material-handling systems. Regulatory focus is broadening beyond machinery safety into software, data, and cybersecurity. The EU AI Act adds high-risk obligations for relevant AI-enabled systems, with Annex I high-risk requirements applying from 2 August 2027, while ongoing policy discussions such as the European Commission Digital Omnibus package (COM(2025) 1023) continue to refine the compliance perimeter for AI in machinery contexts. The EU Cyber Resilience Act also lifts security-by-design expectations for connected automation products, shaping vendor roadmaps for next-generation control software and networked intralogistics platforms.
Value Chain Analysis
The Europe intralogistics automation value chain begins with core component suppliers, including motors, drives, sensors, safety controllers, vision, and industrial networking, which supply equipment manufacturers for conveyors, AS/RS, shuttles, sorters, and mobile robots. Systems integrators such as Dematic, TGW, Swisslog, Vanderlande, and SSI Schaefer typically deliver turnkey projects, combining mechanical design, controls, warehouse control software, and integration into WMS/WES layers before commissioning at customer sites across retail, parcel, manufacturing, and airport applications.
Downstream value is increasingly captured in software and services, including fleet management, orchestration, digital twins, and lifecycle support such as spares, maintenance, and performance upgrades that help keep heterogeneous systems operating with high uptime. Trade associations such as VDMA and FEM shape interoperability and safety best practice, while FEM working groups such as its AIV initiative support common technical approaches for autonomous vehicles. This helps multi-vendor deployments shift from bespoke integrations toward more repeatable architectures.
Competitive Landscape
The Europe intralogistics automation market shows moderate concentration, with the ten largest integrators holding about half of total revenue yet none exceeding a low-double-digit share. Dematic, Swisslog, Vanderlande and SSI Schäfer anchor this tier, leveraging decades-old installed bases, proprietary warehouse control software and long-tail maintenance contracts to defend recurring revenue. AutoStore and Exotec continue to gain ground by offering modular cube-storage and lease-friendly mobile-robot fleets that bypass traditional five-year capital approval cycles, helping them capture a rising share of new project awards.
Strategic moves center on software and services because hardware margins keep tightening. Incumbents are buying fleet-management platforms, embedding digital-twin simulation and rolling out outcome-based service agreements that guarantee throughput or uptime. Disruptors answer with open-API architectures that plug into VDA 5050, allowing customers to mix best-of-breed robots from multiple brands without vendor lock. The spread of subscription pricing further blurs lines between system integrators, equipment manufacturers, and pure-play software houses, intensifying competition for lifetime customer value rather than one-off equipment sales.
Innovation pressure remains high. Patent filings in autonomous navigation, energy-recovery braking and predictive maintenance rose sharply in 2025, signaling a shift toward edge-AI and swarm-coordination algorithms that trim latency and eliminate single points of failure. Vendors are also racing to certify to IEC 62443 cybersecurity standards as ransomware incidents in logistics facilities climb, adding compliance as a new battleground. White-space opportunities persist in retrofit kits for brownfield sites, SME-focused leasing models under EUR 500,000 and sector-specific solutions for cold-chain, hazardous materials and cleanroom logistics, ensuring that both incumbents and challengers have ample room to differentiate.
Europe Intralogistics Automation Industry Leaders
Vanderlande Industries B.V.
Swisslog Holding AG
TGW Logistics Group GmbH
SSI Schäfer AG
Dematic GmbH (KION Group)
- *Disclaimer: Major Players sorted in no particular order

Market Opportunities and Future Outlook
Modernization of installed material-flow infrastructure is creating demand for upgrade-led projects that add higher performance controls, monitoring, and software layers without full facility rebuilds. Swisslog’s July 2026 launch of its FastMove monorail for pallet transport underscores ongoing product investment in scalable, high-throughput pallet movement, which aligns with customer needs to refresh long-distance transport lanes and improve operational flexibility through next-generation control and diagnostics.
Standardization and cross-border scalability continue to open opportunities in mixed-fleet deployments, retrofit kits, and interoperability middleware for autonomous intralogistics vehicles. FEM’s AIV Group, launched in September 2024, provides an industry platform for common technical standards for autonomous vehicles and interoperability, supporting multi-vendor deployments across European sites where buyers are looking to reduce vendor lock-in and shorten rollout timelines. Cold-chain and specialized environments remain another concrete opportunity area, with examples including Swisslog’s May 2026 automation partnership for Magnavale’s frozen high-bay warehouse in Avonmouth, Bristol, reflecting ongoing investment in temperature-controlled warehousing where reliability, safety, and labor availability constraints lift the value of automation and services.
Recent Industry Developments
- July 2026: Swisslog Holding AG introduced the FastMove monorail solution for pallet transport (with planned EU Cyber Resilience Act compliance in future releases). The launch expands high throughput pallet handling capabilities in European intralogistics and strengthens the company’s offering for scale driven projects. It signals readiness to align with cybersecurity compliance trends within EU markets.
- June 2026: Swisslog Holding AG installed six Vectura pallet stacker cranes at Lebkuchen-Schmidt’s new central logistics site in Nuremberg. The deployment enhances automated storage and retrieval capacity for a mid-sized German e commerce and retail hub. The installation strengthens the company’s customer rollout in Germany and demonstrates scalable stacker crane deployment for multinationals.
- May 2026: Swisslog Holding AG appointed automation partner for Magnavale’s frozen high bay warehouse in Avonmouth, Bristol. The project advances cold chain automation deployment in UK retail logistics. It extends Swisslog’s footprint in refrigerated and frozen warehousing markets across Europe.


Research Methodology Framework and Report Scope
Market Definition and Coverage
For this study, the Europe intralogistics automation market is defined as revenues earned from automation solutions used to move, store, sort, and manage materials inside facilities such as warehouses, distribution centers, and factories, across European countries.
Scope exclusions: We exclude automation used mainly for transport outside the facility (line-haul). We also exclude general building construction and non-automation warehouse equipment.
Segmentation Overview
- By Product Type
- Mobile Robots
- Automated Storage and Retrieval Systems (AS/RS)
- Automated Sorting Systems
- Palletising and De-Palletising Systems
- Automated Conveyors
- Order-Picking Systems
- By End-User Industry
- Airport
- Post and Parcel
- General Manufacturing
- Automotive
- Food and Beverage
- Retail, Warehousing and Distribution
- Other End-User Industries
- By Component
- Hardware
- Software
- Services
- By Function
- Storage
- Order Picking and Retrieval
- Sorting and Consolidation
- Packaging and Palletising
- Transportation and Conveyance
- By Country
- United Kingdom
- Germany
- France
- Italy
- Spain
- Rest of Europe
Data Sources, Market Sizing, and Validation
Desk Research
Desk research was used to set the market boundary, build the basic demand picture, and sanity check trends that were later tested in interviews. We typically start with official and public sources such as Eurostat structural business statistics, UN Comtrade trade flows for automation equipment categories, European Commission policy and funding releases (industry and digital programs), and International Federation of Robotics publications on industrial robots and mobile robots.
To translate demand signals into a workable model, we also review company annual reports and investor presentations, customs and logistics commentaries in reputed press, and association websites that publish safety and warehouse standards. In parallel, we use paid data subscriptions for company financials and intelligence, patent databases to follow technology direction, and shipment-level import and export datasets where they help explain cross-border supply patterns. The sources listed here are illustrative only, and many other public and paid references were used for data collection, validation, and clarification.
Primary Interviews and Surveys
Primary work was carried out through expert interviews and structured surveys with system integrators, component suppliers, software providers, and end users such as 3PLs, retailers, and manufacturers, so the sizing reflects actual buying behavior. Coverage was balanced across major European demand centers and smaller but fast-adopting countries. Interviews covered project mix, average system pricing, replacement cycles, and how often budgets get delayed or pulled forward. Where desk sources gave broad totals, interviews were used to confirm what is truly intralogistics automation versus adjacent warehouse spend, and then to tighten the final assumptions.
Distribution of primary research fieldwork respondents
| Company type | Respondent position | Region |
|---|---|---|
| Top tier: 25% | CXOs: 13% | |
| Mid tier: 59% | Functional/Unit leaders: 41% | |
| Smaller Players: 16% | Managers: 46% |
Market-Sizing & Forecasting
The market size is developed using a combined top-down and bottom-up logic that stays practical for Europe-wide coverage. On the top-down side, we reconstruct the addressable automation spend by linking facility activity to automation adoption, where warehouse and manufacturing throughput needs, labor availability, and capex intent act as the main demand pool signals. We then allocate spend to intralogistics automation based on what is installed inside the four walls.
The totals are corroborated with selective bottom-up approximations, including roll-ups from a sample of supplier and integrator revenues, channel checks on project pipelines, and typical price bands for major system types (for example AS/RS, conveyors and sortation, and mobile robots) multiplied by observed deployment volumes. Inputs that matter in this market include e-commerce fulfillment growth, labor cost inflation and vacancy levels, warehouse new-build and retrofit activity, automation utilization and uptime expectations, and software attach rates for control and orchestration layers. When a country or niche has limited disclosure, gaps are handled by using proxy adoption rates from similar logistics profiles, followed by interview re-checks before locking the split.
For forecasting, we use scenario analysis supported by light multivariate regression on the most stable drivers (order volumes, labor tightness, and industrial output). We then adjust using expert views on budget cycles and lead times. This keeps the forecast explainable, and it also makes it easier to update if a key driver changes in a given year.
Data Validation & Update Cycle
Validation is done through multiple passes, so the final numbers do not rely on one data stream. We compare the modeled outputs against independent signals such as trade patterns for automation equipment, reported order intake commentary, and expected installation intensity per facility type, and then review any unusual jumps country by country.
Before sign-off, assumptions are cross-checked by a second analyst. If variances remain high, interview follow-ups are triggered to clarify what is included in project values and what is not. Reports are refreshed annually, and interim updates are made when there are material events that can shift demand or pricing. Right before delivery, we complete a fresh review pass so clients receive the most current view supported by traceable inputs.
Mordor Intelligence's Europe Intralogistics Automation Market Size Measured Against Other Published Estimates
Published market sizes for intralogistics automation in Europe often differ because the scope line is drawn in different places, and because pricing and installation timing get treated differently across models. Some publishers lean more on broad equipment categories, while others narrow down to only warehouse automation, which changes the counted revenue pool.
The benchmark table shows a noticeable spread. In Mordor Intelligence's model, only automation revenues tied to inside-facility material flow and control are counted, while adjacent spend like general warehouse fit-out and non-automation material handling is left out. Differences also come from how average selling prices are moved over time (flat pricing versus inflation-adjusted project quotes), whether backlog is treated as booked revenue, and how frequently currency assumptions are refreshed during volatile periods.
Benchmark comparison
| Source | Market Size | Gaps in Research Methodology |
|---|---|---|
| Mordor Intelligence | USD 6.84 B (2025) | |
| Regional Consultancy A | USD 15.78 B (2025) | Often uses a broader intralogistics definition that can fold in non-automation material handling and wider facility logistics services, which inflates the addressable spend beyond inside-facility automation revenues. |
| Trade Journal B | USD 8.11 B (2026) | Typically anchors on announced projects and order intake narratives, and may treat backlog or booked orders as revenue, which can pull value forward compared to installation-based recognition. |
Reading the table together with the scope notes helps explain the gap without needing complex math. When the definition is kept to inside-facility automation revenue and the timing is aligned to deployment and commissioning, the result becomes easier to track back to demand drivers like throughput needs, labor constraints, and project pricing that buyers can verify year to year.


Key Questions Answered in the Report
How large is the Europe intralogistics automation market today and by 2031?
It is valued at USD 7.72 billion in 2026 and is projected to reach USD 12.89 billion by 2031, growing at a 10.79% CAGR.
Which product category is expanding fastest?
Mobile robots will outpace all other categories with an 11.91% CAGR through 2031 thanks to lease-based models and rapid redeployability.
Why are retailers leading adoption?
Omnichannel strategies demand sub-two-hour delivery, pushing retailers to automate piece-level picking and capture 29.43% of 2025 revenue while posting a 12.02% CAGR.
What technical trend is unlocking multi-vendor robot fleets?
The VDA 5050 interoperability standard lets heterogeneous robots share a common fleet-management layer, shrinking deployment cycles to 16 weeks.
How is EU policy influencing automation investment?
Green-deal grants fund up to 60% of low-carbon upgrades, while the pending Machinery Regulation harmonizes safety standards, cutting compliance costs for cross-border deployments.
Which country is forecast to grow fastest?
France is expected to advance at an 11.93% CAGR between 2026-2031, propelled by dark-store conversions and state incentives under the France 2030 plan.
Page last updated on:


