
Market Overview
| Study Period | 2020 - 2031 |
|---|---|
| Forecast Data Period | 2026 - 2031 |
| Base Year Market Size (2025) | USD 44.10 Billion |
| Market Size (2026) | USD 45.73 Billion |
| Market Size (2031) | USD 54.82 Billion |
| Growth Rate (2026 - 2031) | 3.69 % |
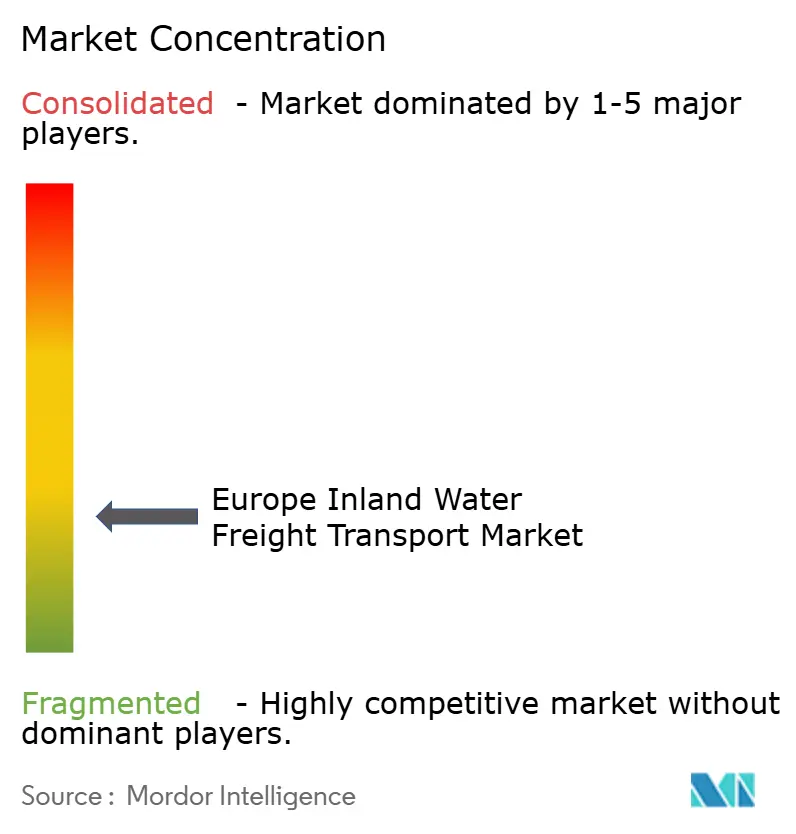
| Market Concentration | Low |
Major Players *Disclaimer: Major Players sorted in no particular order Image © Mordor Intelligence. Reuse requires attribution under CC BY 4.0. | |
Europe Inland Water Freight Transport Market Analysis by Mordor Intelligence
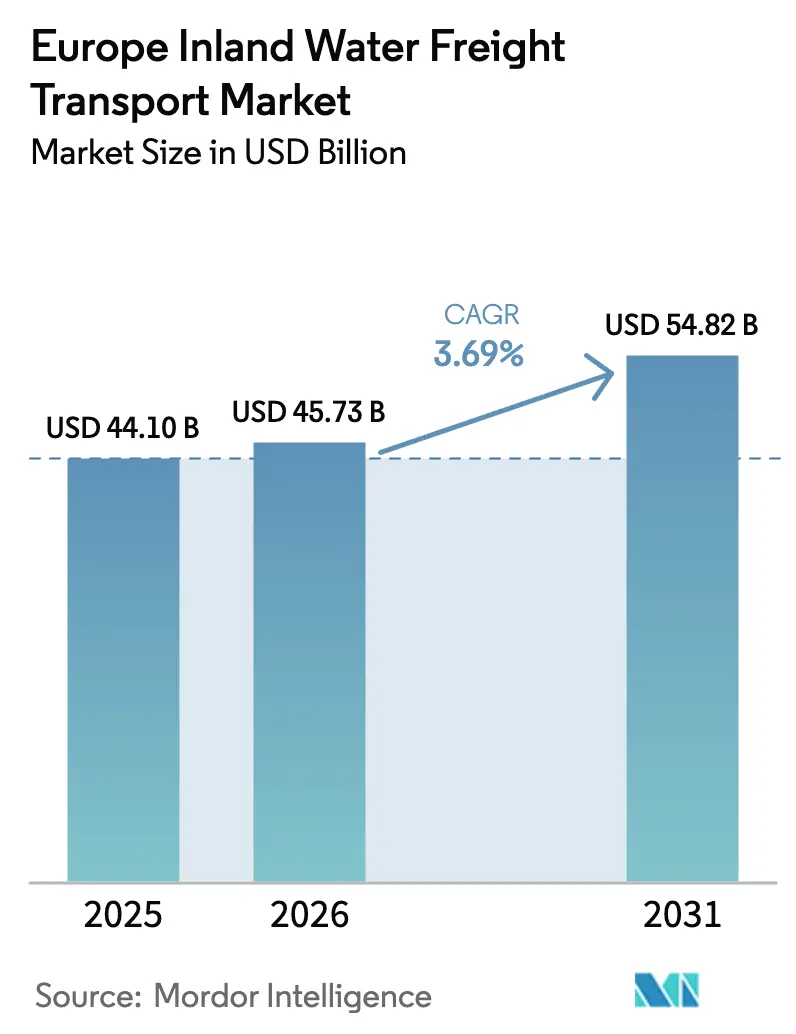
The Europe Inland Water Freight Transport Market size was valued at USD 44.10 billion in 2025 and estimated to grow from USD 45.73 billion in 2026 to reach USD 54.82 billion by 2031, at a CAGR of 3.69% during the forecast period (2026-2031).
Demand is rising as shippers look for lower-carbon, cost-efficient corridors that fit the European Green Deal’s tight emissions timetable and the forthcoming expansion of carbon pricing. Policy clarity is encouraging operators to refresh aging barge fleets, alongside digital upgrades that tighten links with rail hubs and deep-sea ports. Large Western European networks already benefit from integrated river–sea gateways, while targeted Danube investments are unlocking new capacity in Central and Eastern Europe. Increasing container penetration, urban logistics pilots on city canals, and the widening fuel-cost gap with long-haul trucking together present clear opportunities for service differentiation and scale advantages.
Key Report Takeaways
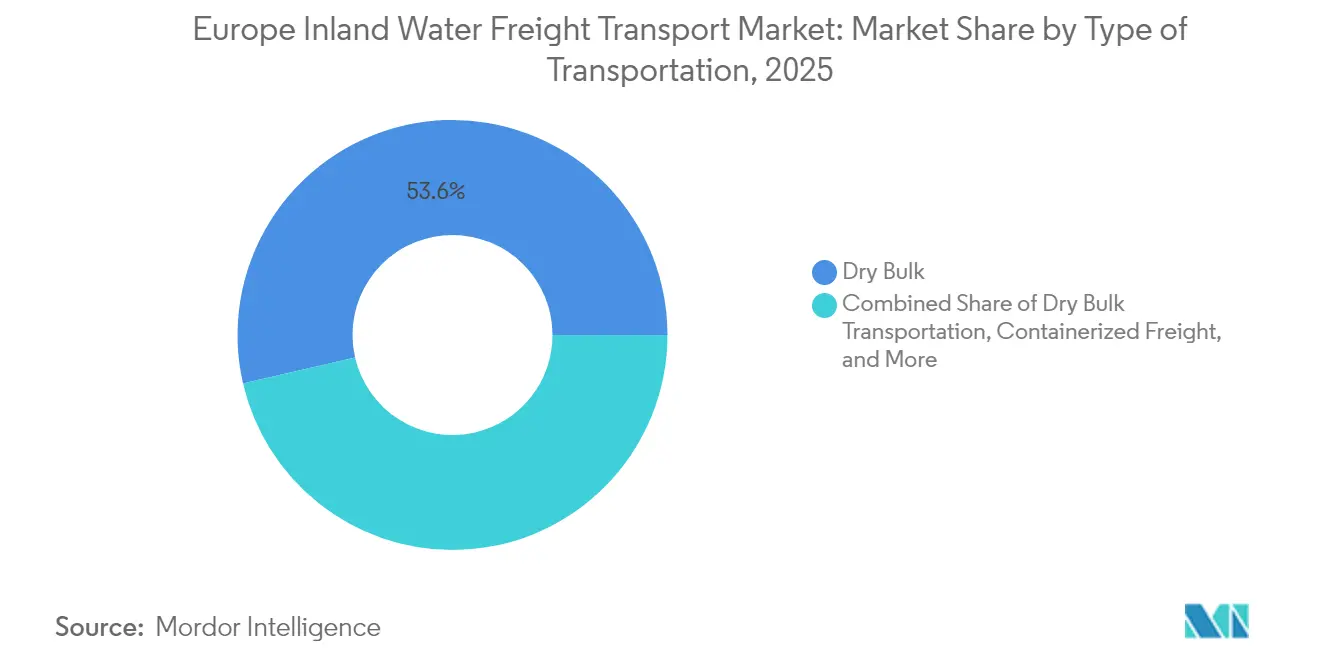
- By transportation type, dry bulk held the largest Europe inland water freight transport market share at 53.62 % in 2025, while containerized freight is projected to expand at a 6.98 % CAGR through 2031.
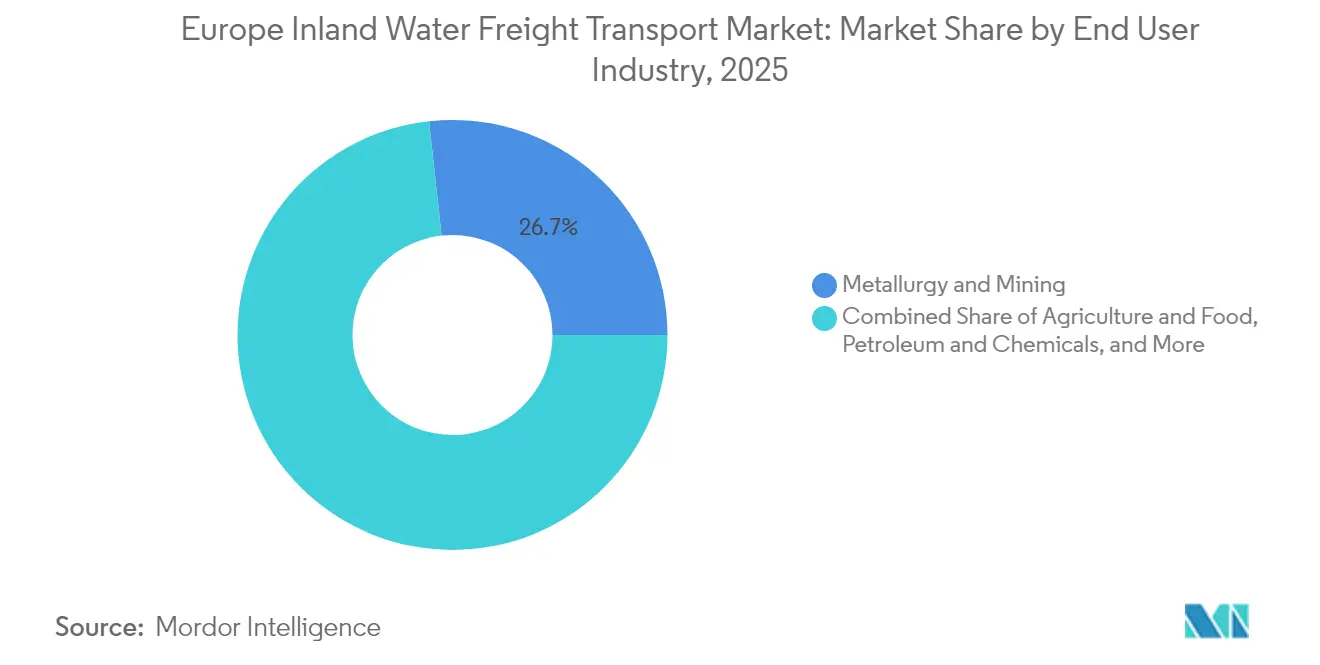
- By end-use industry, metallurgy and mining accounted for a 26.74 % share of the market size in 2025, whereas consumer goods and retail are advancing at an 7.93 % CAGR to 2031.
- By geography, the Netherlands dominated with a 32.70% market share in 2025, while Romania is set to grow the fastest at a 5.98 % CAGR over the forecast period.
Note: Market size and forecast figures in this report are generated using Mordor Intelligence’s proprietary estimation framework, updated with the latest available data and insights as of 2026.
Market Trends and Insights
Drivers Impact Analysis of Europe Inland Water Freight Transport Market*
| Driver | (~) % Impact on CAGR Forecast | Geographic Relevance | Impact Timeline |
|---|---|---|---|
| EU Green Deal Driving Modal Shift to Waterways | +1.2% | EU-wide, Rhine–Scheldt delta strongest | Medium term (3-4 yrs) |
| Rhine-Danube Corridor Capacity Upgrades Accelerating Barge Demand | +0.9% | Central & Eastern Europe | Long term (≥ 5 yrs) |
| Tightening CO₂ / Pollutant Norms Favouring Low-Emission Barges | +0.6% | EU-wide, Western Europe strongest | Medium term (3-4 yrs) |
| Digitisation via RIS & DINA Improving Supply-Chain Visibility | +0.5% | EU-wide, Rhine corridor strongest | Short term (≤ 2 yrs) |
| Rise of Urban Logistics Pilots in Paris, Amsterdam & Antwerp | +0.3% | Major urban centres | Short term (≤ 2 yrs) |
| Fuel-Cost Differential vs. Road Transport Widening After ETS-II | +0.7% | EU-wide | Medium term (3-4 yrs) |
| Source: Mordor Intelligence | |||
EU Green Deal Driving Modal Shift to Waterways
The European Green Deal aims for a 90 % reduction in transport-related greenhouse-gas emissions by 2050, and its Sustainable and Smart Mobility Strategy calls for inland waterway freight volumes to climb 25 % by 2030 and 50 % by 2050. As ETS fees scale up for shipping emissions, the gap between the carbon cost of barges and trucks widens, strengthening the modal-shift argument in national freight strategies. Operators are already reporting stronger demand inquiries for container slots on the Rhine–Dutch delta, implying that the targets are influencing day-to-day routing decisions well before the 2030 milestone. An immediate inference is that modal-shift subsidies may taper sooner than expected because cost competitiveness alone progressively favours waterways.
Rhine–Danube Corridor Capacity Upgrades Accelerating Barge Demand
European Union investments to eliminate bottlenecks along the Rhine–Danube corridor include deeper draught sections, taller bridges, and modernised locks in Slovakia, Hungary, and Romania. Completion of these works raises baseline payloads during variable river conditions, thereby reducing the “empty kilometres” problem that once stifled profitability. Private operators such as Contargo have responded by enlarging their dedicated barge fleets and ordering hybrid-propulsion vessels to secure early mover advantages. From these patterns one can infer that barge charter rates along the Danube will trend upward as shippers compete for newly reliable capacity.
Tightening CO₂ / Pollutant Norms Favouring Low-Emission Barges
FuelEU Maritime rules effective January 2025 mandate a 2 % reduction in greenhouse-gas intensity for vessels, tightening to an 80 % cut by 2050 [1]. The Central Commission for the Navigation of the Rhine (CCNR) complements this with a 35 % target by 2035 [2]. Early adopters of Euro 6 truck-engine retrofits report reductions of up to 95 % in particulate matter, with payback periods shortened by lower fuel use and rising diesel surcharges. A logical inference is that secondary markets for retired but mechanically sound Euro 6 truck engines will strengthen, stimulating a niche refurbishment supply chain centred on inland shipyards.
Digitisation via RIS & DINA Improving Supply-Chain Visibility
River Information Services create unified electronic reporting and real-time traffic management, enabling skippers to pick optimal draught windows while ports pre-stage cranes and road feeders [3]. The forthcoming “digital twin” of navigable waters based on the IHO S-100 standard paves the way for seamless data exchange between maritime and inland systems. Research finds that RIS adoption can shorten route-planning times and cut administrative delays for interurban pallet flows. One immediate inference is that customs authorities gain earlier visibility over cargo manifests, potentially reducing inspection queues and favouring ports equipped with full RIS connectivity.
Restraints Impact Analysis of Europe Inland Water Freight Transport Market*
| Restraint | (~) Impact on Market CAGR | Geographic Relevance | Impact Timeline |
|---|---|---|---|
| Chronic Low-Water Events on Rhine & Danube Disrupting Load Factors | -0.8% | Rhine & Danube | Medium term (3-4 yrs) |
| Ageing Barge Fleet Facing Capex-Intensive Retrofit Mandates | -0.7% | EU-wide, Eastern Europe strongest | Medium term (3-4 yrs) |
| Port and Lock Bottlenecks Limiting Vessel Size on Secondary Canals | -0.5% | Secondary canals, Eastern Europe | Long term (≥ 5 yrs) |
| Competitive Pressure from Electrified Rail Freight in Central Europe | -0.4% | Central Europe | Medium term (3-4 yrs) |
| Source: Mordor Intelligence | |||
Chronic Low-Water Events on Rhine & Danube Disrupting Load Factors
Climate-driven low-water spells forced barges on the Rhine to sail at partial loads for several consecutive weeks in 2024, cutting German industrial output by roughly 1 % during the affected month. Similarly, parts of the Danube fell to 1.5 m depth, compelling convoys to idle or re-route. Operators mitigate with shallow-draught hull designs and dynamic cargo-allocation software, but residual uncertainty dents service reliability. From this evidence one can infer that risk-adjusted freight pricing will favour multi-hull vessels capable of continuing service at reduced draughts, even if capital costs are marginally higher.
Ageing Barge Fleet Facing Capex-Intensive Retrofit Mandates
The Rhine cargo fleet averages 1,500-tonne capacity, yet many hulls date back decades and lack pre-installed emission-control units. Retrofitting Euro 6 engines costs USD 175,000–290,000 and competes with owner plans for outright replacement by hybrid or LNG units. EU-funded programs such as MoVe IT! ease the burden, but family-owned operators with one or two barges still struggle to secure collateral for green loans. A new inference is that vertical collaboration with charterers—who may guarantee multi-year contracts in exchange for cleaner tonnage—will become a practical financing route for single-vessel entrepreneurs.
*Our forecasts treat driver/restraint impacts as directional, not additive. The impact forecasts reflect baseline growth, mix effects, and variable interactions.
Europe Inland Water Freight Transport Market Segment Analysis
Type of Transportation:
Dry Bulk Dominates While Containers SurgeDry bulk commands the largest Europe Inland Water Freight Transport market share at 53.62 % in 2025, carrying commodities such as coal, steel inputs, and construction aggregates on high-capacity Rhine barges equivalent to 220 trucks. The segment benefits from low handling complexity, enabling steady utilisation even during economic lulls. A notable inference is that anticipated coal-phase-out policies will gradually shift barge tonne-kilometres toward biomass and recycled-metal flows, altering hold-cleaning protocols and port terminal equipment.
Containerised freight, while currently smaller, is forecast to grow at a 6.98 % CAGR from 2026-2031, significantly outpacing overall market expansion. Operators such as Contargo already field 13,498 TEU of barge capacity and plan to deploy electric-propulsion units in 2024. Liquid bulk retains stable volumes thanks to dedicated chemical park jetties, whereas roll-on/roll-off craft gain traction in city-distribution trials. An arising inference is that port planners will allocate more quay space to barge-mounted gantries capable of side-loading containers in tidal or variable river conditions.

End-Use Industry:
Metallurgy Leads While Retail AcceleratesMetallurgy and mining account for the largest European Inland Water Freight Transport market size within end-use industries, holding 26.74 % share in 2025; iron ore flows on the Danube have risen 6.8 % on the back of higher steel output. The sector values barges for their high payloads and tolerance for longer transit times, turning rivers into rolling stockyards. A reasonable inference is that decarbonisation paths for steel, such as hydrogen-based direct-reduction, could introduce new upstream cargoes like iron-pellet additives, diversifying barge cargo mixes.
Consumer goods and retail, while representing a smaller base, are predicted to post an 7.93% CAGR through 2031 as e-commerce pushes parcel integrators to experiment with waterborne micro-fulfilment. Agriculture remains material, especially for grain exports from Central Europe, though the shrinking universe of small-capacity vessels strains seasonal peaks. Petrochemicals sustain solid demand via specialized tank barges equipped with inert-gas systems. A fresh inference is that the construction sector’s appetite for low-carbon cement may trigger an uptick in specialised silo-barge orders to meet urban project timelines.
Geography Analysis
Netherlands Inland Water Freight Transport Market
The Netherlands leads the Europe Inland Water Freight Transport industry with a 32.70 % market share in 2025, underpinned by a dense canal matrix linking Rotterdam and Amsterdam with German and Belgian hinterlands. Around 35 % of intra-EU cargo tonnage transits the Dutch network, underscoring its gateway stature. Ongoing public-private programs channel capital into shore-power installations and hydrogen-ready refuelling, reinforcing environmental credentials. An inference derived here is that pilot-scale hydrogen barges may first achieve commercial viability on Dutch short-haul routes where bunkering infrastructure is densest.
Germany Inland Water Freight Transport Market
Germany ranks second due to the Rhine artery feeding its industrial regions; planned upgrades will extend the “high-performance” network from 4,000 km to 9,000 km, integrating rail and river terminals. Low-water susceptibilities, however, expose manufacturers to supply chain shocks, prompting them to pre-book capacity during dry seasons. Federal subsidies for alternative-fuel retrofits have helped family operators modernise hulls, indirectly raising average fleet efficiency. A logical inference is that forward-looking shippers may negotiate index-linked freight contracts that adjust for draught-restricted payload penalties, spreading hydrological risk across supply partners.
Romania Inland Water Freight Transport Market
Romania emerges as the fastest-growing geography, with a forecast CAGR of 5.98 % through 2031 as Rhine-Danube investments unlock navigation year-round. Romanian operators own the largest share of dry-cargo vessels in the Danube fleet, positioning them favourably for grain and steel inputs once corridor works finish. Nevertheless, episodic droughts lowered Danube flow to 2,900 m³/s in August 2024, below the 4,600 m³/s norm, temporarily curbing vessel draughts. EU cohesion funds earmarked for lock upgrades and dredging mitigate these constraints. An emergent inference is that Romanian logistics firms could leapfrog legacy Western European systems by adopting fully digital traffic-management from inception, avoiding incremental upgrades.
Regulatory Landscape
The European Commission frames inland waterway transport policy through NAIADES III (2021-2027), aligned with the EU Sustainable and Smart Mobility Strategy targets to increase inland waterway freight by 25% by 2030 and 50% by 2050. Infrastructure availability and reliability are increasingly tied to EU-level requirements such as Regulation (EU) 2024/1679, which sets minimum Good Navigation Status parameters (including 2.50 m channel depth for rivers and canals and 5.25 m clearance under non-openable bridges), directly shaping corridor upgrade priorities and terminal access planning.
On the operational and compliance side, digital and technical rules are tightening across core networks. An amended River Information Services (RIS) Directive entered into force in early 2026, triggering a three-year transposition window for Member States and accelerating standardized electronic reporting and traffic information. In parallel, the Central Commission for the Navigation of the Rhine (CCNR) adopted definitive rules in June 2026 for using the Track Guidance Assistant for Inland Navigation (TGAIN), providing a clearer framework for assisted navigation solutions on the Rhine system as the European Commission progresses a fitness check of inland waterway transport market-access legislation.
Value Chain Analysis
Europe inland water freight transport value creation starts with waterway and lock/bridge infrastructure managers and runs through inland ports and terminals, barge operators, freight forwarders, and multimodal integrators that link river services with rail, road, and deep-sea port gateways. The Rhine-Scheldt delta and the Rhine industrial belt are supported by dense terminal ecosystems and intermodal nodes, while Danube corridor works in Central and Eastern Europe connect river operators to grain, metallurgy, and project cargo origins. Digitization is also moving deeper into the chain via RIS-enabled voyage planning, berth and lock coordination, and electronic reporting that connects skippers, terminals, and authorities.
Upstream and adjacent service layers are expanding beyond traditional vessel supply, crewing, and maintenance to include emissions retrofit providers, alternative-fuel logistics, and data-platform vendors. Fleet modernization activities (for example, Euro 6 retrofits and hybrid propulsion adoption) are creating demand for specialized shipyards and equipment suppliers, while terminal-side electrification and charging infrastructure link low-emission trucking with barge-based container flows. Industry coordination bodies and alliances also form part of the operating model, as seen with the Waterway Alliance (Allianz Wasserstraße) established by Rhenus, HGK, Duisport, and Viking Cruises in June 2026 to advocate for infrastructure investment and supportive policy, reinforcing the role of ports and large operators as corridor orchestrators.
Competitive Landscape
Europe Inland Water Freight Transport market competition is fragmented, with a mix of multinational integrators and region-specific family fleets. Rhenus Group has expanded via targeted acquisitions such as C. Hartwig Gdynia to reinforce its Air & Ocean divisions and cross-sell inland barge capacity to sea-freight customers. Scale allows such players to spread digital-platform costs and negotiate favourable energy contracts, pressuring smaller operators to form cooperatives. A direct inference is that software-as-a-service vendors focused on fleet-optimisation will find a ready client base among mid-tier barge owners looking to stay competitive without selling out.
Technological differentiation is becoming the new competitive lever. Contargo’s plan to introduce electric barges showcases how early deployment of zero-emission propulsion can capture environmentally conscious cargo flows and satisfy upcoming FuelEU Maritime thresholds. Parallel investments in RIS connectivity and automated mooring reduce turnaround times, amplifying asset utilisation. The logical inference is that productivity gains from digitalisation will widen profitability gaps between innovators and laggards faster than asset scale alone previously did.
Urban-logistics specialists represent a nascent but influential cohort. Firms piloting small electric or autonomous craft in Amsterdam or Paris focus on parcels and palletised goods that larger barges cannot deliver directly to quays in tight waterways. Collaboration with city councils is high because public authorities view waterborne micro-freight as a tool to meet congestion-reduction targets. From these initiatives one can infer that new licensing frameworks for urban waterways will likely emerge, potentially mirroring slot-allocation systems used in aviation.
Europe Inland Water Freight Transport Industry Leaders
-
Rhenus Group
-
HGK Shipping GmbH
-
Contargo GmbH & Co. KG
-
Danser Group
-
CMA CGM Inland Services
- *Disclaimer: Major Players sorted in no particular order
Europe Inland Water Freight Transport Market Companies Covered in this Report
- Rhenus Group
- HGK Shipping GmbH
- Contargo GmbH & Co. KG
- Danser Group
- CMA CGM Inland Services
- Imperial Logistics International
- Sogestran Group / CFT
- Van den Bosch Transporten BV
- Stolt-Nielsen Inland Tanker Service
- Deutsche Binnenreederei AG
- Blue Line Logistics
- VTG AG (Tanktainer / Barges)
- DP World Inland Europe
- Swire Bulk Europe
- PortLiner
- AWT Group
- Cobelfret Barge NV
- De Poli Tankers Inland
- Planco Shipping BV
- Danubia Krems GmbH*
Read Analysis of Europe Inland Water Freight Transport Companies
Market Opportunities and Future Outlook
Decarbonized and digitally orchestrated corridor services represent a concrete whitespace as EU programs and company deployments shift from pilots to operational assets. NAIADES III (2021-2027) provides a policy anchor for modal shift and fleet modernization, while FuelEU Maritime (effective January 2025) and tighter emissions expectations in inland navigation raise the commercial value of cleaner tonnage and lower-carbon end-to-end solutions. The amended RIS Directive effective in early 2026 and CCNR's June 2026 adoption of definitive TGAIN rules strengthen the business case for route optimization, assisted navigation, and more predictable slot and berth planning, particularly on high-density Rhine corridors.
Opportunities are also emerging at the intersection of inland waterways and energy-transition logistics, where terminals and operators build capabilities for new cargo and service patterns (including hydrogen, CO2, and renewable-energy related flows). Corporate actions reflect this shift: HGK and the Port of Rotterdam are working on sustainable transport corridor initiatives on the Rhine, and CMA CGM launched an electric/hybrid barge service on the Fos-Lyon corridor in April 2026, showing how lower-emission inland legs can be packaged with ocean and hinterland offerings. The value pool extends to terminal electrification, charging and shore-power readiness, and cross-border network extensions that connect river services to rail shuttles and seaports, supporting container growth and higher-frequency schedules where hydrology and lock capacity allow.
Recent Industry Developments in Europe Inland Water Freight Transport Market
- June 2026: Rhenus Group signs a Memorandum of Understanding with COSCO SHIPPING Specialized Carriers to develop integrated logistics at Rhenus Cuxport, Germany, combining vessel fleet operations with terminal infrastructure. This collaboration expands multimodal throughput and tightens coordination between inland and coastal networks to improve asset utilization.
- June 2026: Contargo inaugurates an electric truck charging hub at its Bruay-sur-l'Escaut terminal to support battery-electric fleets. The move advances decarbonization of container transport and enhances service levels for cross-border flows in Europe.
- April 2026: Covestro and HGK Shipping focus on sustainable transport solutions through wind-assisted short-sea propulsion retrofit on the Amadeus Titanium. The pilot demonstrates zero-emission propulsion in inland and multi-port corridors with potential to influence regulatory dynamics and fuel-cost considerations.
Europe Inland Water Freight Transport Market Report Scope and Research Methodology
Market Definition and Coverage
This market covers the revenues earned from moving freight on Europes inland waterways, including rivers, canals, and connected inland ports, where a licensed operator invoices for the transport service. It includes domestic and cross-border movements that are executed on inland water routes.
Scope exclusions: Passenger cruises, dredging services, offshore trans-shipment, cabotage at sea, and pipeline flows are not counted in this market.
Segments Covered in This Report
- By Type of Transportation
- Liquid Bulk Transportation
- Dry Bulk Transportation
- Containerised Freight
- Dry
- Reefer
- Roll-On / Roll-Off Cargo
- By End-Use Industry
- Agriculture & Food
- Metallurgy & Mining
- Petroleum & Chemicals
- Construction
- Energy (Biomass & Coal)
- Consumer Goods & Retail
- Others
- By Geography
- Netherlands
- Germany
- Belgium
- France
- Romania
- Bulgaria
- Rest of Europe
Data Sources, Market Sizing, and Validation
Desk Research
Desk work starts by building the activity base for inland navigation and then translating it into commercial value in a consistent way. We rely on public inland waterway statistics and modal split indicators from sources such as Eurostat, the European Commission transport statistics, and CCNR market observation publications, which help anchor tonnes moved and ton-kilometers by corridor and country.
To avoid treating Europe as one uniform lane, filings and investor presentations from operators and port authorities are used to understand service mixes and typical pricing behavior across dry bulk, liquid bulk, and containers. Patent databases also support a reality check on adoption of vessel efficiency and digital traffic management that can move operating costs over time, and a paid subscription database on company financials and a shipment-level import export database are used selectively to validate revenue ranges and trade driven flows. The specific desk sources listed here are illustrative, and many other public and paid sources were also used for data collection, validation, and clarification.
Primary Interviews and Surveys
Primary work was used to pressure test the desk assumptions that have the biggest effect on value, mainly rate structures, utilization, and how quickly surcharges pass through in low water or congestion periods. We spoke with a mix of vessel operators, freight forwarders, inland terminal managers, and large shippers across key river basins, and then re-checked the inputs where responses did not match observed volume signals.
Distribution of primary research fieldwork respondents
| Company type | Respondent position |
|---|---|
| Top tier: 38% | CXOs: 17% |
| Mid tier: 43% | Functional/Unit leaders: 25% |
| Smaller Players: 19% | Managers: 58% |
Market-Sizing & Forecasting
The model is built using a top-down reconstruction that starts from inland waterway freight activity (tonnes and ton-kilometers) and then applies service level revenue per tonne based on corridor and cargo patterns. Results are then checked through selective bottom-up approximations, such as sampled price per trip or per tonne for common routes, channel checks on surcharges, and operator revenue sanity checks to adjust totals where needed.
Inputs that materially shape the numbers include inland waterway ton-kilometers by Rhine and Danube systems, cargo mix shifts between dry bulk and containers, water level disruption frequency that changes effective capacity, fuel and crew cost direction that impacts rate resets, and inland port throughput signals that indicate short-haul versus long-haul bias. Forecasts are produced using scenario analysis, because weather driven navigability and industrial output can move volumes in different directions, and the scenarios are weighted using expert views on demand stability and rate discipline. Where bottom-up signals are patchy for smaller corridors, gaps are handled through proxy rates from similar lanes and then normalized using public performance and trade indicators.
Data Validation & Update Cycle
We run triangulation checks by comparing modeled revenue against independent indicators such as inland waterway ton-kilometers, cargo type shares, and inland port throughput trends, and then we investigate any abnormal jumps that cannot be explained by rates or volume. Outliers are reviewed in more than one analyst pass, and assumptions are sent back for re-checking when interview feedback conflicts with the desk pattern.
The report is refreshed annually, and interim updates are completed when material events occur, such as major water level disruptions, regulatory changes affecting navigation, or sharp cost shifts that change pricing. Before delivery, the latest public data is re-scanned so clients receive an updated view that matches the most recent signals.
Mordor Intelligence's Europe Inland Water Freight Transport Market Sizing Compared With Other Published Estimates
Published market numbers for inland water freight in Europe often differ because the service boundary is not defined the same way, and because volumes are sometimes converted to value with different rate and surcharge logic. Differences also show up when studies mix inland activity with sea legs or report only a subset of river systems.
Some external estimates use a narrower country set or they translate tonnes into revenue using a single fixed rate and older fuel assumptions. In Mordor Intelligence, revenues are counted only when a licensed inland operator invoices for freight hauling on rivers and canals, and passenger activity, sea cabotage, and pipeline movement are kept out, which changes the total even if the same tonne figures are referenced.
Benchmark comparison
| Source | Market Size | Gaps in Research Methodology |
|---|---|---|
| Mordor Intelligence | USD 44.10 B (2025) | |
| Regional Consultancy A | USD 14.48 B (2024) | Uses five core countries only and leaves out contract charters and several inland port linked movements, so the revenue pool is smaller even before pricing is applied. |
| Trade Journal B | USD 22.70 B (2024) | Converts tonnage to value using fixed 2019 bunker prices and does not refresh surcharge escalation for low water and congestion periods, which compresses implied revenue per tonne. |
The table shows that the widest spread comes from scope choices and the way price per tonne is refreshed over time. By keeping the value logic tied to corridor activity signals and interview checked rate behavior, our estimate stays traceable to clear steps that can be repeated each year.
Key Questions Answered in the Report
What is the current Europe Inland Water Freight Transport market size?
The market is valued at USD 45.73 billion in 2026, with a forecast to reach USD 54.82 billion by 2031.
Which country holds the largest Europe Inland Water Freight Transport market share?
The Netherlands leads with roughly one-third of total cargo volumes due to its extensive canal system and connection to the Port of Rotterdam.
What is driving growth in containerised inland shipping?
Improved intermodal links, digital scheduling via RIS, and cost advantages under carbon pricing make containers the fastest-growing cargo type.
How are low-water events affecting the industry?
Extended droughts on the Rhine and Danube force barges to sail partially loaded or halt operations, prompting operators to invest in shallow-draught or multi-hull designs.
What regulations are influencing fleet modernisation?
FuelEU Maritime and the extension of the EU Emissions Trading System require progressive emission reductions, accelerating adoption of Euro 6, LNG, and electric propulsion technologies.
Are inland waterways being used for urban logistics?
Yes, pilot projects in Paris, Amsterdam, and Antwerp demonstrate how small electric or autonomous barges can alleviate road congestion and meet last-mile delivery needs.