
Market Overview
| Study Period | 2020 - 2031 |
|---|---|
| Forecast Data Period | 2026 - 2031 |
| Base Year Market Size (2025) | USD 26.6 Billion |
| Market Size (2026) | USD 31.15 Billion |
| Market Size (2031) | USD 68.45 Billion |
| Growth Rate (2026 - 2031) | 17.09 % |
| Market Concentration | Medium |
Major Players *Disclaimer: Major Players sorted in no particular order Image © Mordor Intelligence. Reuse requires attribution under CC BY 4.0. | |
Europe Green Data Center Market Analysis by Mordor Intelligence
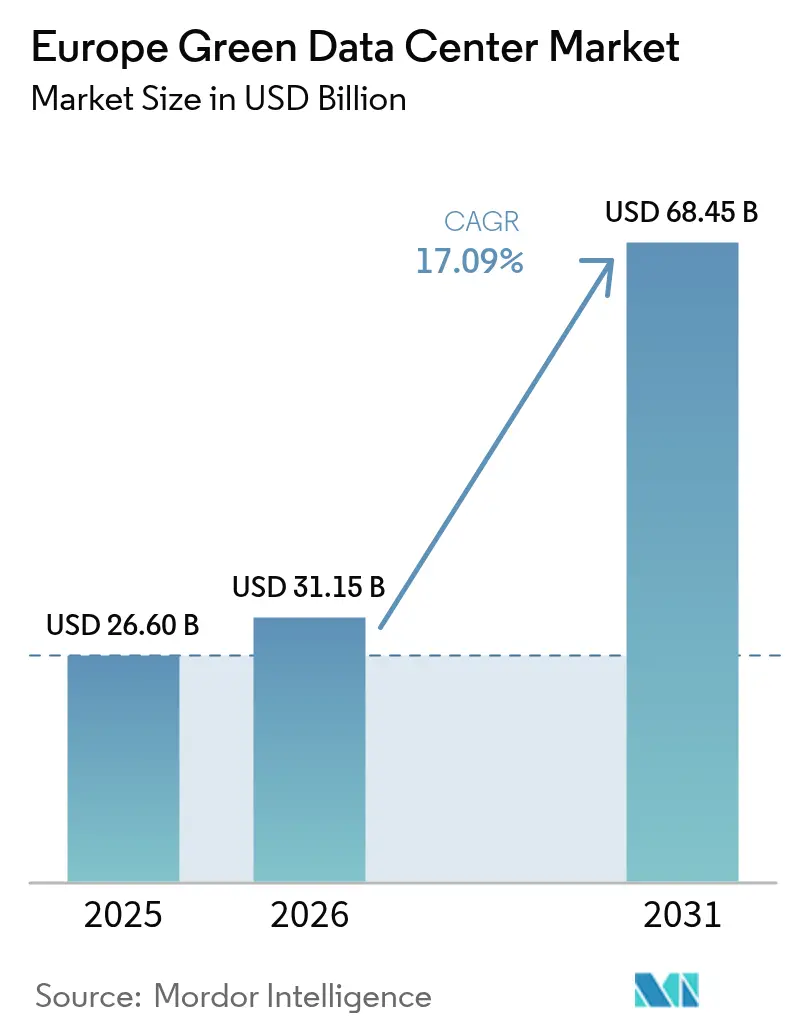
The Europe green data center market size was valued at USD 26.6 billion in 2025 and estimated to grow from USD 31.15 billion in 2026 to reach USD 68.45 billion by 2031, at a CAGR of 17.09% during the forecast period (2026-2031). Heightened regulatory ambition under the EU Green Deal, hyperscale investments in next-generation AI infrastructure, and enterprise-wide digitization are reinforcing a sustained demand curve that supports both capacity growth and sustainability innovation. Operators are steering capital toward ultra-efficient power and cooling technologies as the Energy Efficiency Directive requires facilities above 500 kW to report energy metrics and meet renewable-energy thresholds. Nordic incentives for power-purchase agreements (PPAs) ensure low-carbon electricity and enable operators to post power-usage-effectiveness (PUE) ratios close to the physical minimum, while FLAP-D hubs remain attractive for interconnection density despite grid backlogs. Service providers that bundle monitoring, lifecycle management, and compliance reporting are expanding faster than hardware-centric peers, reflecting the shift from one-off builds to continuous optimization. Vendors able to align Scope 3 reporting support with high-density liquid cooling stand to capture the strongest upside.
Key Report Takeaways
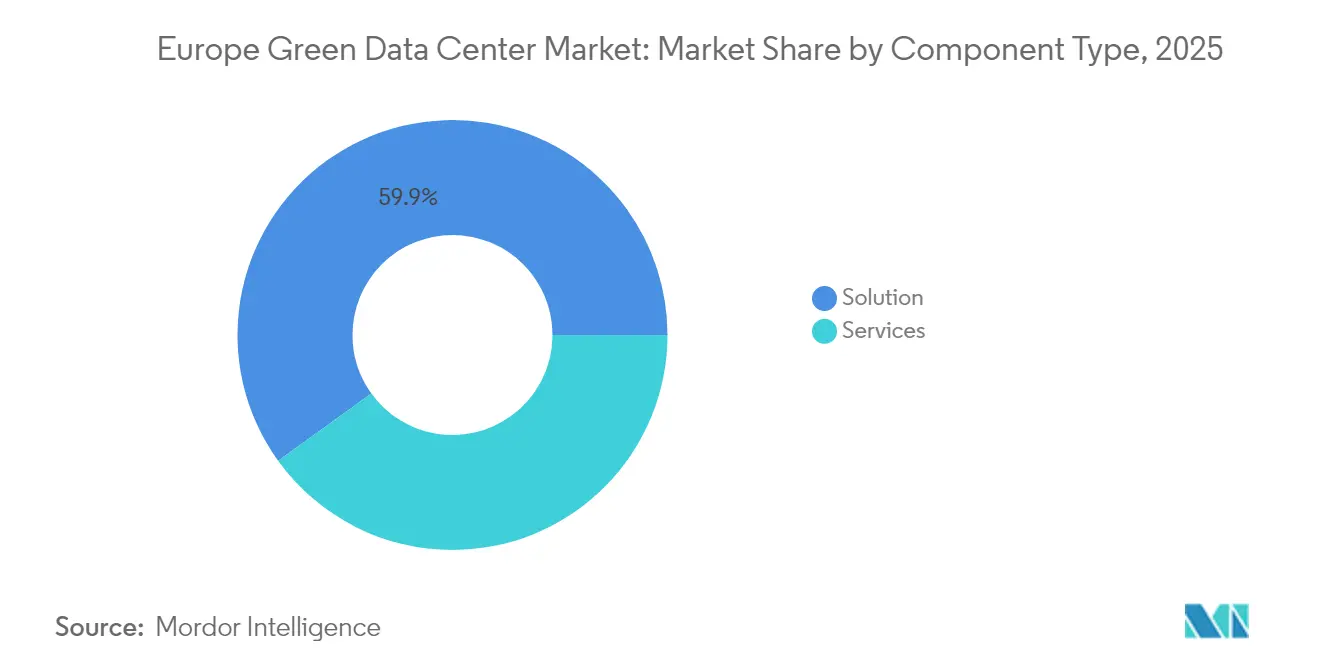
- By component, solutions captured 59.94% revenue share in 2025; services are projected to climb at a 21.66% CAGR to 2031.
- By data center type, hyperscalers/cloud service providers held 34.85% of the Europe green data center market share in 2025 and are advancing at a 23.79% CAGR through 2031.
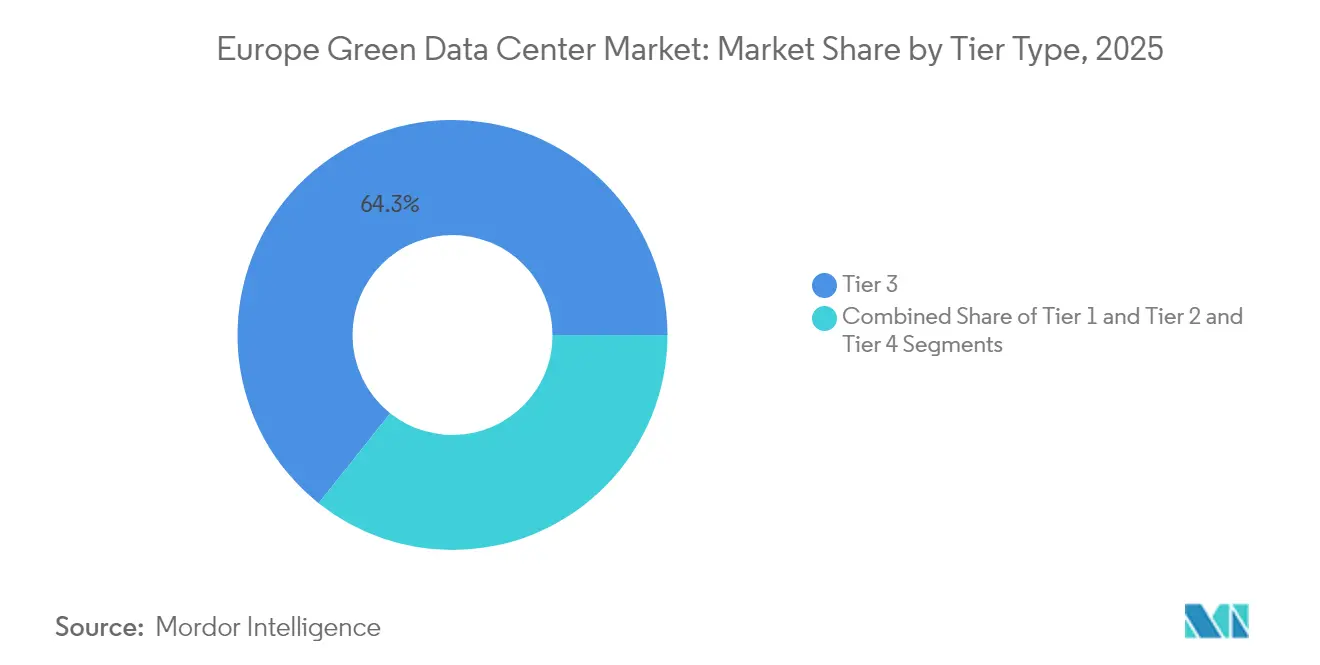
- By tier type, Tier 3 facilities accounted for 64.30% of the Europe green data center market size in 2025, while Tier 4 leads growth at a 23.07% CAGR to 2031.
- By industry vertical, telecom & IT held 27.85% of the Europe green data center market size in 2025; government deployments are growing fastest at 24.25% CAGR.
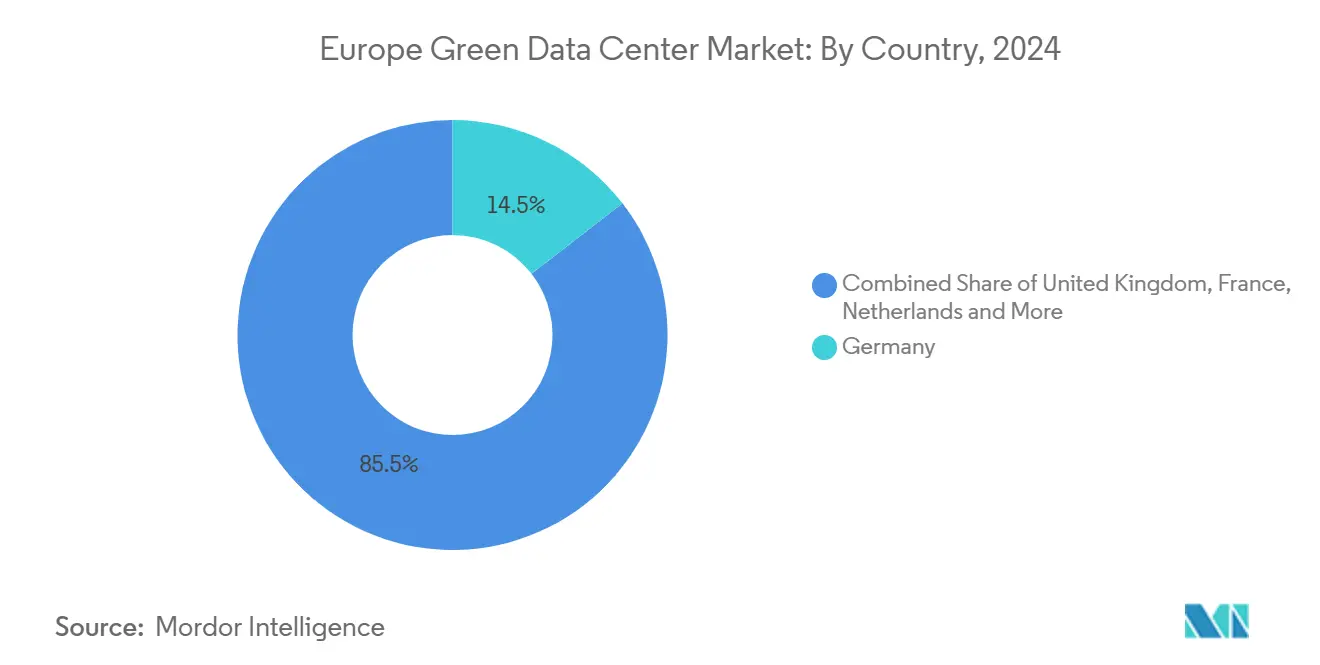
- By country, Germany led with 14.35% market share in 2025; Ireland is the fastest-growing geography at 18.75% CAGR.
Note: Market size and forecast figures in this report are generated using Mordor Intelligence’s proprietary estimation framework, updated with the latest available data and insights as of 2026.
600+
data center reports by Mordor Intelligence
covering construction, AI facilities, servers and more - global, regional or country-level, right down to individual data center components
Market Trends and Insights
Drivers Impact Analysis of Europe Green Data Center Market*
| Driver | (~) % Impact on CAGR Forecast | Geographic Relevance | Impact Timeline |
|---|---|---|---|
| Cloud and Big-Data Workload Surge | +4.2% | Global, concentrated in FLAP-D markets | Short term (≤ 2 years) |
| EU Green Deal and Fit-for-55 Mandates | +3.8% | EU-wide, strongest in Germany and Nordic countries | Medium term (2-4 years) |
| Hyperscale and Edge Build-outs in FLAP-D Hubs | +3.1% | Frankfurt, London, Amsterdam, Paris, Dublin | Medium term (2-4 years) |
| Nordic PPAs Enabling Ultra-Low PUE | +2.4% | Sweden, Norway, Denmark, Finland | Long term (≥ 4 years) |
| District-Heating Waste-Heat Subsidies | +1.8% | Germany, Denmark, Netherlands | Long term (≥ 4 years) |
| Scope-3-Focused Green SLAs Demand | +1.3% | EU-wide, led by multinational enterprises | Medium term (2-4 years) |
| Source: Mordor Intelligence | |||
Cloud & Big-Data Workload Surge
AI and machine-learning tasks consumed 8% of data-center electricity in Europe during 2024 and may hit 20% by 2028, prompting rapid adoption of liquid cooling that removes heat 15–25 times faster than air.[1] Microsoft earmarked USD 2.5 billion for an AI-focused campus in Leeds hosting more than 20,000 GPUs by 2026, signalling how hyperscalers reshape facility architecture around high-density racks. Smaller inference workloads at the edge are spawning distributed micro-sites tethered to central training clusters, reducing latency while sustaining renewable-energy targets. Enterprise cloud strategies now include quantitative sustainability metrics; 38% of European operators invested in greener facilities in 2024 to balance AI growth with carbon-reduction pledges. Liquid-ready designs and rack-level heat reuse deliver both performance and compliance benefits that reinforce the driver’s position in near-term demand formation.
EU Green Deal & Fit-for-55 Mandates
The Energy Efficiency Directive obliges data centers above 500 kW to publish annual resource metrics and to cut energy consumption by 11.7% by 2030. Germany’s Energy Efficiency Act sets a PUE ceiling of 1.2 for new builds from July 2026 and a 100% renewable-electricity mandate by 2027.[2] A pan-EU sustainability-rating framework entering force in September 2024 enables operators to benchmark performance and secure procurement preference from corporates bound by the Corporate Sustainability Reporting Directive. Compliance spending is unlocking product innovation: Equinix is piloting waste-heat networks that warm neighboring homes while lowering facility PUE.[3] Operators able to evidence transparent metrics gain a competitive edge in enterprise RFPs, intensifying adoption of automated monitoring and lifecycle-carbon accounting platforms.
Hyperscale & Edge Build-outs in FLAP-D Hubs
Frankfurt, London, Amsterdam, Paris, and Dublin host the densest interconnection fabrics in Europe, attracting disproportionate hyperscale capital. Digital Realty’s USD 8.4 billion integration of Interxion enlarged an already expansive European estate to 112 facilities, consolidating sustainability know-how and cross-market power-procurement leverage. Equinix financed expansion through EUR 1.15 billion in green bonds in 2024, lifting its cumulative sustainable-debt tally to USD 6.9 billion. Although grid queues are lengthening, operators are pivoting toward second-tier cities like Madrid and Milan, while edge nodes inside urban cores provide ultra-low-latency compute. Interconnection density in FLAP-D helps to minimize duplicate capacity, cutting energy per transaction and underscoring the hubs’ structural advantage.
Nordic PPAs Enabling Ultra-Low PUE
Abundant hydro, wind, and low ambient temperatures position the Nordic cluster as Europe’s energy-efficient stronghold. Amazon committed EUR 700 million to Finnish wind projects totaling 472 MW capacity, the country’s largest private renewable investment, to fuel regional data-center demand. Swedish photovoltaic additions doubled to 1,600.9 MW in 2024, offering new contracting choices for operators. Denmark’s corporate-PPA framework could see 36% of industrial electricity supplied via long-term renewable contracts by 2040. Integrated Nordic power markets permit cross-border renewable swaps, enabling Google to run Finnish data halls on Swedish wind power. Resulting PUE scores near 1.1 strengthen the region’s draw for AI workloads and carbon-neutrality programs.
Restraints Impact Analysis of Europe Green Data Center Market*
| Restraint | (~) % Impact on CAGR Forecast | Geographic Relevance | Impact Timeline |
|---|---|---|---|
| High CAPEX for Liquid-Cooling and On-site RE | -2.1% | Global, acute in retrofit scenarios | Short term (≤ 2 years) |
| Grid-Connection Delays in Power-Scarce Hubs | -1.8% | UK, Germany, Netherlands | Medium term (2-4 years) |
| Embodied-Carbon Steel and Concrete Scrutiny | -1.2% | EU-wide, strongest in Germany and Nordic countries | Long term (≥ 4 years) |
| Sustainable-DC Engineering Talent Shortage | -0.9% | FLAP-D markets, spreading to secondary cities | Medium term (2-4 years) |
| Source: Mordor Intelligence | |||
High CAPEX for Liquid-Cooling & On-site RE
Direct-to-chip and immersion systems cost 20–40% more than air cooling despite life-cycle savings, stretching payback timelines for operators lacking low-cost capital. AI racks topping 20 kW magnify the need for these upgrades, yet retrofit works demand floorplate reconfiguration, electrical refits, and staff reskilling. On-site solar or battery installations face six-month permitting windows, complicating schedules and raising holding costs. Larger multinationals mitigate expense through sustainability-linked loans, but smaller colocation players risk margin compression until financing innovation or partnership models neutralize upfront burdens.
Grid-Connection Delays in Power-Scarce Hubs
German applicants face connection dates extending to 2031, while UK projects report 13-year waits in constrained zones. Ireland’s pause on Dublin-area projects until 2028 underscores how supply-chain digitization collides with national carbon budgets. Regulators such as Germany’s BNetzA are exploring “repartition” capacity auctions to replace first-come, first-served rules. In the interim, operators deploy large battery systems and flexible cooling logic to shave peak loads, yet opportunity losses accumulate as demand shifts to less-congested markets. Grid modernisation pace will heavily influence the Europe green data center market’s geographic redistribution over the medium term.
*Our forecasts treat driver/restraint impacts as directional, not additive. The impact forecasts reflect baseline growth, mix effects, and variable interactions.
Europe Green Data Center Market Segment Analysis
By Component:
Solutions Lead Infrastructure ModernizationSolutions revenue reached USD 15.94 billion in 2025, equal to 59.94% of overall expenditure, as operators procured efficient power trains, high-density servers, and advanced cooling to satisfy Directive-driven PUE benchmarks. Europe green data center market size for services registered USD 10.66 billion and is on track for a 21.66% CAGR to 2031, reflecting surging demand for carbon accounting, lifecycle monitoring, and regulatory advisory. Dedicated system-integration practices align liquid and air cooling within retrofit footprints, compressing migration time while raising resource efficiency. Continuous monitoring via data-center-infrastructure-management (DCIM) software automates energy reporting, a mandatory prerequisite for transparency audits under the EU Green Deal. As Scope 3 tracking obligations deepen, professional-services portfolios focused on supplier audits and embodied-carbon assessments capture an incremental share, reaffirming a services-led maturity phase that complements hardware refresh cycles.

By Data Center Type:
Hyperscalers Drive Sustainability InnovationHyperscalers held 34.85% of 2025 revenue and expand at 23.79% CAGR, capitalizing on balance-sheet strength to lock renewable contracts and trial liquid-cooling at scale. The Europe green data center market size attributed to hyperscale campuses is projected to exceed USD 33.3 billion by 2031, with sustainability clauses embedded in power-purchase agreements anchoring long-term competitiveness. Colocation providers differentiate by bundling renewable credits and waste-heat-reuse schemes that appeal to mid-sized enterprises. Enterprise on-premises footprints continue to shrink, yet firms with latency-sensitive workloads maintain hybrid models that lean on edge nodes outfitted with efficient cooling. Edge providers deploy 250 kW–1 MW modules near population centers, ensuring regulatory compliance through recycled-air economizers and modular battery storage. Larger hyperscalers publicize construction-phase carbon cuts, such as AWS adopting low-carbon steel in Sweden to trim embodied emissions by up to 70%, setting a bar smaller competitors strive to match.
By Tier Type:
Tier 4 Growth Reflects Mission-Critical SustainabilityTier 3 dominated 2025 with 64.30% share, yet Tier 4 growth of 23.07% CAGR to 2031 signals demand for concurrent maintainability alongside strict sustainability targets. The Europe green data center market share for Tier 4 is forecast to reach 18.75% by 2031 as healthcare, financial, and public-sector workloads adopt N+N redundancy and liquid cooling that together lower PUE toward 1.15. Operators classify premium suites as “Green Tier” offerings where uptime and carbon neutrality co-exist, using immersion cooling and heat-recovery chillers to reclaim thermal energy for municipal heating loops. Meanwhile, Tier 1 and 2 sites address cost-sensitive or archival workloads but face retrofit pressure as the Energy Efficiency Directive tightens minimum standards, nudging even modest facilities toward more efficient power architectures.
By Industry Vertical:
Government Acceleration Drives Public-Sector TransformationTelecom & IT retained leadership at 27.85% revenue in 2025, supported by carriers’ need for regional interconnection and compliance with net-zero roadmaps. Deutsche Telekom reduced network energy intensity 20% between 2021 and 2024 by migrating workloads into ultra-efficient regional hubs. Government data-center demand climbs 24.25% CAGR as agencies digitalize citizen services and must certify environmental stewardship. Europe green data center industry adoption across public entities often mandates waste-heat reuse and 100% renewable sourcing, pushing suppliers to secure guarantees of origin. Financial-services operators in Frankfurt and Paris incorporate AI fraud-detection engines that depend on low-latency green compute, while healthcare and life-science tenants reference EU patient-data localization rules that favor domestic, certified facilities. Manufacturing firms intertwine facility procurement with broader industrial electrification plans, occasionally piping server waste heat into process loops that trim fossil-fuel boilers.
Geography Analysis
Germany Green Data Center Market
Germany leads the Europe green data center market with 14.35% share, drawing on strong fiber, central location, and a defined legislative roadmap. Operators in Frankfurt executed pilot district-heat schemes that export server warmth to residential grids, easing local fossil demand and trimming facility PUE toward 1.2. Connection backlogs remain a hurdle, but regulator proposals for capacity auctions could release stranded power blocks and stabilize expansion schedules.
Ireland Green Data Center Market
Ireland follows an outsized growth path at 18.75% CAGR to 2031. Although wholesale power constraints triggered a moratorium on new Dublin connections, the existing base of 82 sites continues to scale through efficiency upgrades and renewable PPAs. Data centers contributed roughly 21% of Ireland’s 2024 electricity demand, yet long-term PPA frameworks under discussion aim to align additional capacity with incremental offshore wind projects. Scarcity of new permits elevates the value of licensed footprints, pushing operators to maximize rack density and waste-heat capture.
Nordics Green Data Center Market
Nordic countries combine near-carbon-free grids with cool ambient temperatures, giving Sweden, Norway, Denmark, and Finland the continent’s lowest average PUE scores. Microsoft’s USD 3.2 billion Swedish AI cluster relies on 100% renewable energy contracts and commits surplus heat to local district networks. Amazon’s 472 MW Finnish wind program and Google’s cross-border renewable swaps highlight the region’s integrated power markets. Denmark’s CPPA framework and Norway’s waste-heat rules encourage projects that both meet uptime needs and extend climate benefits outside facility walls, solidifying Nordic leadership in green compute exports to mainland Europe.
Regulatory Landscape
EU policy is tightening sustainability disclosure and comparability for data centers under the Energy Efficiency Directive (EU) 2023/1791. The directive requires facilities at or above 500 kW installed IT power demand to report annual energy and sustainability metrics (including PUE and related indicators) to a European database through national schemes or direct reporting. This shifts compliance from voluntary claims to standardized, auditable KPI publication, affecting customer procurement and colocation contracting where operator and tenant data must be aggregated into reporting outputs.
The EU has also moved from reporting toward a common rating approach via Commission Delegated Regulation (EU) 2024/1364, which sets the first-phase measurement methodologies and KPIs for a Union rating scheme. In March 2026, the European Commission launched a call for feedback on the data center rating scheme, with work continuing on a second-phase regulation that includes electronic labels and is scheduled for adoption in Q2 2026. This reinforces pressure for verified performance, renewable sourcing evidence, and waste-heat reuse visibility across Member States.
Value Chain Analysis
The Europe green data center value chain covers equipment and materials suppliers (efficient power and cooling systems, servers, networking equipment, and management software), engineering and system integration, construction and commissioning partners, and then ongoing operations where monitoring services and professional services support continuous optimization and compliance reporting. Energy procurement is a core value-chain lever, with operators using renewable PPAs and guarantees of origin, while utilities and grid operators constrain time-to-power in power-scarce hubs. As a result, connection planning and flexibility solutions such as battery systems and advanced controls become an increasingly upstream dependency.
Downstream, enterprises, cloud and hyperscale buyers, and public-sector tenants embed sustainability metrics into RFPs, which raises the role of DCIM, carbon accounting, and audit-ready reporting services alongside physical infrastructure. Heat-reuse integration is also emerging as a distinct operating layer connecting operators with municipalities and district-heating companies. For example, Equinix and A2A launched a Milan partnership to recover data center heat for the local district heating network, showing how waste heat can be structured as an operating deliverable rather than a by-product. As EU reporting and rating frameworks mature, the value chain is tilting toward bundled offerings that combine high-density, liquid-cooling-ready design with metering, data governance, and compliance workflows that can be maintained across multi-site portfolios.
Competitive Landscape
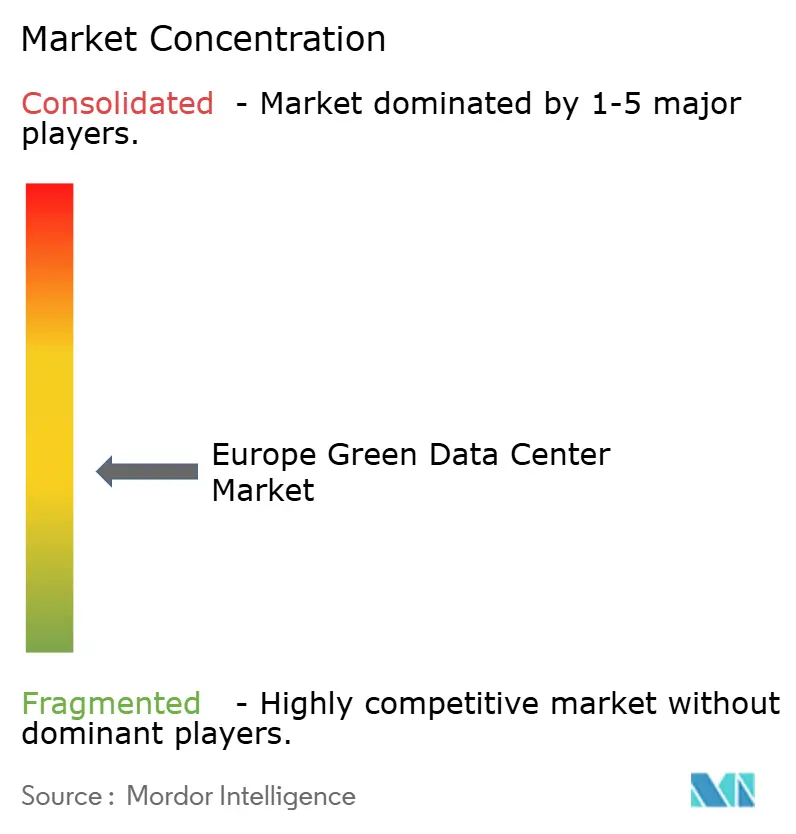
Europe green data center market is fragmented as vendors adopt inorganic growth strategies such as strategic partnerships and mergers and acquisitions to expand the market foothold. Key players are IBM, Cisco Systems, Inc., Dell Technologies Inc., etc.
In September 2022, A new data center of OVHcloud is being constructed in Limburg, Germany. The new building, which was first announced in April 2022, would have more than 6,000 square meters (64,580 sq ft) of floor space available for 40,000 servers, which OVH stated equates to a storage capacity of 100 exabytes. OVH highlighted the green qualities of the new facility. According to the company, the new data center will get 100 percent of its electricity from renewable sources. Also, OVHcloud will be using its patented water cooling technology, waste heat from the servers will be used for underfloor heating in the adjoining offices, and will have an ecological green roof with plants on the facades and trees on the site.
In July 2022, In Hanu, Germany, a sizable data center park is being planned by European logistics real estate company P3 Logistic Parks. At least eight data center modules will be developed on a building area of about 200,000 square meters (2.1 million square feet) over 10 years, with an electrical supply of 180 megawatts (MW) at the site. Construction will be done in phases. The on-spec campus, according to P3, would be developed and run sustainably, and it will be powered entirely by renewable energy.
Europe Green Data Center Industry Leaders
-
Equinix, Inc.
-
Digital Realty Trust, Inc.
-
NTT Global Data Centers EMEA GmbH
-
OVH Groupe SAS
-
Interxion Holding N.V.
- *Disclaimer: Major Players sorted in no particular order
Europe Green Data Center Market Companies Covered in this Report
- Equinix Inc.
- Digital Realty Trust Inc.
- NTT Global Data Centers EMEA GmbH
- Schneider Electric SE
- Fujitsu Ltd.
- Cisco Systems Inc.
- Dell Technologies Inc.
- Hewlett Packard Enterprise Co.
- IBM Corporation
- Eaton Corporation plc
- Vertiv Holdings Co.
- OVH Groupe SAS
- Interxion Holding N.V.
- Vantage Data Centers LLC
- Bulk Infrastructure AS
- Green Mountain AS
- EcoDataCenter AB
- Stack Infrastructure Inc.
- Iron Mountain Inc.
- Deep Green Data Centres Ltd.
- Verne Global Ltd.
Market Opportunities and Future Outlook
Compliance-led transparency creates whitespace for platforms and services that convert mandatory reporting into operational advantages, especially monitoring, lifecycle management, and KPI assurance for facilities above the 500 kW threshold under the Energy Efficiency Directive. The EU move toward a common rating scheme and labeling workstream, with the first phase defined by Delegated Regulation (EU) 2024/1364 and additional Commission action underway in 2026, increases demand for standardized measurement, sub-metering, and data pipelines that colocation operators can extend to tenants without disrupting contractual boundaries.
Power access and grid constraints are also pushing new site and design models that tie green compute to dedicated renewable generation and flexibility assets rather than relying only on conventional grid expansion. Project announcements reflect this direction, including Pantheon Atlas plans for a large hyperscale AI campus in Croatia designed around solar and battery storage, and Pure Data Centres Group launching a 550 MW AI campus project in Finland. These moves point to growing interest in renewable-rich geographies that can support high-density compute with lower-carbon electricity. At the same time, partnerships exploring direct coupling between data centers and offshore wind, such as Vattenfall with Project Enki and ABB, show an active route to integrate compute loads with renewable build-outs and address curtailed power. Heat-reuse projects, for example Equinix and A2A in Milan, also illustrate a pathway to improve local acceptance and economics by delivering district energy benefits.
Recent Industry Developments in Europe Green Data Center Market
- July 2026: Equinix and A2A launched a strategic partnership in Milan to recover waste heat from Equinix data centers and feed it into A2A’s district heating network. The initiative frames heat reuse as a deliverable linked to urban infrastructure, strengthening the case for green data center design in Southern Europe.
- June 2026: Equinix trialled a hydrogen power solution for backup systems at its DB3 data center in Dublin. The trial expands the set of lower-carbon resiliency options available to operators in a market facing tight power constraints and heightened scrutiny of onsite generation choices.
- June 2025: TikTok announced a EUR 1 billion investment in a data center site in Kouvola, Finland, as part of its wider European data-security program. The investment reinforces Nordic momentum where renewable power availability and cooler climates support low-PUE operations for large-scale deployments.
Europe Green Data Center Market Report Scope and Research Methodology
Market Definition and Coverage
For this study, the Europe green data center market covers revenue generated from operating data center facilities designed and run to reduce environmental impact, mainly through better energy efficiency, lower carbon power use, and improved cooling and power systems.
Scope exclusions: it excludes land and building shell real estate transactions and purely construction-phase spending that is not tied to live facility operations.
Segments Covered in This Report
- By Component
- By Service
- System Integration
- Monitoring Services
- Professional Services
- Other Services
- By Solution
- Power
- Cooling
- Servers
- Networking Equipment
- Management Software
- Other Solutions
- By Service
- By Data Center Type
- Colocation Providers
- Hyperscalers/Cloud Service Providers
- Enterprise and Edge
- By Tier Type
- Tier 1 and 2
- Tier 3
- Tier 4
- By Industry Vertical
- Healthcare
- Financial Services
- Government
- Telecom and IT
- Manufacturing
- Media and Entertainment
- Other Verticals
- By Country
- Germany
- United Kingdom
- France
- Netherlands
- Ireland
- Norway
- Sweden
- Denmark
- Spain
- Italy
- Russia
- Rest of Europe
Data Sources, Market Sizing, and Validation
Desk Research
We start with public data that frames how fast data center demand is rising in Europe and what sustainability rules mean in practice. Sources we typically use include European Commission policy pages, Eurostat energy and industry statistics, the European Environment Agency, national grid operators and energy regulators, and standards bodies such as ISO and ETSI for efficiency and reporting guidance.
Then the market logic is grounded using operator and vendor public disclosures such as annual reports, sustainability reports, and facility announcements, plus trusted industry press and association updates. In parallel, we use a paid subscription for company financials and news screening, and another paid patent database to track cooling, power management, and energy efficiency innovation signals that can shift adoption. The sources listed here are illustrative only, and additional references were used to collect, cross-check, and clarify inputs.
Primary Interviews and Surveys
Next, we validate the market mechanics through expert interviews and structured surveys with data center operators, colocation providers, cloud and enterprise buyers, and supporting ecosystem participants such as power and cooling specialists. We make sure the respondent mix covers key European sub-regions, so views reflect differences in grid constraints, renewable availability, and regulatory interpretation, and then we use the feedback to tune assumptions and address gaps identified in desk research.
Distribution of primary research fieldwork respondents
| Company type | Respondent position |
|---|---|
| Top tier: 38% | CXOs: 13% |
| Mid tier: 47% | Functional/Unit leaders: 33% |
| Smaller Players: 15% | Managers: 54% |
Market-Sizing & Forecasting
Sizing is built using a top-down demand reconstruction where regional data center activity is translated into addressable green spend, and then filtered through adoption and eligibility rules tied to efficiency and sustainability criteria. To keep the model tied to real market signals, we corroborate totals with selective bottom-up checks such as sampled facility capacity additions multiplied by indicative spend per MW, plus cross-checks against disclosed revenue mixes from relevant participant groups.
Inputs used in the model include power and rack density trends, facility PUE improvement trajectories, renewable electricity procurement intensity, electricity price levels and volatility, and country-level capacity expansion pipelines. Where bottom-up evidence is incomplete for smaller countries, gaps are handled using proxy ratios derived from power availability, announced capacity, and normalized utilization assumptions, and then stress-tested in interviews. Forecasting is done using scenario analysis, where variables like power price outlook, renewable supply availability, and policy enforcement intensity are adjusted, and then reviewed with expert consensus to keep the forward path realistic.
Data Validation & Update Cycle
Outputs are checked through triangulation across multiple signals, and any sharp step-change is investigated before numbers are finalized. We run variance checks by country and by year, compare implied growth with capacity and power constraints, and then apply a second analyst review so assumptions stay consistent across the model.
The report is refreshed on an annual cycle, and interim updates are made when material events occur such as major policy changes, hyperscale build announcements, or meaningful shifts in power pricing. Before delivery, a final pass is completed so the dataset and assumptions reflect the most recent public releases and field feedback.
Mordor Intelligence's Europe Green Data Center Market Size Compared Against Other Published Estimates
Published market sizes for green data centers in Europe can look far apart, even when the topic sounds the same. This usually happens because groups count different revenue pools, use different timing for currency and inflation handling, and apply different rules for what qualifies as "green" versus simply "new" or "efficient".
By tracking consistent facility-level eligibility rules and refreshing currency timing and electricity-related assumptions, Mordor Intelligence keeps the estimate aligned to live Europe data center operating revenues that meet defined sustainability criteria, instead of mixing in broad data center investment totals or adjacent construction budgets.
Benchmark comparison
| Source | Market Size | Gaps in Research Methodology |
|---|---|---|
| Mordor Intelligence | USD 26.60 B (2025) | |
| Regional Consultancy A | USD 8.88 B (2023) | This estimate is presented as investment value, which can exclude ongoing operating revenues and can also shift timing based on project capex schedules rather than live facility spend. |
| Industry Publisher B | USD 6.50 B (2024) | The narrower total suggests a tighter inclusion set, where only select service and solution revenues are counted, and broader facility-level revenue pools can be left out or split across separate categories. |
The spread in the table mainly comes from what is being counted, and when it is recognized as market value. When the scope is held to operating revenue from green-qualified facilities and cross-checked against capacity and power indicators, the resulting number is easier to trace, repeat, and update as the market changes.
Key Questions Answered in the Report
What is the current value of the Europe green data center market?
The market generated USD 31.15 billion in 2026 and is projected to reach USD 68.45 billion by 2031, reflecting a 17.09% CAGR.
Which segment grows fastest in the Europe green data center market?
Services, encompassing sustainability consulting and monitoring, expand at 21.66% CAGR through 2031.
Why are hyperscalers critical to European green data-center growth?
They hold 34.85% market share, deploy liquid cooling at scale, and lock multi-gigawatt renewable PPAs that accelerate sustainable capacity additions.
How do EU regulations impact data-center design?
The Energy Efficiency Directive and national laws such as Germany’s EnEfG impose strict PUE and renewable quotas, pushing operators toward ultra-efficient power and cooling systems.
Which geography offers the best conditions for low-carbon data centers?
Nordic countries combine near-100% renewable grids, cool climates, and supportive PPA frameworks, enabling PUE scores near 1.1 and attracting major hyperscale projects.
What is the chief barrier slowing deployment in FLAP-D hubs?
Prolonged grid-connection backlogs—in some cases extending to 13 years—delay new builds, forcing operators to pursue alternative sites or interim battery solutions.
More reports on data centers
- Data Center Construction Market Construction across the global market, covering tier, facility size and facility type.
- Artificial Intelligence (AI) Data Center Market AI facilities worldwide, split by facility type, component and tier.
- Data Center Server Market Servers worldwide, split by tier, facility size and facility type.
- Spain Data Center Power Market Power systems in Spain, split by component, facility type and facility size.
- Italy Data Center Rack Market Racks demand across Italy, covering rack size, rack height and rack type.
- Germany Data Center Cooling Market Germany's cooling, split by cooling technology, type and end-user industry.
- Japan Data Center Cooling Market Japan's cooling, split by cooling technology, type and end user vertical.
- Europe Data Center Construction Market Europe construction, split by tier, facility size and facility type.
- Europe Data Center Interconnect Market Europe's interconnect, split by facility size and tier.
- Data Center RFID Market Asset tracking worldwide, split by component, tag type and data-center type.
- Saudi Arabia Data Center Power Market Saudi Arabia power systems, split by component, facility type and facility size.