
Market Overview
| Study Period | 2020 - 2031 |
|---|---|
| Forecast Data Period | 2026 - 2031 |
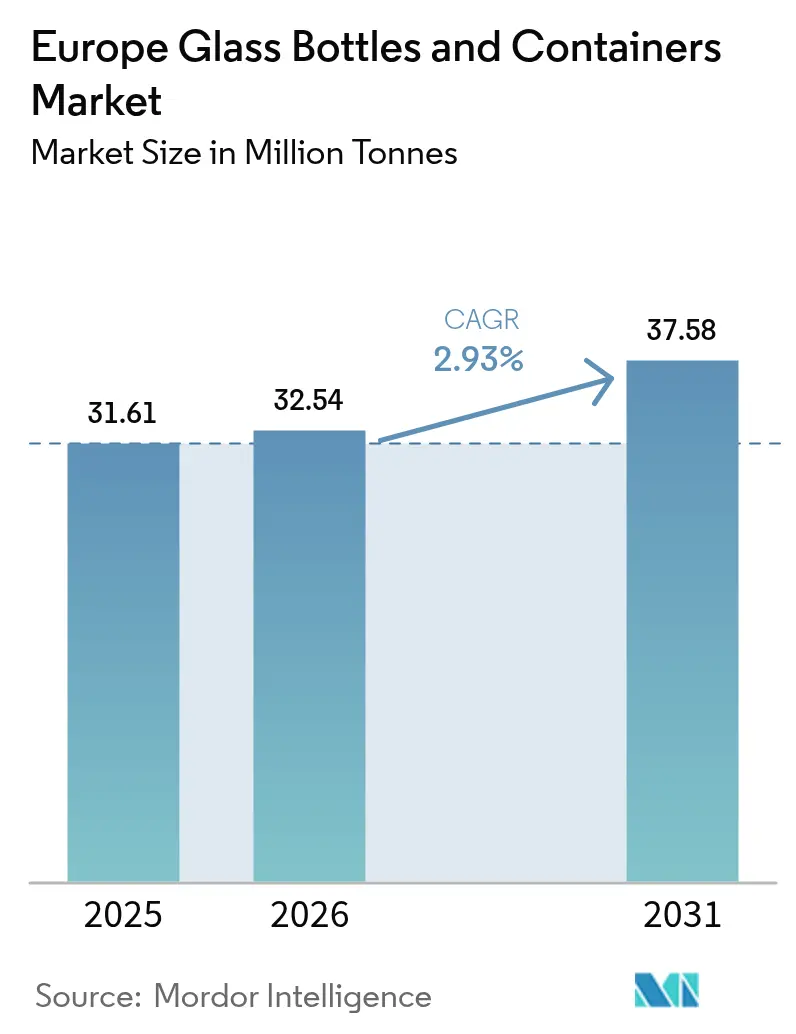
| Base Year Market Size (2025) | 31.61 Million tonnes |
| Market Volume (2026) | 32.54 Million tonnes |
| Market Volume (2031) | 37.58 Million tonnes |
| Growth Rate (2026 - 2031) | 2.93% CAGR |
| Market Concentration | Low |
Major Players *Disclaimer: Major Players sorted in no particular order Image © Mordor Intelligence. Reuse requires attribution under CC BY 4.0. | |
Europe Glass Bottles And Containers Market Analysis by Mordor Intelligence
The Europe Glass Bottles and Containers market size is expected to grow from 31.61 million tonnes in 2025 to 32.54 million tonnes in 2026 and is forecast to reach 37.58 million tonnes by 2031 at 2.93% CAGR over 2026-2031. Steady gains come from premium beverage, cosmetics, and pharmaceutical applications that offset sluggish mass-volume food and beer demand amid persistently high energy costs. Manufacturers are prioritizing electric, hybrid, and hydrogen-ready furnaces to curb fuel exposure while lightweight bottle designs and higher cullet ratios preserve margins and advance circular-economy goals. Strategic capacity optimization, such as O-I’s planned 7% European reduction by mid-2025, aligns supply with tempered near-term demand, yet long-run competitiveness hinges on technology leadership and regulatory alignment with the EU Green Deal.[1]Greg Morris, “O-I CEO Warns of Further Job Cuts in 2025,” glass-international.com M&A activity continues as producers seek scale in high-value niches; Gerresheimer’s EUR 800 million (USD 904 million) purchase of Bormioli Pharma and Verallia’s EUR 230 million (USD 260 million) acquisition of Vidrala’s Italian unit illustrate this consolidation trend.
Key Report Takeaways
- By end-user, beverages captured 63.35% of the Europe glass bottles and containers market share in 2025.
- By color, the Europe glass bottles and containers market for amber glass is projected to grow at a 3.44% CAGR between 2026-2031.
Note: Market size and forecast figures in this report are generated using Mordor Intelligence’s proprietary estimation framework, updated with the latest available data and insights as of 2026.
Europe Glass Bottles And Containers Market Trends and Insights
Drivers Impact Analysis*
| Driver | (~) % Impact on CAGR Forecast | Geographic Relevance | Impact Timeline |
|---|---|---|---|
| Export-oriented glass-packaged goods add billions to EU GDP | +0.4% | Germany, France, Italy | Medium term (2-4 years) |
| Circular economy and carbon-neutral goals fuel furnace modernization | +0.6% | EU-wide | Long term (≥ 4 years) |
| Consumer preference for recyclable and aesthetic packaging favors glass | +0.5% | Western Europe | Medium term (2-4 years) |
| Pharmaceutical export growth spurs demand for Type I and III vials | +0.3% | Germany, France, Italy, Switzerland | Short term (≤ 2 years) |
| Premiumization in food, beverage, and cosmetics boosts glass demand | +0.4% | Western Europe | Medium term (2-4 years) |
| Sustainability push and plastic bans accelerate glass packaging adoption | +0.5% | EU-wide | Long term (≥ 4 years) |
| Source: Mordor Intelligence | |||
Export-oriented glass-packaged goods add billions to EU GDP
Strong outbound trade in wine, beer, and pharmaceuticals underpins steady offtake for the European glass bottles and containers market, even when domestic consumption cools. Germany shipped 1.45 billion liters of beer in 2024, and Italy’s wine exports rose 5.5% to EUR 8.136 billion, reinforcing glass as a quality signal in global channels. EU labelling rules and geographical indications protect premium products, sustaining volume stability for the European glass bottles and containers market. Beverage exporters accept higher packaging costs because glass ensures product integrity and supports brand storytelling in mature and emerging markets alike. This export orientation mitigates cyclical dips in regional demand and encourages furnace upgrades tailored to high-spec packaging. Producers that win large export contracts often lock in long-term supply agreements, enhancing utilization rates and cash-flow visibility.
Circular economy and carbon-neutral goals fuel furnace modernization
EU emissions trading pressures have propelled investments in 100% electric and hybrid furnaces across the European glass bottles and containers market. Verallia’s Cognac unit runs entirely on renewable power and cuts CO₂ by 60%, while Ardagh’s Obernkirchen NextGen line blends 80% green electricity with 20% gas for a 64% footprint reduction. O-I allocated USD 65 million to electrify its Veauche plant, illustrating how retrofit cycles now prioritize decarbonization over simple capacity additions.[2]Kelsey Lambers, “O-I Glass to Invest $65 Million in Veauche,” o-i.com Hybrid designs lower operational risk by preserving melt stability during grid fluctuations, and they let companies hedge against volatile gas and electricity prices. Long-run carbon costs, including the proposed Carbon Border Adjustment Mechanism, give early adopters a durable cost advantage. Capital-expenditure intensity is high, yet co-funding from EU innovation grants and green bonds eases balance-sheet strain.
Consumer preference for recyclable and aesthetic packaging favors glass
Survey data across multiple EU states show that shoppers increasingly equate glass with premium quality and environmental responsibility; brands respond by migrating hero SKUs from plastic to glass, as seen with Estée Lauder’s Advanced Night Repair serum switch in 2024. Clear storytelling around infinite recyclability and plastic-free credentials helps products secure shelf space at higher price points, particularly in cosmetics and craft spirits. Greater demand for tactile, embossed designs spurs value-added decoration services within the European glass bottles and containers market, while digital printing shortens launch cycles for limited editions. Retailer sustainability scorecards reward recyclable primary packaging, nudging private-label lines toward glass in categories such as premium sauces and honey. Downstream, reverse-logistics pilots for refillable glass further reinforce the material’s green halo and set the stage for broader reuse systems.
Pharmaceutical export growth spurs demand for Type I and III glass vials
Biologics and GLP-1 treatments require chemically inert containers, lifting demand for borosilicate Type I vials produced in Germany, France, and Switzerland. SCHOTT Pharma’s drug-delivery revenue climbed 28% to EUR 439 million in 2024, while Bormioli Pharma’s North American sales jumped 47% after capacity additions. Export-oriented fill-and-finish lines rely on Europe’s tight GMP compliance, keeping domestic furnaces booked for long batch runs. Higher technical standards raise average selling prices and shield margins from commodity swings. Because pharmaceutical furnaces operate on tighter thermal tolerances, producers prioritize electric or oxy-fuel technologies that stabilize temperature and reduce NOx. Growth in injectable therapies anchors a high-value demand base that complements more cyclical beverage volumes.
Restraints Impact Analysis*
| Restraint | (~) % Impact on CAGR Forecast | Geographic Relevance | Impact Timeline |
|---|---|---|---|
| Rising energy prices threaten furnace economics and profit margins | -0.8% | Germany, Eastern Europe | Short term (≤ 2 years) |
| Plastic and metal packaging alternatives erode glass share in mass SKUs | -0.4% | EU-wide | Medium term (2-4 years) |
| Logistics and breakage risks add cost in long-haul distribution | -0.2% | Cross-border trade | Medium term (2-4 years) |
| Cullet collection gaps in Eastern and Southern Europe limit recycled content | -0.3% | Eastern and Southern Europe | Long term (≥ 4 years) |
| Source: Mordor Intelligence | |||
Rising energy prices threaten furnace economics and profit margins
Natural-gas quotes near EUR 40/MWh, quadruple pre-crisis norms, have turned fuel into the dominant cost line for many European furnaces. O-I, Ardagh, and Verallia all flagged EBITDA pressure in 2024–2025 earnings updates, triggering temporary shutdowns and job cuts. High fuel intensity forces companies to hedge aggressively, yet volatile electricity prices complicate risk management for hybrid lines. In the short term, capacity rationalization supports pricing discipline but can also erode economies of scale. Smaller family-owned plants face liquidity strain, accelerating industry consolidation. Until renewable-power purchase agreements mature and grid upgrades progress, energy inflation remains a drag on the European glass bottles and containers market.
Plastic and metal packaging alternatives erode glass share in mass SKUs
Brand owners chasing cost efficiency turn to lightweight PET and aluminum for beer, water, and ready meals, especially in discount channels. Coca-Cola Europacific Partners reported volume softness in Europe but offset it with higher revenue per case by pushing multipack formats that compete directly with value-tier glass. PET’s lower transport weight trims logistics emissions, appealing to sustainability narratives in certain categories. Aluminum benefits from high scrap value and easy curbside recovery, luring brewers tempted by canning-line flexibility. Glass maintains dominance in premium beverages, yet share leakage in mass beer and soft-drink SKUs tempers the broader growth of the European glass bottles and containers market. Producers respond by introducing ultra-light bottles like Vidrala’s 260-gram 75 cl model, but adoption remains gradual in cost-sensitive segments.
*Our forecasts treat driver/restraint impacts as directional, not additive. The impact forecasts reflect baseline growth, mix effects, and variable interactions.
Segment Analysis
By End-user: Beverages Sustain Dominance Despite Premium Diversification
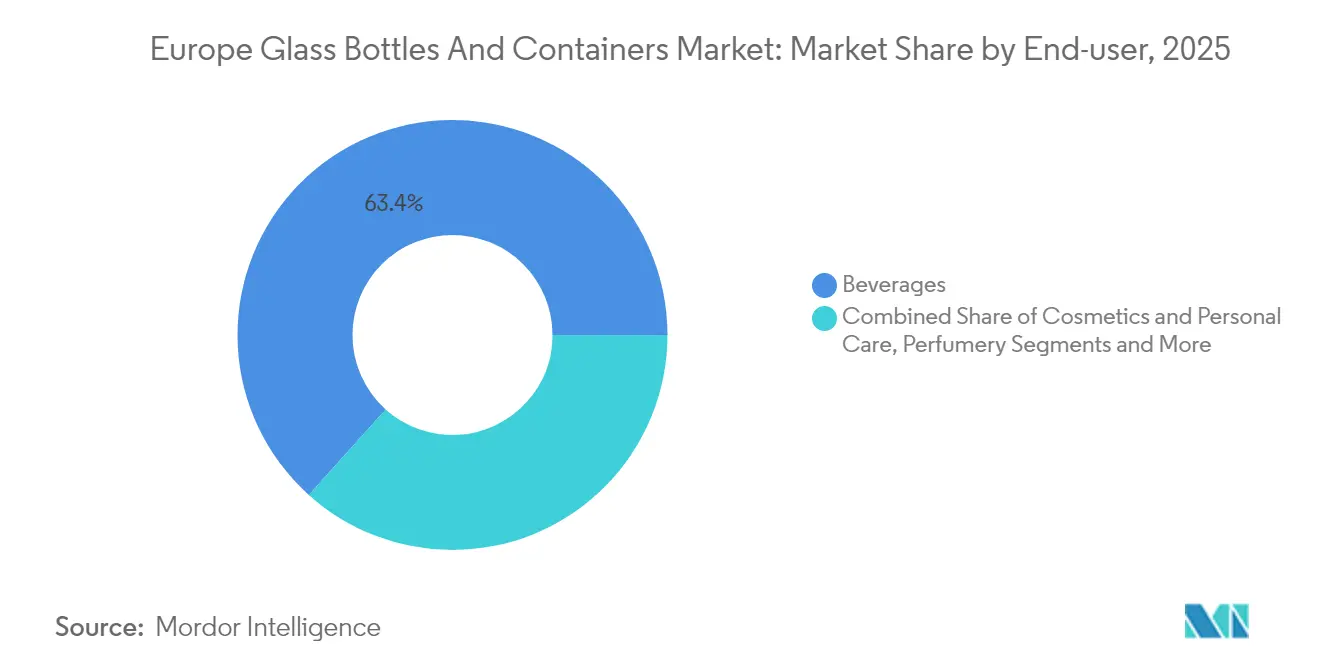
Beverages continued to anchor the European glass bottles and containers market, absorbing 63.35% of 2025 volume and leveraging entrenched wine, beer, and spirits traditions. Wine output volatility in France, where harvests fell 18% in 2024, tempered bottle orders, yet Italy’s EUR 14 billion wine turnover and resilient exports kept southern furnaces busy.Beer volumes slid in Germany, but specialty craft and no-alcohol extensions preserved premium bottle demand, especially for returnable formats backed by deposit schemes. Spirits brands raised average glass weight for flagship expressions, signaling authenticity while adopting lower-carbon furnaces to protect ESG scores. Outside beverages, cosmetics, and personal care are rising fastest at a 3.52% CAGR to 2031, prompted by recyclable-pack commitments and the tactile appeal of glass jars for high-margin skin-care lines.
Growth in pharmaceutical containers complements beverage stability, as Type I vial production commands higher per-ton margins and buffers cyclicality. SCHOTT Pharma’s new Hungary line targets injectable drug demand, pairing ISO 15378 compliance with export-grade quality benchmarks. Food applications remain a staple for sauces, jams, and baby food, though mass-market meal solutions increasingly trial lightweight PET. Collectively, these trends underscore how the European glass bottles and containers market balances heritage beverage volumes with emerging high-value niches, sustaining furnace utilization and underpinning calculated CAPEX in electrification and hybrid melts.


By Color: Flint Leadership Faces Amber Acceleration
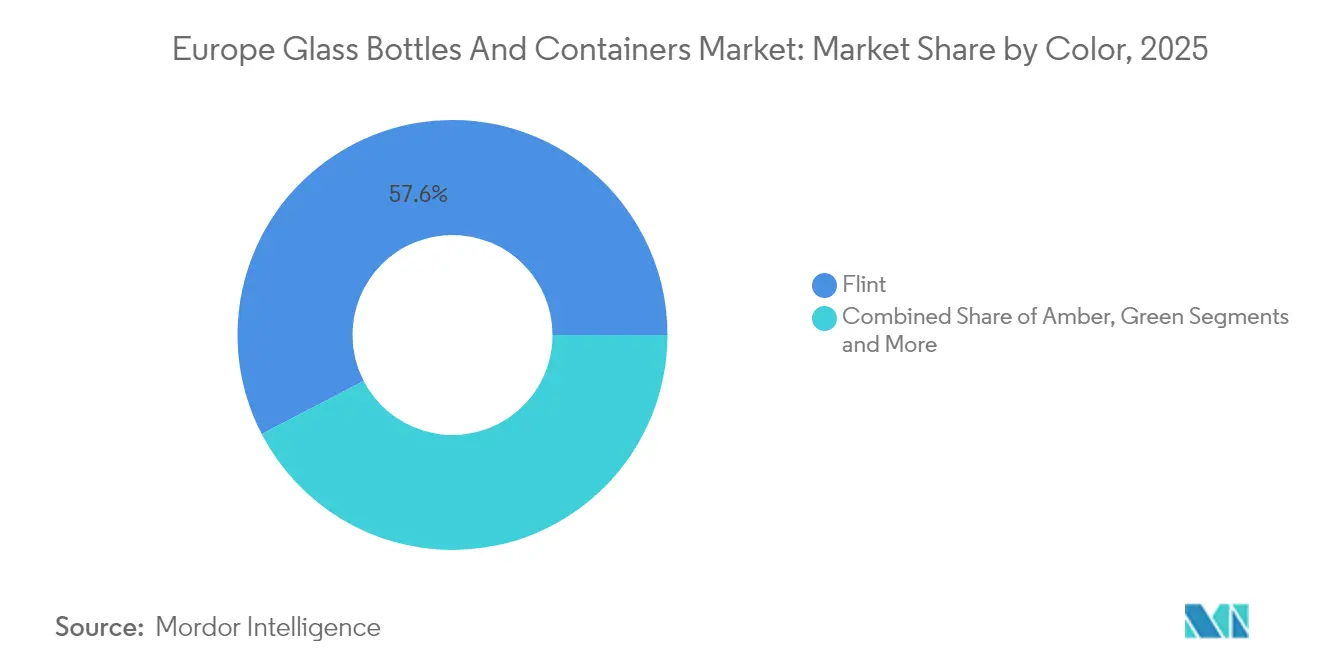
Flint accounted for 57.62% of Europe's glass bottles and containers market share in 2025, favored for its neutrality and compatibility across beverages, cosmetics, and food. Transparent designs support premium shelf appeal, while post-consumer flint cullet is widely available thanks to mature collection systems in Western Europe. Lightweight flint innovations, such as Vetropack’s thermally hardened bottle slated for 2026 launch, illustrate ongoing material optimization.
Amber glass, growing at a 3.44% CAGR, benefits from pharmaceutical vials needing UV protection and from spirits seeking heritage aesthetics. The color’s higher pigment content necessitates dedicated cullet streams, prompting investments in color-sorted collection. Green glass maintains relevance in beer and certain wine SKUs, yet faces pressure from falling beer consumption and climatic impacts on vineyards. Niche colors cobalt, emerald, and black address brand differentiation in limited-edition launches but carry higher changeover costs. Over the forecast, Amber’s specialty value and growing pharmaceutical uptake will narrow the share gap with Flint, though transparency requirements in cosmetics and food preserve Flint’s overall leadership within the European glass bottles and containers market.
Geography Analysis
Germany remains the largest producer, yet a 15.5% shipment decline to 3.89 million tonnes in 2023 spotlights energy-price vulnerability and beer market contraction. Plants in the North Rhine–Westphalia cluster pivot to hybrid furnaces and advance hydrogen trials, backed by regional funding aimed at industrial decarbonization. France, despite historic low wine harvests, benefits from premium export channels and plans a May 2025 deposit scheme that encourages reusable beer and juice bottles, thereby supporting the Europe glass bottles and containers market.
Italy demonstrates balanced demand through robust wine exports and a growing cosmetics contract-manufacturing base in Lombardy and Veneto. Vidrala’s lightweighting breakthroughs at Spanish plants illustrate Iberia’s innovation momentum, while the United Kingdom accelerates low-carbon production at Encirc’s Cheshire complex supported by GBP 22 billion in regional funding.
Eastern Europe Poland, Hungary, and the Czech Republic offers cost-competitive melt capacity and rising cullet availability from EU-funded collection upgrades, attracting converters serving pharmaceutical exports. Switzerland’s market shrank after Vetropack shuttered its St-Prex site, yet the firm’s Austrian expansion keeps Alpine customers supplied. Divergent energy tariffs and recycling policies across member states create a patchwork of cost profiles, influencing cross-border sourcing strategies for multinational brand owners.
Competitive Landscape
The European glass bottles and containers market sits at a moderate consolidation level where the top five producers control roughly 65% of installed capacity. Verallia, O-I, and Ardagh focus on operational excellence, plant network optimization, and decarbonization capex, while Vidrala leverages expertise in lightweight flint to attract premium beverage accounts. Gerresheimer’s entry into pharmaceutical glass through the Bormioli acquisition signals intensifying competition in high-margin healthcare niches.
Strategic technology bets differentiate players. Ardagh’s NextGen hybrid furnace showcases 64% CO₂ cuts, and Verallia’s fully electric Cognac furnace demonstrates scalability for spirits packaging. Smaller regional firms chase niche orders in craft beverages, gourmet foods, and home fragrance, where short runs and custom shapes command premiums despite higher per-unit costs. Distribution specialists such as TricorBraun expand through bolt-on deals to offer pan-European logistics and decoration services, encroaching on traditional converter territory.
R&D budgets target glass chemistry, lightweighting, and digital embossing to lengthen customer lock-in. Sustainability metrics increasingly influence tender awards, making Scope 1 and 2 footprints as critical as price. An annual EUR 620 million industry-wide decarbonization spend indicates that capex races will continue, favoring balance-sheet-strong incumbents and prompting further consolidation among smaller players unable to fund furnace overhauls. Collective bargaining on renewable-power procurement and cullet-pooling consortia emerge as collaborative tactics to smooth cost curves across the Europe glass bottles and containers market.
Europe Glass Bottles And Containers Industry Leaders
O-I Glass, Inc.
Verallia Group
Gerresheimer AG
Vidrala, S.A.
Ardagh Group S.A.
- *Disclaimer: Major Players sorted in no particular order


Market Opportunities and Future Outlook
Regulation-driven redesign and decarbonization are creating near-term whitespace in low-carbon, high-recycled-content container glass as the Packaging and Packaging Waste Regulation (Regulation (EU) 2025/40) moves toward application from August 2026. This increases the premium on compliant packaging design, high cullet utilization, and traceable recycling performance, lifting demand for bottle lightweighting, returnable systems, and decoration solutions that support brand differentiation while meeting minimization requirements. The shift is reinforced by ecosystem signals, including Close The Glass Loop reporting an EU glass packaging collection for recycling rate of 82.2% in 2024, which supports higher cullet ratios and reduces exposure to energy and raw-material volatility.
On the supply side, investment priorities are shifting from greenfield volume to modernization aimed at cutting Scope 1 and 2 emissions and stabilizing furnace economics under rising carbon costs. Verallia inaugurated its first hybrid furnace at Zaragoza, Spain in April 2026 (EUR 63 million project, developed with Sorg), and Vidrala announced a EUR 180 million modernization plan for Caudete, Spain, with refurbishment work starting June 2026 and an initial 10% output increase cited after the first phase. Alongside these upgrades, large projects such as Ciner Glass planned 1,300 t/d capacity in Lommel, Belgium (financing secured in 2025) highlight the competitive tension between incremental capacity additions and network optimization, particularly as producers balance premium beverage and pharmaceutical demand against cost pressure in mass-volume food and beer.
Recent Industry Developments
- June 2026: Vetropack launched a 350-gram Rhinewine bottle, positioned as the lightest in Europe, and began supplying returnable bottles for a new Austrian wine industry pooling scheme. The product rollout combines lightweighting with reuse logistics, supporting both cost reduction and deposit-style circularity programs that can lift refillable glass penetration in selected beverage formats.
- May 2026: Ardagh Glass Packaging announced the launch of its Clearly Ardagh transformation initiative, outlining increased capital allocation to infrastructure and core asset upkeep in 2026. The program points to greater emphasis on plant resilience and operational modernization, aligned with customer requirements for quality consistency and lower-carbon manufacturing pathways.
- April 2026: Verallia inaugurated its first hybrid furnace at its Zaragoza, Spain site, a EUR 63 million project started in 2022 and developed with Sorg. The furnace targets roughly 50% Scope 1 and 2 CO2 reduction, with potential for 60% depending on the energy mix, strengthening Verallia’s position in tenders where footprint metrics influence supplier selection.


Research Methodology Framework and Report Scope
Market Definition and Coverage
For this study, the market covers glass bottles and rigid glass containers used to pack and store finished products across Europe, counted in shipment volume terms (tonnes) for the year of supply into end-use applications.
Scope exclusions: For pharmaceuticals, vials and ampoules are excluded from the market count.
Segmentation Overview
- By End-user
- Beverages
- Alcoholic
- Beer
- Wine
- Spirits
- Other Alcoholic Beverages (Cider and Other Fermented Drinks)
- Non-Alcoholic
- Juices
- Carbonated Drinks (CSDs)
- Dairy Product Based Drinks
- Other Non-Alcoholic Beverages
- Alcoholic
- Food (Jam, Jelly, Marmalades, Honey, Sausages and Condiments, Oil, Pickles)
- Cosmetics and Personal Care
- Pharmaceuticals (excluding Vials and Ampoules)
- Perfumery
- Beverages
- By Color
- Green
- Amber
- Flint
- Other Colors
- By Country
- United Kingdom
- Germany
- France
- Italy
- Poland
- Netherlands
- Spain
- Russia
- Austria
- Switzerland
- Rest of Europe
Data Sources, Market Sizing, and Validation
Desk Research
Desk work starts with building a consistent Europe country map and product-use boundary, then layering in public statistics that can explain glass container demand. We refer to sources such as Eurostat for industrial output and trade signals, UN Comtrade for cross-border container glass movements, and national statistical offices for beverage and food production trends that usually track glass packaging volumes.
To keep assumptions realistic, we also review association publications such as the European container glass federation, plus packaging sustainability and circular economy policy documents that can influence cullet usage and lightweighting. Company annual reports, investor presentations, and credible press coverage help us understand furnace rebuild cycles, capacity additions, and country-level demand shifts. Where needed, paid subscriptions for company financials and a shipment-level import and export view are used to cross-check directional trends, and then the assumptions are corrected before the model is finalized. Sources listed are illustrative only, and many additional public references were consulted to collect data, validate inputs, and clarify open questions.
Primary Interviews and Surveys
Primary work focuses on aligning the tonnage model with how the market is actually supplied and bought in each major country. We speak with a mix of manufacturers, distributors, large packaging buyers, and industry experts across Western, Central, and Eastern Europe so that desk assumptions on utilization, mix, and demand seasonality can be pressure-tested and refined before totals are signed off.
Distribution of primary research fieldwork respondents
| Company type | Respondent position | Region |
|---|---|---|
| Top tier: 34% | CXOs: 12% | |
| Mid tier: 45% | Functional/Unit leaders: 30% | |
| Smaller Players: 21% | Managers: 58% |
Market-Sizing & Forecasting
Sizing is built mainly through a top-down reconstruction that links each country's demand pool to observable production and trade signals for container glass, then converts these indicators into shipped tonnes by end-use. When the model is assembled, the main inputs tracked include beverage output mix (beer, wine, spirits, and non-alcoholic), packaged food activity where jars are common, pharma pack demand where bottles dominate (with vials and ampoules kept out), and country-level shifts in lightweighting and recycled cullet use that can change tonnes even when unit volumes stay steady.
After the country totals are formed, they are corroborated with selective bottom-up approximations, such as sampled capacity and utilization checks, supplier roll-ups where data is available, and average weight and volume sanity checks by application. If a data gap exists for a smaller country or a niche application, we interpolate using close peer markets and then re-check the result in follow-up expert calls.
For forecasting, scenario analysis is used, then anchored with time-series smoothing on the historical tonnage pattern so the forecast does not overreact to one-off shocks. The forward view is adjusted using expected furnace rebuild schedules, planned capacity additions, trade rebalancing, and the pace of premiumization in beverages and cosmetics, since these are the areas where glass tends to gain share.
Data Validation & Update Cycle
Validation is done through multiple passes, where model outputs are compared against independent signals like country trade balances, known capacity footprints, and visible shifts in major end-use production. When a country shows an unusual jump or drop, the assumptions are reopened, and additional checks are run on the drivers, followed by re-contacting experts if the variance cannot be explained from public data.
Before sign-off, another analyst reviews the build for logic, unit consistency, and country totals, then the final dataset is checked again against the latest news and policy changes that can influence glass supply and demand. Reports are refreshed annually, and interim updates are made when a material event occurs, such as major furnace outages, regulatory changes affecting packaging, or large capacity additions. Right before delivery, a final freshness pass is completed so clients receive the most current view available.
Mordor Intelligence's Europe Glass Bottles Containers Market By Countries and Vendors Market Sizing Compared With Other Published Estimates
Published market sizes for Europe glass bottles and containers often differ because the unit of measure is not consistent, and because companies draw the scope line differently across products and end uses. The base year used, the treatment of trade flows, and whether country totals are built from observable volume signals or from value proxies also tend to create gaps.
The biggest drivers here are usually whether estimates are reported in revenue versus tonnes, whether broader glass packaging categories are folded in, and whether pharma packaging includes adjacent formats that are not bottles. Differences also show up when average weight and lightweighting trends are not refreshed, or when currency conversion and inflation assumptions are applied to value totals without being tied back to physical shipment volumes, which then changes the apparent market scale.
Benchmark comparison
| Source | Market Size | Gaps in Research Methodology |
|---|---|---|
| Mordor Intelligence | USD 31.61 M (2025) | |
| Trade Databook A | USD 24.11 B (2024) | Reported in revenue for broader glass packaging, so ASP and inflation effects sit on top of mixed product scope, which makes it hard to reconcile back to shipped tonnes for bottles and containers. |
| Regional Publisher B | USD 22.39 B (2024) | Uses a wider packaging definition across more end uses and countries, and the value build can drift if lightweighting and recycled-content driven weight changes are not explicitly modeled. |
The table mainly reflects a unit and scope mismatch, since the two external figures are value-based glass packaging totals while this study is volume-based for bottles and containers with a stated pharma exclusion, which keeps the demand pool more specific (a modeling choice applied by Mordor Intelligence).


Key Questions Answered in the Report
What is the projected volume for Europe’s glass bottle and container demand in 2031?
The market is expected to reach 37.58 million tonnes by 2031, up from 32.54 million tonnes in 2026.
Which end-user category is expanding quickest in European glass containers?
Cosmetics and personal care is the fastest-growing segment, posting a 3.52% CAGR through 2031.
How are producers mitigating high energy costs?
Companies invest in electric, hybrid, and hydrogen-ready furnaces and pursue lightweight bottle designs to cut fuel use and logistics expenses.
Why is amber glass gaining share?
Pharmaceutical vials and premium spirits need UV protection and distinctive aesthetics, driving a 3.44% CAGR for amber containers.
What major investment underscores Belgium’s capacity expansion?
Ciner Glass is building a 1,300 t/d plant in Lommel backed by EUR 504 million financing, signaling confidence in long-term regional demand.
How significant is export demand to market stability?
Robust wine, beer, and pharmaceutical exports cushion domestic slowdowns, making outbound trade a critical volume stabilizer for producers.
Page last updated on:






