| Study Period | 2017 - 2030 |
| Base Year For Estimation | 2024 |
| Forecast Data Period | 2025 - 2030 |
| Market Size (2025) | USD 6.84 Billion |
| Market Size (2030) | USD 9.29 Billion |
| CAGR (2025 - 2030) | 6.32 % |
| Market Concentration | High |
Major Players*Disclaimer: Major Players sorted in no particular order |

Europe General Aviation Market Analysis
The Europe General Aviation Market size is estimated at 6.84 billion USD in 2025, and is expected to reach 9.29 billion USD by 2030, growing at a CAGR of 6.32% during the forecast period (2025-2030).
The European general aviation market landscape has witnessed significant transformation driven by changing consumer preferences and wealth demographics. As of 2022, Europe represented approximately 16% of the global business jet fleet, highlighting its substantial position in the international aviation sector. The surge in high-net-worth individuals (HNWIs) has been particularly noteworthy, with the region recording a 67% increase in the HNWI population from 2017 to 2022. This demographic shift has fundamentally altered the demand dynamics for private aviation services, with ultra-high-net-worth individuals (UHNWIs) showing a 5% growth in 2022 compared to the previous year, largely attributed to strong performance in Eurozone utilities, tech stocks, and luxury goods sectors.
The charter aviation segment has emerged as a crucial growth driver in the European general aviation sector, demonstrating remarkable resilience and adaptation to evolving market conditions. Charter service providers have reported business aviation traffic levels approximately 20-30% higher than pre-pandemic benchmarks since August 2021, indicating a sustained shift in travel preferences among corporate and private clients. This surge in demand has prompted operators to significantly expand their fleets and enhance their service offerings, particularly in key markets across Western Europe. The trend reflects a broader transformation in how businesses and individuals approach air travel, with an increasing emphasis on flexibility, efficiency, and personalized service.
The industry has witnessed substantial operational developments, particularly in infrastructure and service delivery. Major operators are investing heavily in modernizing their fleets and expanding their operational capabilities to meet evolving customer requirements. The market has seen a notable shift toward larger aircraft and more sophisticated aviation services, with operators focusing on enhancing their service portfolios to cater to diverse client needs. This evolution is particularly evident in the growing demand for specialized services, including customized flight arrangements and comprehensive travel solutions.
Technological advancement and sustainability initiatives are reshaping the competitive landscape of the European aviation market. Leading manufacturers and operators are increasingly incorporating advanced avionics systems, fuel-efficient technologies, and digital solutions to enhance operational efficiency and reduce environmental impact. The industry is witnessing a gradual transition toward more sustainable practices, with operators exploring alternative fuel options and implementing eco-friendly operational procedures. This transformation is accompanied by significant investments in infrastructure development, including the expansion of private aviation facilities and the enhancement of ground support services across major European aviation hubs.
Europe General Aviation Market Trends
Rise in the HNWI population acting as the major growth driver for the market
- HNWIs and UHNWIs often own private jets for personal or business travel. Europe is home to a multitude of scenic and exclusive destinations that may not be easily accessible through commercial flights. Business jets provide the opportunity for HNWIs to fly directly to remote locations, avoiding congested airports and time-consuming connections. In 2022, the number of UHNWIs in Europe increased by 5% compared to 2021. This was because the Eurozone utilities, tech stocks, and luxury goods sectors performed well, registering solid gains. Europe recorded the third significant rise in the ultra-wealthy population, which recorded 67% of the global HNWI population during 2017-2022.
- The leading position of Europe in terms of the number and assets of HNWIs is mainly attributed to Germany, France, and the United Kingdom. In 2022, these three countries alone recorded 67% of the total HNWIs in Europe. Germany led the HNWI population with 3.5 million HNWIs, followed by France with 3.07 million and the United Kingdom with 2.9 million. The United Kingdom attracts a steady stream of high-net-worth individuals from Africa, Asia, and the Middle East. Russia saw the least growth in the HNWI population, which recorded 2%. This was because well-off people have been moving out of Russia every year for the past 10 years, a sign of the current issues the country is facing. The crisis in Ukraine posed risks to the global economy, especially to inflation and financial markets. However, the market is expected to recover during the forecast period. In 2030, the HNWI population is expected to grow by 18.4 million.
-By-Country,-Number-of-HNWIs,-Europe,-2017---2030.svg)
Understand The Key Trends Shaping This Market
Download PDF
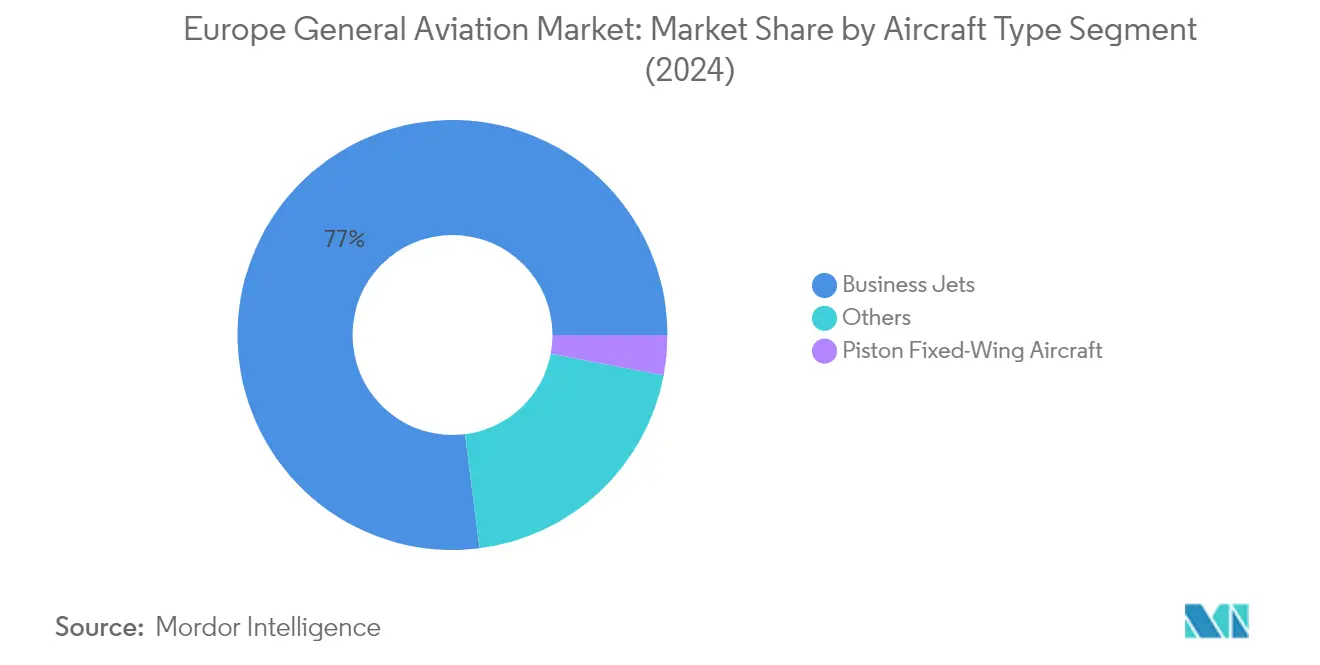
Segment Analysis: By Sub Aircraft Type
Business Jets Segment in Europe General Aviation Market
The business jets segment dominates the European general aviation market, accounting for approximately 77% of the market share in 2024. This dominance is driven by increasing demand from high-net-worth individuals (HNWIs) and ultra-high-net-worth individuals (UHNWIs) in the region. This segment is also experiencing the fastest growth trajectory, with a projected growth rate of around 7.5% during 2024-2029, primarily due to the rising adoption of large jets across various sectors and countries in Europe. The segment's robust performance is supported by the strong presence of major European jet manufacturers such as Bombardier, Gulfstream, and Dassault Aviation, who continue to introduce advanced aircraft models with enhanced range and comfort features. The business jets category comprises various sub-segments, including large jets, light jets, and mid-size jets, with large jets holding the predominant share due to their increased range and passenger capacity capabilities.
Remaining Segments in Europe General Aviation Market
The piston fixed-wing aircraft and other segments, including turboprops and helicopters, play crucial roles in the European general aviation landscape. The piston fixed-wing aircraft segment primarily serves flight training institutes and private aviation enthusiasts, with manufacturers like Tecnam and Diamond Aircraft offering various models suited for training and recreational purposes. The others segment, encompassing turboprops and helicopters, caters to diverse applications, including emergency medical services, law enforcement, corporate transportation, and tourism. These segments benefit from the region's well-developed aviation infrastructure and supportive regulatory environment, while also addressing specific market niches that require specialized aircraft capabilities. Notably, European aircraft manufacturers and European airplane manufacturers are pivotal in supplying the necessary technology and innovation to sustain these segments.
Europe General Aviation Market Geography Segment Analysis
Europe General Aviation Market in UK
The United Kingdom stands as the dominant force in Europe's general aviation market, commanding approximately 12% of the market share in 2024. The country's robust aviation infrastructure, particularly centered around key hubs like London, has fostered a thriving ecosystem for private and business aviation. The UK's large economy and proximity to major European business centers have made it an attractive base for business jet operators and private aircraft owners. The country's active and operational business jet fleet comprises a diverse mix of aircraft types, with Cessna holding the largest fleet share, followed by significant presence from manufacturers like Gulfstream and Dassault Aviation. The strong customer support network and maintenance facilities across the country have further reinforced its position as a leading aviation market. The concentration of high-net-worth individuals and corporate headquarters in London and other major cities continues to drive demand for business aviation services, particularly in the large jet segment.
Europe General Aviation Market in Spain
Spain is emerging as one of the most dynamic markets in European general aviation, projected to achieve a remarkable growth rate of approximately 17% during 2024-2029. The country's strategic location allows for efficient travel to major business centers globally, making it increasingly attractive for business aviation operations. Spain's growing appeal as a destination for both business and leisure travel has catalyzed significant investments in aviation infrastructure and services. The country's business aviation sector has shown remarkable resilience, with private jet operations experiencing substantial growth, particularly in popular destinations like Madrid and Barcelona. The expansion of maintenance, repair, and overhaul (MRO) facilities across Spanish airports has enhanced the country's capability to support a growing fleet of private aircraft. The rise in high-net-worth individuals and increasing corporate activity has created a robust market for charter services and private jet ownership.
Europe General Aviation Market in Germany
Germany maintains its position as a cornerstone of the European aviation market, supported by its strong industrial base and extensive network of airports. The country boasts the largest fleet of operational business jets in Europe, reflecting its economic strength and sophisticated aviation infrastructure. German operators have shown a particular preference for light jets, which make up a significant portion of the country's business aviation fleet. The country's strategic location in central Europe makes it an ideal hub for both regional and international business aviation operations. The presence of major maintenance facilities and authorized service centers from leading manufacturers has strengthened Germany's position in the market. The country's robust economy and strong corporate sector continue to drive demand for business aviation services, particularly in major business centers like Frankfurt, Munich, and Hamburg. The emphasis on technological innovation and environmental sustainability in German aviation has led to increased adoption of newer, more efficient aircraft models.
Europe General Aviation Market in France
France continues to demonstrate its significance in the European aviation market, leveraging its sophisticated aviation infrastructure and strategic geographic position. The country's business aviation sector benefits from the presence of major aerospace manufacturers and a well-developed network of airports and support facilities. Paris-Le Bourget's status as Europe's leading business aviation airport underscores France's importance in the market. The country's aviation sector is characterized by a strong focus on innovation and sustainability, with increasing adoption of next-generation aircraft and environmental initiatives. French operators have shown particular interest in diversifying their fleet composition, with a balanced mix of light, midsize, and large jets. The presence of major aviation events and trade shows in France continues to strengthen its position as a key market for business aviation. The country's strong aerospace ecosystem, including manufacturers, maintenance facilities, and training centers, provides comprehensive support for general aviation operations.
Europe General Aviation Market in Other Countries
Beyond the major markets, several other European countries contribute significantly to the region's general aviation landscape. Italy's market is characterized by strong demand from pilot training institutes and a growing preference for large business jets. The Netherlands leverages its strategic location and sophisticated infrastructure to attract business aviation operations. Russia's market, despite facing challenges, maintains a significant fleet of business aircraft and helicopters. Turkey's growing economy has led to increased demand for business aviation services, particularly in the large jet segment. Countries like Austria, Switzerland, and Belgium have developed specialized niches within the general aviation sector, often focusing on specific segments such as helicopter operations or specialized training services. These markets collectively demonstrate the diverse and dynamic nature of European general aviation, each contributing unique strengths and opportunities to the overall ecosystem.
Get Analysis on Important Geographic Markets
Download PDF
Europe General Aviation Industry Overview
Top Companies in Europe General Aviation Market
The European general aviation market is characterized by continuous product innovation across manufacturers, with European aircraft manufacturers focusing on developing advanced business jets, turboprops, and helicopters with enhanced capabilities and features. Companies are demonstrating operational agility through strategic expansion of service networks, particularly in key markets like Germany, France, and the UK, while also establishing maintenance and support facilities to better serve their customer base. Strategic moves in the industry include partnerships with charter operators, flight training academies, and air taxi services to expand market reach. Manufacturers are increasingly investing in sustainable aviation technologies and digital solutions to meet evolving customer demands. The competitive landscape is further shaped by general aviation companies expanding their presence through new regional offices, service centers, and training facilities across Europe, particularly in emerging markets.
Market Dominated by Global Aviation Conglomerates
The European general aviation market exhibits a high level of consolidation, with established global aviation conglomerates holding significant market positions. Companies like Bombardier, General Dynamics (Gulfstream), Embraer, Dassault Aviation, and Textron dominate the market through their comprehensive product portfolios and extensive service networks. These major players leverage their technological capabilities, brand reputation, and established distribution channels to maintain their market positions, while also benefiting from economies of scale in manufacturing and research and development.
The market is characterized by a mix of traditional aerospace manufacturers and specialized aviation companies, with some players focusing on specific segments such as business jets, turboprops, or helicopters. Merger and acquisition activities in the sector are primarily driven by the need to acquire new technologies, expand product portfolios, and strengthen market presence in specific regions. Companies are also forming strategic alliances and joint ventures to share development costs and access new markets, particularly in emerging European economies.
Innovation and Service Network Drive Success
For incumbent companies to maintain and increase their market share, a focus on continuous product innovation, particularly in areas such as fuel efficiency, cabin comfort, and digital connectivity, remains crucial. Establishing comprehensive maintenance, repair, and overhaul networks across Europe, along with offering customized financing solutions and superior after-sales support, helps maintain customer loyalty. Companies are also investing in sustainable aviation technologies and digital transformation initiatives to address environmental concerns and enhance operational efficiency.
Contenders looking to gain ground in the market need to focus on identifying and serving underserved market segments, developing specialized products for specific applications, and building strong relationships with local partners and customers. Success factors include establishing efficient supply chains, offering competitive pricing strategies, and developing innovative business models such as fractional ownership and charter services. The regulatory environment, particularly regarding emissions standards and safety requirements, continues to shape market dynamics, while the concentration of high-net-worth individuals and corporate customers in specific European regions influences market opportunities. The presence of European airplane manufacturers in these regions further enhances market opportunities.
Europe General Aviation Market Leaders
-
Bombardier Inc.
-
Dassault Aviation
-
Embraer
-
General Dynamics Corporation
-
Textron Inc.
- *Disclaimer: Major Players sorted in no particular order

Need More Details on Market Players and Competitors?
Download PDF
Europe General Aviation Market News
- December 2023: Tecnam announced that the renowned Scottish flight training academy ACS Aviation ordered two P-Mentors to be added to its current fleet to expand its fleet capabilities in 2023.
- October 2023: Textron Aviation announced that it entered into a purchase agreement with Fly Alliance for up to 20 Cessna Citation business jets, four firms with options for 16 additional aircraft. Fly Alliance is expected to use the aircraft for its luxury private jet charter operations and is expected to take delivery of the first aircraft, an XLS Gen2, in 2023.
- June 2023: Le Havre-Fécamp Pilot Station and Airbus Helicopters have signed a contract for the acquisition of an H135 to be used for marine pilot transfers. By the end of 2024, the H135 will replace an AS365 N3 Dauphin helicopter that has been in service for more than 12 years.
Free With This Report
We provide a complimentary and exhaustive set of data points on global and regional metrics that present the fundamental structure of the industry. Presented in the form of 45+ free charts, the section covers data on commercial aircraft deliveries by manufacturer, backlogs of commercial aircraft, active military aircraft fleet by type of aircraft, overall business jets and helicopters fleet by manufacturer and also classified by type of ownership.


Europe General Aviation Market Report - Table of Contents
1. EXECUTIVE SUMMARY & KEY FINDINGS
2. REPORT OFFERS
3. INTRODUCTION
- 3.1 Study Assumptions & Market Definition
- 3.2 Scope of the Study
- 3.3 Research Methodology
4. KEY INDUSTRY TRENDS
- 4.1 High-net-worth Individual (hnwi)
- 4.2 Regulatory Framework
- 4.3 Value Chain Analysis
5. MARKET SEGMENTATION (includes market size in Value in USD and Volume, Forecasts up to 2030 and analysis of growth prospects)
-
5.1 Sub Aircraft Type
- 5.1.1 Business Jets
- 5.1.1.1 Large Jet
- 5.1.1.2 Light Jet
- 5.1.1.3 Mid-Size Jet
- 5.1.2 Piston Fixed-Wing Aircraft
- 5.1.3 Others
-
5.2 Country
- 5.2.1 France
- 5.2.2 Germany
- 5.2.3 Italy
- 5.2.4 Netherlands
- 5.2.5 Russia
- 5.2.6 Spain
- 5.2.7 Turkey
- 5.2.8 UK
- 5.2.9 Rest of Europe
6. COMPETITIVE LANDSCAPE
- 6.1 Key Strategic Moves
- 6.2 Market Share Analysis
- 6.3 Company Landscape
-
6.4 Company Profiles
- 6.4.1 Airbus SE
- 6.4.2 Bombardier Inc.
- 6.4.3 Cirrus Design Corporation
- 6.4.4 Daher
- 6.4.5 Dassault Aviation
- 6.4.6 Diamond Aircraft
- 6.4.7 Embraer
- 6.4.8 General Dynamics Corporation
- 6.4.9 Leonardo S.p.A
- 6.4.10 PIAGGIO AERO INDUSTRIES S.p.A
- 6.4.11 Pilatus Aircraft Ltd
- 6.4.12 Robinson Helicopter Company Inc.
- 6.4.13 Tecnam Aircraft
- 6.4.14 Textron Inc.
- *List Not Exhaustive
7. KEY STRATEGIC QUESTIONS FOR AVIATION CEOS
8. APPENDIX
-
8.1 Global Overview
- 8.1.1 Overview
- 8.1.2 Porter’s Five Forces Framework
- 8.1.3 Global Value Chain Analysis
- 8.1.4 Market Dynamics (DROs)
- 8.2 Sources & References
- 8.3 List of Tables & Figures
- 8.4 Primary Insights
- 8.5 Data Pack
- 8.6 Glossary of Terms
You Can Purchase Parts Of This Report. Check Out Prices For Specific Sections
Get Price Break-up Now
List of Tables & Figures
- Figure 1:
- POPULATION OF HIGH-NET-WORTH INDIVIDUAL (HNWI) BY COUNTRY, NUMBER OF HNWIS, EUROPE, 2017 - 2030
- Figure 2:
- NUMBER OF NEW AIRCRAFT DELIVERIES, VOLUME, EUROPE, 2017 - 2030
- Figure 3:
- NUMBER OF NEW AIRCRAFT DELIVERIES, USD, EUROPE, 2017 - 2030
- Figure 4:
- GENERAL AVIATION DELIVERIES BY SUB AIRCRAFT TYPE, VOLUME, EUROPE, 2017 - 2030
- Figure 5:
- GENERAL AVIATION DELIVERIES BY SUB AIRCRAFT TYPE, USD, EUROPE, 2017 - 2030
- Figure 6:
- GENERAL AVIATION DELIVERIES BY SUB AIRCRAFT TYPE, VOLUME %, EUROPE, 2017 VS 2023 VS 2030
- Figure 7:
- GENERAL AVIATION DELIVERIES BY SUB AIRCRAFT TYPE, VALUE %, EUROPE, 2017 VS 2023 VS 2030
- Figure 8:
- BUSINESS JETS DELIVERIES BY BODY TYPE, VOLUME, EUROPE, 2017 - 2030
- Figure 9:
- BUSINESS JETS DELIVERIES BY BODY TYPE, USD, EUROPE, 2017 - 2030
- Figure 10:
- BUSINESS JETS DELIVERIES BY BODY TYPE, VOLUME %, EUROPE, 2017 VS 2023 VS 2030
- Figure 11:
- BUSINESS JETS DELIVERIES BY BODY TYPE, VALUE %, EUROPE, 2017 VS 2023 VS 2030
- Figure 12:
- EUROPE GENERAL AVIATION MARKET, BY LARGE JET, UNITS, 2017 - 2030
- Figure 13:
- EUROPE GENERAL AVIATION MARKET, BY LARGE JET, USD, 2017 - 2030
- Figure 14:
- EUROPE GENERAL AVIATION MARKET, BY BODY TYPE, USD, %, 2023 VS 2030
- Figure 15:
- EUROPE GENERAL AVIATION MARKET, BY LIGHT JET, UNITS, 2017 - 2030
- Figure 16:
- EUROPE GENERAL AVIATION MARKET, BY LIGHT JET, USD, 2017 - 2030
- Figure 17:
- EUROPE GENERAL AVIATION MARKET, BY BODY TYPE, USD, %, 2023 VS 2030
- Figure 18:
- EUROPE GENERAL AVIATION MARKET, BY MID-SIZE JET, UNITS, 2017 - 2030
- Figure 19:
- EUROPE GENERAL AVIATION MARKET, BY MID-SIZE JET, USD, 2017 - 2030
- Figure 20:
- EUROPE GENERAL AVIATION MARKET, BY BODY TYPE, USD, %, 2023 VS 2030
- Figure 21:
- EUROPE GENERAL AVIATION MARKET, BY PISTON FIXED-WING AIRCRAFT, UNITS, 2017 - 2030
- Figure 22:
- EUROPE GENERAL AVIATION MARKET, BY PISTON FIXED-WING AIRCRAFT, USD, 2017 - 2030
- Figure 23:
- EUROPE GENERAL AVIATION MARKET, BY SUB AIRCRAFT TYPE, USD, %, 2023 VS 2030
- Figure 24:
- EUROPE GENERAL AVIATION MARKET, BY OTHERS, UNITS, 2017 - 2030
- Figure 25:
- EUROPE GENERAL AVIATION MARKET, BY OTHERS, USD, 2017 - 2030
- Figure 26:
- EUROPE GENERAL AVIATION MARKET, BY SUB AIRCRAFT TYPE, USD, %, 2023 VS 2030
- Figure 27:
- GENERAL AVIATION DELIVERIES BY COUNTRY, VOLUME, EUROPE, 2017 - 2030
- Figure 28:
- GENERAL AVIATION DELIVERIES BY COUNTRY, USD, EUROPE, 2017 - 2030
- Figure 29:
- GENERAL AVIATION DELIVERIES BY COUNTRY, VOLUME %, EUROPE, 2017 VS 2023 VS 2030
- Figure 30:
- GENERAL AVIATION DELIVERIES BY COUNTRY, VALUE %, EUROPE, 2017 VS 2023 VS 2030
- Figure 31:
- EUROPE GENERAL AVIATION MARKET, BY FRANCE, UNITS, 2017 - 2030
- Figure 32:
- EUROPE GENERAL AVIATION MARKET, BY FRANCE, USD, 2017 - 2030
- Figure 33:
- GENERAL AVIATION DELIVERIES SHARE, VALUE, %, FRANCE, 2023 VS 2030
- Figure 34:
- EUROPE GENERAL AVIATION MARKET, BY GERMANY, UNITS, 2017 - 2030
- Figure 35:
- EUROPE GENERAL AVIATION MARKET, BY GERMANY, USD, 2017 - 2030
- Figure 36:
- GENERAL AVIATION DELIVERIES SHARE, VALUE, %, GERMANY, 2023 VS 2030
- Figure 37:
- EUROPE GENERAL AVIATION MARKET, BY ITALY, UNITS, 2017 - 2030
- Figure 38:
- EUROPE GENERAL AVIATION MARKET, BY ITALY, USD, 2017 - 2030
- Figure 39:
- GENERAL AVIATION DELIVERIES SHARE, VALUE, %, ITALY, 2023 VS 2030
- Figure 40:
- EUROPE GENERAL AVIATION MARKET, BY NETHERLANDS, UNITS, 2017 - 2030
- Figure 41:
- EUROPE GENERAL AVIATION MARKET, BY NETHERLANDS, USD, 2017 - 2030
- Figure 42:
- GENERAL AVIATION DELIVERIES SHARE, VALUE, %, NETHERLANDS, 2023 VS 2030
- Figure 43:
- EUROPE GENERAL AVIATION MARKET, BY RUSSIA, UNITS, 2017 - 2030
- Figure 44:
- EUROPE GENERAL AVIATION MARKET, BY RUSSIA, USD, 2017 - 2030
- Figure 45:
- GENERAL AVIATION DELIVERIES SHARE, VALUE, %, RUSSIA, 2023 VS 2030
- Figure 46:
- EUROPE GENERAL AVIATION MARKET, BY SPAIN, UNITS, 2017 - 2030
- Figure 47:
- EUROPE GENERAL AVIATION MARKET, BY SPAIN, USD, 2017 - 2030
- Figure 48:
- GENERAL AVIATION DELIVERIES SHARE, VALUE, %, SPAIN, 2023 VS 2030
- Figure 49:
- EUROPE GENERAL AVIATION MARKET, BY TURKEY, UNITS, 2017 - 2030
- Figure 50:
- EUROPE GENERAL AVIATION MARKET, BY TURKEY, USD, 2017 - 2030
- Figure 51:
- GENERAL AVIATION DELIVERIES SHARE, VALUE, %, TURKEY, 2023 VS 2030
- Figure 52:
- EUROPE GENERAL AVIATION MARKET, BY UK, UNITS, 2017 - 2030
- Figure 53:
- EUROPE GENERAL AVIATION MARKET, BY UK, USD, 2017 - 2030
- Figure 54:
- GENERAL AVIATION DELIVERIES SHARE, VALUE, %, UK, 2023 VS 2030
- Figure 55:
- EUROPE GENERAL AVIATION MARKET, BY REST OF EUROPE, UNITS, 2017 - 2030
- Figure 56:
- EUROPE GENERAL AVIATION MARKET, BY REST OF EUROPE, USD, 2017 - 2030
- Figure 57:
- GENERAL AVIATION DELIVERIES SHARE, VALUE, %, REST OF EUROPE, 2023 VS 2030
- Figure 58:
- MOST ACTIVE COMPANIES, NUMBER OF STRATEGIC MOVES, EUROPE, 2018-2023
- Figure 59:
- MOST ADOPTED STRATEGIES, COUNT, EUROPE, 2018 - 2023
- Figure 60:
- MAJOR PLAYERS REVENUE SHARE (%), EUROPE
Europe General Aviation Industry Segmentation
Business Jets, Piston Fixed-Wing Aircraft, Others are covered as segments by Sub Aircraft Type. France, Germany, Italy, Netherlands, Russia, Spain, Turkey, UK are covered as segments by Country.| Sub Aircraft Type | Business Jets | Large Jet |
| Light Jet | ||
| Mid-Size Jet | ||
| Piston Fixed-Wing Aircraft | ||
| Others | ||
| Country | France | |
| Germany | ||
| Italy | ||
| Netherlands | ||
| Russia | ||
| Spain | ||
| Turkey | ||
| UK | ||
| Rest of Europe |
Need A Different Region or Segment?
Customize Now
Market Definition
- Aircraft Type - General Aviation includes aircraft used for corporate aviation, business aviation and other aerial works.
- Sub-Aircraft Type - Business Jets, Piston Fixed-Wing Aircraft, and helicopters and turboprop aircraft are taken into consideration.
- Body Type - Light Jets, Mid-Size Jets, and Large Jets according to their ability to carry passengers and flying distance ranges have been included under this study.
| Keyword | Definition |
|---|---|
| IATA | IATA stands for the International Air Transport Association, a trade organization composed of airlines around the world that has an influence over the commercial aspects of flight. |
| ICAO | ICAO stands for International Civil Aviation Organization, a specialized agency of the United Nations that supports aviation and navigation around the globe. |
| Air Operator Certificate (AOC) | A certificate granted by a National Aviation Authority permitting the conduct of commercial flying activities. |
| Certificate Of Airworthiness (CoA) | A Certificate Of Airworthiness (CoA) is issued for an aircraft by the civil aviation authority in the state in which the aircraft is registered. |
| Gross Domestic Product (GDP) | Gross domestic product (GDP) is a monetary measure of the market value of all the final goods and services produced in a specific time period by countries. |
| RPK (Revenue Passenger Kilometres) | The RPK of an airline is the sum of the products obtained by multiplying the number of revenue passengers carried on each flight stage by the stage distance - it is the total number of kilometers traveled by all revenue passengers. |
| Load Factor | The load factor is a metric used in the airline industry that measures the percentage of available seating capacity that has been filled with passengers. |
| Original Equipment Manufacturer (OEM) | An original equipment manufacturer (OEM) traditionally is defined as a company whose goods are used as components in the products of another company, which then sells the finished item to users. |
| International Transportation Safety Association (ITSA) | International Transportation Safety Association (ITSA) is an international network of heads of independent safety investigation authorities (SIA). |
| Available Seats Kilometre (ASK) | This metric is calculated by multiplying Available Seats (AS) in one flight, defined above, multiplied by the distance flown. |
| Gross Weight | The fully-loaded weight of an aircraft, also known as “takeoff weight,” which includes the combined weight of passengers, cargo, and fuel. |
| Airworthiness | The ability of an aircraft, or other airborne equipment or system, to operate in flight and on the ground without significant hazard to aircrew, ground crew, passengers or to other third parties. |
| Airworthiness Standards | Detailed and comprehensive design and safety criteria applicable to the category of aeronautical product (aircraft, engine or propeller). |
| Fixed Base Operator (FBO) | A business or organization that operates at an airport. An FBO provides aircraft operating services like maintenance, fueling, flight training, charter services, hangaring, and parking. |
| High Net worth Individuals (HNWIs) | High Net worth Individuals (HNWIs) are individuals with over USD 1 million in liquid financial assets. |
| Ultra High Net worth Individuals (UHNWIs) | Ultra High Net worth Individuals (UHNWIs) are individuals with over USD 30 million in liquid financial assets. |
| Federal Aviation Administration (FAA) | The division of the Department of Transportation is concerned with aviation. It operates Air Traffic Control and regulates everything from aircraft manufacturing to pilot training to airport operations in the United States. |
| EASA (European Aviation Safety Agency) | The European Aviation Safety Agency is a European Union agency established in 2002 with the task of overseeing civil aviation safety and regulation. |
| Airborne Warning and Control System (AW&C) aircraft | Airborne Warning and Control System (AEW&C) aircraft is equipped with a powerful radar and on-board command and control center to direct the armed forces. |
| The North Atlantic Treaty Organization (NATO) | The North Atlantic Treaty Organization (NATO), also called the North Atlantic Alliance, is an intergovernmental military alliance between 30 member states – 28 European and two North American. |
| Joint Strike Fighter (JSF) | Joint Strike Fighter (JSF) is a development and acquisition program intended to replace a wide range of existing fighter, strike, and ground attack aircraft for the United States, the United Kingdom, Italy, Canada, Australia, the Netherlands, Denmark, Norway, and formerly Turkey. |
| Light Combat Aircraft (LCA) | A light combat aircraft (LCA) is a light, multirole jet/turboprop military aircraft, commonly derived from advanced trainer designs, designed for engaging in light combat. |
| Stockholm International Peace Research Institute (SIPRI) | Stockholm International Peace Research Institute (SIPRI) is an international institute that provides data, analysis, and recommendations for armed conflict, military expenditure, and arms trade as well as disarmament and arms control. |
| Maritime Patrol Aircraft (MPA) | A maritime patrol aircraft (MPA), also known as maritime reconnaissance aircraft is a fixed-wing aircraft designed to operate for long durations over water in maritime patrol roles, in particular, anti-submarine warfare (ASW), anti-ship warfare (AShW), and search and rescue (SAR). |
| Mach Number | The Mach number is defined as the ratio of true airspeed to the speed of sound at the altitude of a given aircraft. |
| Stealth Aircraft | Stealth is a Common term applied to low observable (LO) technology and doctrine, that makes an aircraft near invisible to radar, infrared or visual detection. |
Need More Details on Market Definition?
Ask a Question
Research Methodology
Mordor Intelligence follows a four-step methodology in all our reports.
- Step-1: Identify Key Variables: In order to build a robust forecasting methodology, the variables and factors identified in Step-1 are tested against available historical market numbers. Through an iterative process, the variables required for market forecast are set and the model is built on the basis of these variables.
- Step-2: Build a Market Model: Market-size estimations for the historical and forecast years have been provided in revenue and volume terms. For sales conversion to volume, the average selling price (ASP) is kept constant throughout the forecast period for each country, and inflation is not a part of the pricing.
- Step-3: Validate and Finalize: In this important step, all market numbers, variables and analyst calls are validated through an extensive network of primary research experts from the market studied. The respondents are selected across levels and functions to generate a holistic picture of the market studied.
- Step-4: Research Outputs: Syndicated Reports, Custom Consulting Assignments, Databases & Subscription Platforms

Get More Details On Research Methodology
Download PDF


