
Market Overview
| Study Period | 2021 - 2031 |
|---|---|
| Forecast Data Period | 2026 - 2031 |
| Base Year Market Size (2025) | USD 7.29 Billion |
| Market Size (2026) | USD 7.65 Billion |
| Market Size (2031) | USD 9.77 Billion |
| Growth Rate (2026 - 2031) | 5.00 % |
| Market Concentration | Medium |
Major Players
*Disclaimer: Major Players sorted in no particular order Image © Mordor Intelligence. Reuse requires attribution under CC BY 4.0. |
|
Europe Gas Turbine Market Analysis by Mordor Intelligence
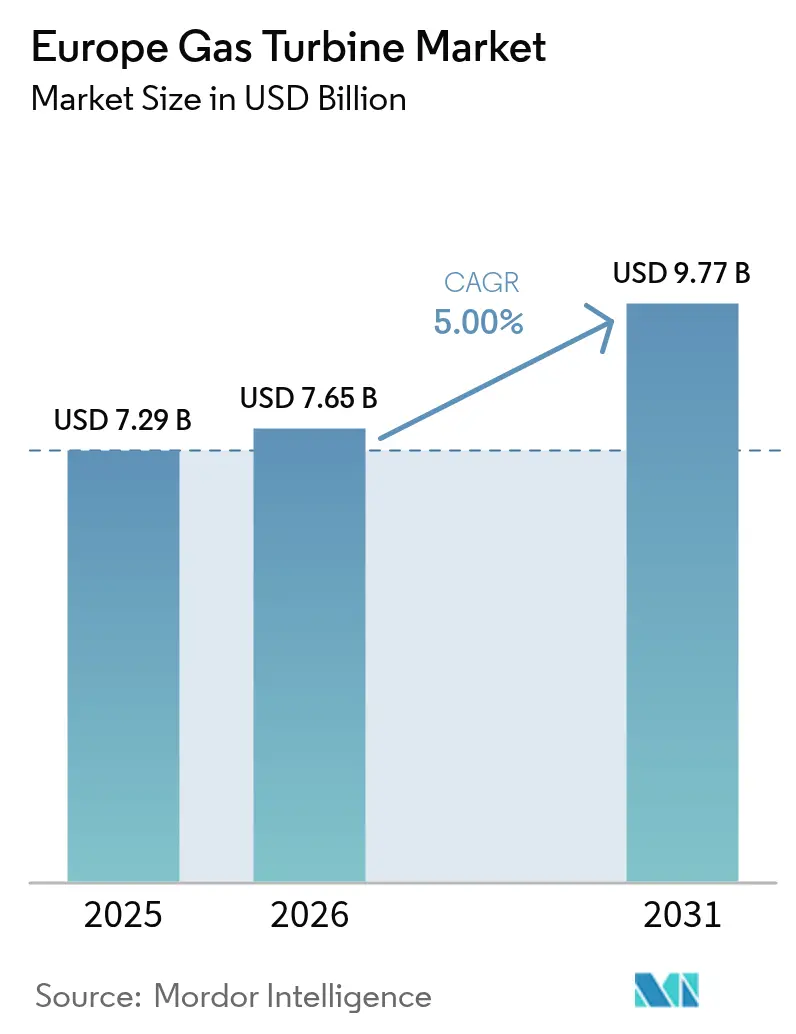
Europe Gas Turbine Market size in 2026 is estimated at USD 7.65 billion, growing from 2025 value of USD 7.29 billion with 2031 projections showing USD 9.77 billion, growing at 5.0% CAGR over 2026-2031.
Utility operators continue to favor combined-cycle gas turbine (CCGT) projects because they start within 30 minutes, offer 64% efficiency, and stabilise a grid that is already sourcing more than 60% of its electricity from renewables.[1] The decommissioning of coal and nuclear plants, a steadily rising EU ETS carbon price that rewards modern, high-efficiency units, and the tightening of EU NOx limits under the Industrial Emissions Directive are all sustaining procurement activity, even as battery costs fall and LNG prices remain volatile.[2] Hydrogen-ready retrofits and synthetic-methane pilots are expanding the addressable market by attracting green finance capital and aligning the technology with long-term decarbonization pathways. Finally, the European gas turbine market is benefitting from the rapid spread of AI-powered data centres, which demand modular aero-derivative turbines that deliver near-instant power and higher availability than traditional diesel sets.
Key Report Takeaways
- By capacity, turbines exceeding 120 MW captured 39.40% of the European gas turbine market share in 2025, while those under 30 MW are projected to expand at a 5.4% CAGR through 2031.
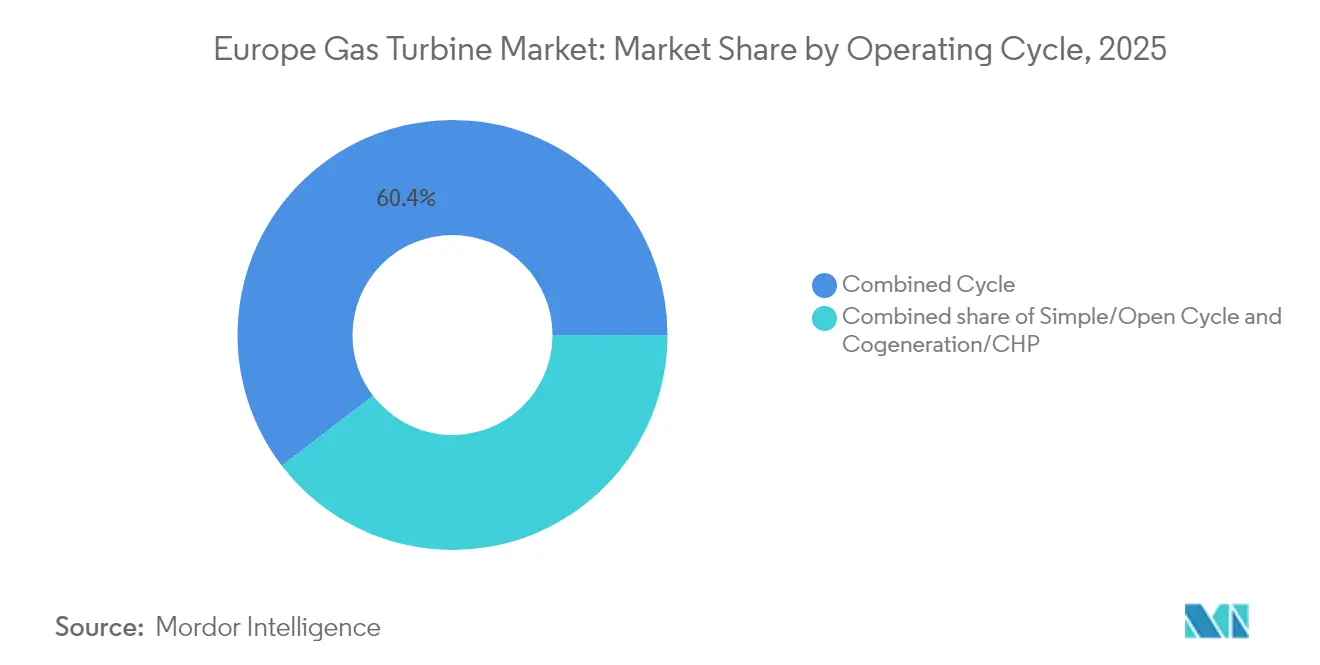
- By operating cycle, combined cycle held 60.40% of the European gas turbine market share in 2025, and Cogeneration/CHP is expected to advance at a 5.9% CAGR through 2031.
- By fuel type, natural gas accounted for 75.30% of the European gas turbine market size in 2025, whereas other fuel types are expanding at an 8.2% CAGR.
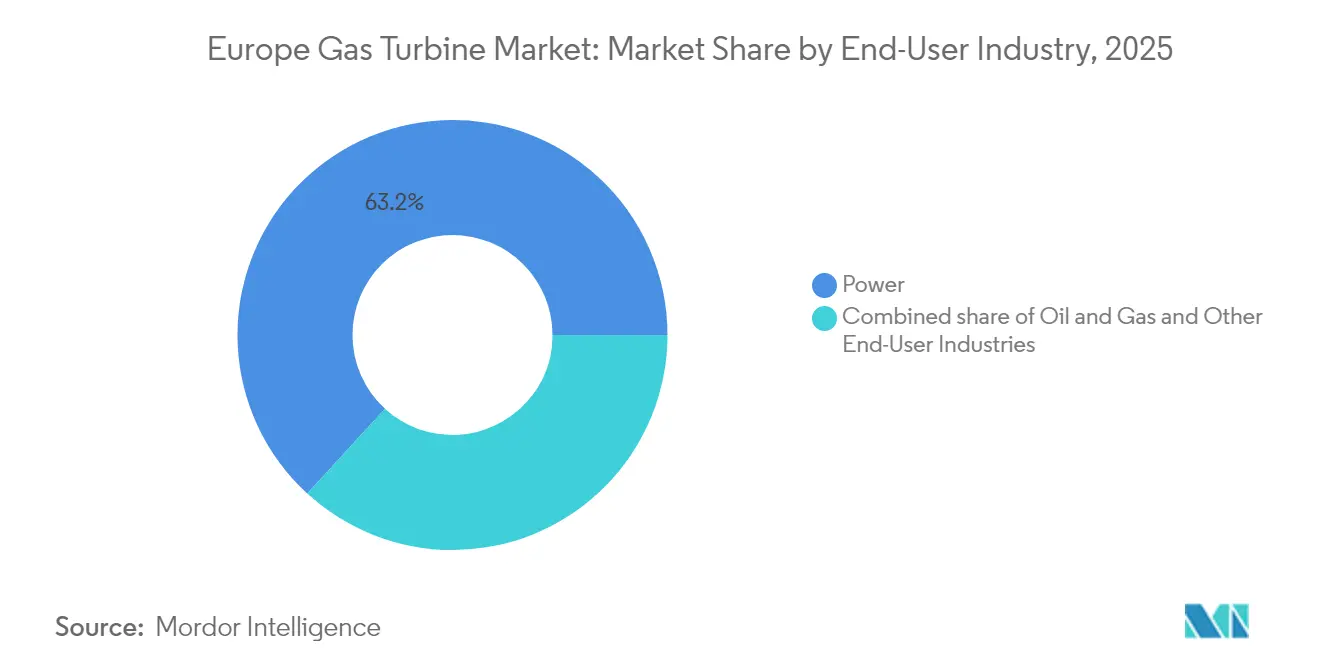
- By end-user, power utilities held 63.20% of the European gas turbine market share in 2025; industrial and other applications are expected to advance at a 5.7% CAGR through 2031.
- By geography, Germany led the European gas turbine market, contributing 21.70% of the revenue in 2025, whereas Spain is forecast to post the fastest growth, with a 5.6% CAGR from 2025 to 2031.
Note: Market size and forecast figures in this report are generated using Mordor Intelligence’s proprietary estimation framework, updated with the latest available data and insights as of 2026.
Market Trends and Insights
Drivers Impact Analysis of Europe Gas Turbine Market*
| Driver | (~) % Impact on CAGR Forecast | Geographic Relevance | Impact Timeline |
|---|---|---|---|
| Closure of ageing coal & nuclear fleets accelerates CCGT build-out | 1.20% | Germany, UK, Netherlands | Medium term (2-4 years) |
| Renewables intermittency amplifies need for fast-ramping gas turbines | 0.80% | EU-wide | Long term (≥ 4 years) |
| EU Industrial Emissions Directive tightening NOx limits drives upgrades | 0.60% | EU-wide | Short term (≤ 2 years) |
| Hydrogen-ready turbine retrofits qualify for green-finance taxonomy | 0.40% | Germany, Netherlands, Denmark | Medium term (2-4 years) |
| Data-centre micro-grids adopting aero-derivative turbines for resilience | 0.30% | Ireland, Netherlands, Germany | Short term (≤ 2 years) |
| Synthetic-methane pilots in Scandinavia create niche demand pockets | 0.20% | Norway, Sweden, Finland | Long term (≥ 4 years) |
| Source: Mordor Intelligence | |||
Closure of ageing coal & nuclear fleets accelerates CCGT build-out
Europe’s retirement of legacy coal and nuclear units is concentrating demand on hydrogen-ready CCGT projects. Germany’s EnBW has allocated EUR 1.6 billion (USD 1.73 billion) to replace coal units with 1.34 GW of gas capacity across Heilbronn and Altbach/Deizisau, underlining the urgency to plug baseload gaps before 2030 phase-out deadlines.[3] Similar replacement campaigns are unfolding in the UK and France, where ageing gas and nuclear fleets, respectively, require swift capacity injections. Modern H-class turbines, already proven at 64% combined-cycle efficiency, pair that thermal performance with sub-30-minute start times and therefore fit the constrained investment window created by high carbon prices. The compressed timeline is pushing utilities to favour proven gas technology over nascent long-duration storage options while maintaining a clear pathway to burn hydrogen blends as soon as 2028.
Renewables intermittency amplifies need for fast-ramping gas turbines
With renewables set to account for over 60% of the EU's generation mix by 2030, grid operators face sharper “duck-curve” ramp events and regular Dunkelflaute periods. Aero-derivative turbines, such as GE’s LM2500, reach full load in under 10 minutes. Ansaldo Energia’s AE94.3A, installed at Marbach, delivers up to 50 MW/minute ramp rates.[4] Grid codes now value flexible starts over record thermal efficiency, so OEMs are investing in variable inlet guide vanes and blow-off extraction that trim minimum load by 19% without breaching emissions limits. The European Commission projects an additional 19 GW of fast-start gas assets will be required by 2030, a volume significant enough to sustain order books even as batteries proliferate.
EU Industrial Emissions Directive tightening NOx limits drives upgrades
Revised limits of 100-200 mg/Nm³ for gaseous fuels oblige operators to retrofit dry low-emission combustion or face curtailed run hours. GE’s LM2500 upgrade at Helmond reduced NOx to 25 ppm and eliminated the need for water injection, illustrating the retrofit path for approximately 15 GW of the European fleet that predates 2010 standards. Compliance deadlines in 2025 compress decision cycles and channel investment toward OEMs offering drop-in DLE kits alongside digital combustion monitoring. Additionally, the Directive introduces stricter reporting and community consultation, raising non-compliance penalties and risk premiums that favour modern units.
Hydrogen-ready turbine retrofits qualify for green-finance taxonomy
The EU taxonomy recognises gas turbines capable of burning 30% hydrogen today and 100% by 2030 as sustainable economic activities. Siemens Energy’s HYFLEXPOWER project has already demonstrated full hydrogen combustion at an industrial cogeneration site, giving investors the confidence to issue green bonds at a cost up to 50 basis points lower. Banks are increasingly screening deals for hydrogen capability, meaning OEMs that provide validated upgrade roadmaps experience shorter sales cycles. Yet, developers must still clear lifecycle-emissions tests, so engineering scopes routinely include pipeline metallurgy and supply-chain audits to qualify for the financing discount.
Restraints Impact Analysis of Europe Gas Turbine Market*
| Restraint | (~) % Impact on CAGR Forecast | Geographic Relevance | Impact Timeline |
|---|---|---|---|
| Rapid cost declines in grid-scale batteries erode peaking-plant revenues | -0.90% | UK, Germany, Netherlands | Medium term (2-4 years) |
| EU ETS carbon-price surpassing EUR 90/t raises CCGT dispatch costs | -0.70% | EU-wide | Short term (≤ 2 years) |
| Volatile LNG import prices compress OEM service-contract margins | -0.50% | Import-dependent regions | Short term (≤ 2 years) |
| Methane-leakage activism triggers permit delays for new gas pipes | -0.30% | Germany, Netherlands, UK | Medium term (2-4 years) |
| Source: Mordor Intelligence | |||
Rapid cost declines in grid-scale batteries erode peaking-plant revenues
Lithium-ion storage now delivers 80-90% round-trip efficiency, undercutting the 35-45% net efficiency of open-cycle gas peakers. Italy’s Terna expects 71 GWh of new storage by 2030, and, in modeling scenarios, peaker fleet run-hours fall by 15-20%. Because batteries can clear frequency-response markets with sub-second reaction, revenue stacking opportunities once reserved for turbines are migrating to storage. OEMs are responding by bundling turbine-plus-battery hybrids, but margins on the battery portion are slimmer.
EU ETS carbon-price surpassing EUR 90/t raises CCGT dispatch costs
Spot carbon already trades above EUR 90/t and the futures curve steepens to EUR 70-75/t for 2030. Every EUR 10/t adds EUR 4/MWh to a 54% efficient CCGT, narrowing the spark spread against subsidised renewables. Utilities, therefore, restrict run hours to peak pricing blocks, cutting capacity factors and service contract hour accrual. The Market Stability Reserve injects further scarcity of allowances, amplifying volatility that complicates fuel procurement.
*Our forecasts treat driver/restraint impacts as directional, not additive. The impact forecasts reflect baseline growth, mix effects, and variable interactions.
Europe Gas Turbine Market Segment Analysis
By Capacity:
Large Turbines Dominate, Small Units Drive GrowthTurbines rated above 120 MW captured 39.40% of the European gas turbine market share in 2025, confirming utilities’ reliance on large H-class frames that deliver 64% combined-cycle efficiency and dispatchable inertia during renewable ramp events. This scale advantage secures long-term ancillary-service revenue and maintains high capacity factors even after carbon costs are internalized, thereby underpinning a sizable portion of the European gas turbine market size. Demand for the middle 30-120 MW class remains steady because industrial parks and mid-scale municipals continue to standardize cogeneration packages that balance electricity and steam loads while maintaining compliance with the EU Industrial Emissions Directive. Project sponsors favor turnkey procurement that bundles turbine, HRSG, and digital twin, shortening execution windows to 24–30 months and easing financing approval.
The sub-30 MW tier, although contributing a modest share today, is advancing at a 5.4% CAGR through 2031, the fastest within the capacity spectrum, driven by data center microgrids, district heating upgrades, and islanded manufacturing clusters. Aeroderivative machines, such as GE Vernova’s LM2500XPRESS, reach full load in 10 minutes and are rolled off trucks as ISO containers, attributes that bypass the protracted civil works timelines plaguing large greenfield builds. Favorable permitting for distributed resources and the absence of stringent grid connection codes for small units further reduce development risk. Manufacturers are layering dry-low-emission combustors onto these frames, enabling emissions of < 25 ppm NOx without water injection, a feature that aligns with urban air-quality regulations. As Europe’s Big Tech sector doubles its server footprint by 2027, incremental micro-grid orders are expected to compound, lifting both parts and service revenue across this high-growth slice of the European gas turbine market.
By Operating Cycle:
Combined Cycle Leadership, CHP AccelerationCombined-cycle plants held a commanding 60.40% share of the European gas turbine market in 2025, as their 30-minute start capability and thermal efficiency of over 60% meet utilities’ twin goals of coal-to-gas replacement and renewable balancing flexibility. Capacity-market auctions in the UK and Germany’s Kraftwerkstrategie guidelines explicitly reward CCGT assets that can sustain 4-hour continuous output at short notice, a criterion that entrenches their procurement priority. Operators are upgrading inlet-chilling and fast-ramp valve control to shave 5–10 minutes off cold-start curves, preserving competitiveness against rapidly falling battery prices. The European gas turbine market size for simple-cycle peakers remains niche yet persistent, anchored by oil-and-gas field power and emergency black-start duties, where capital expenditure (CAPEX) and footprint take precedence over thermal performance.
Cogeneration and district-heating configurations, clustered under CHP, are projected to expand at a 5.9% CAGR to 2031, reflecting their ability to convert 80–90% of fuel energy into useful output for factories and communal heat grids. Denmark, Finland, and Poland have already legislated heat infrastructure modernisation subsidies that reimburse up to 30% of CHP capital expenditure, tilting investment economics toward on-site turbines over imported biomass boilers. EU taxonomy recognition of high-efficiency cogeneration unlocks concessional debt, luring chemicals, pulp and paper, and beverage producers to hedge volatile power prices with embedded generation. Competitive procurement now asks vendors to deliver turnkey CHP islands that integrate condensing reheaters, absorption chillers,s, and hydrogen-ready burners, ensuring regulatory compliance through 2040. These features position advanced CHP packages as the fastest-growing segment within the European gas turbine market in terms of operating cycles.

By Fuel Type:
Natural Gas Dominance, Alternative Fuels SurgeNatural gas retained 75.30% of the European gas turbine market share in 2025, secured by extensive pipeline networks, six LNG regas hubs, and well-established commodity-trading liquidity that de-risks feedstock supply. Even so, spark-spread compression under €90/t CO₂ pricing is prompting utilities to invest in higher-efficiency frames and variable-load optimization software, thereby protecting margins as carbon costs rise. Turbines exposed to LNG volatility are signing indexed service agreements that flex maintenance intervals with run-hour variability, a tactic that shields lifecycle cash flow and sustains the largest fuel slice of the European gas turbine market size.
Alternative fuels—hydrogen, synthetic methane, biogas, and renewable natural gas—are projected to record an 8.2% CAGR through 2031, the sharpest within the fuel taxonomy, as the EU green-finance rulebook classifies hydrogen-ready retrofits as sustainable economic activities. HYFLEXPOWER recently demonstrated 100% hydrogen combustion on an SGT-400 industrial unit, validating OEM claims and unlocking bond spreads 50 basis points below those of conventional debt. Wärtsilä and Vantaa Energy’s 2027 synthetic-methane plant demonstrates a complementary path that leverages existing pipelines while achieving carbon-neutral cycles. At the distribution edge, biogas blends in municipal digesters are attracting orders for 5–15 MW turbines, reinforcing localized energy circularity goals. These developments collectively move non-fossil fuels from pilot to commercial scale, amplifying diversification momentum inside the European gas turbine market.
By End-User Industry:
Utilities Lead, Industrial Applications AccelerateUtilities accounted for 63.20% of the European gas turbine market size in 2025, a result of their legal requirement to guarantee reserve capacity and their access to stabilized, tariff-backed capital structures. Their procurement focus is on 250-600 MW hydrogen-ready CCGT blocks that back-fill retiring coal capacity and supply spinning reserve during Dunkelflaute events. Utilities are also pioneering hybrid layouts where a 50 MWh battery stack couples to an H-class turbine, delivering fast-frequency response without burning fuel and thus limiting EUA exposure. These structural advantages lock utilities into the top demand slot, but growth is tapering to sub-4 % because most zero-coal replacement has already been contracted through 2027 auctions.
Industrial and “other” customers—encompassing oil-and-gas midstream, marine propulsion, and hyperscale data centers—are advancing at a 5.7% CAGR, pushing the European gas turbine market toward a more diversified buyer base. CHP economics remain the prime catalyst: every tonne of steam recovered displaces 45 m³ of natural gas that would otherwise be burned in a separate boiler, thereby trimming carbon bills by roughly €4/t under present EUA prices. The International Maritime Organization’s Tier III sulphur cap is likewise prompting ferry operators to trial 30 MW gas-fueled engines in place of heavy fuel oil, opening a maritime niche. On land, data centre operators in Dublin and Amsterdam are commissioning twin-pack LM2500 units, configured for 50% hydrogen blends and 98% availability, which mitigates grid connection delays and curtailment risk. Collectively, these forces propel non-utility uptake and diversify service revenue pools across the wider European gas turbine market.
Geography Analysis
Germany Gas Turbine Market
Germany anchored 21.70% of the European gas turbine market in 2025, thanks to its Energiewende policy, which phases out coal by 2030 and has already retired nuclear power. EnBW’s EUR 1.6 billion (USD 1.73 billion) spend on 1.34 GW of hydrogen-ready CCGT at Heilbronn and Altbach/Deizisau is emblematic of the national push to secure dispatchable, low-carbon electricity. RWE’s pending 800 MW hydrogen-capable build at Gersteinwerk will extend this momentum, further bolstering the European gas turbine market size linked to German projects. Federal subsidies that refund up to 50% of electrolyser CAPEX ensure that green hydrogen will be available for blending by the time the first block reaches commercial operation in 2028.
Spain Gas Turbine Market
Spain is recording the continent’s sharpest growth at a 5.6% CAGR, reflecting record-high solar and wind additions that now exceed 30 GW and generate volatile residual-load curves. The government’s 2025-2030 network plan earmarks EUR 6 billion for grid modernisation, of which at least 2 GW will be fast-start gas peakers strategically located near renewable clusters in Aragón and Extremadura. Spain also benefits from existing LNG regasification terminals and pipeline interconnections with North Africa, which diversify feed-gas supply and underpin bankable offtake contracts. These factors combine to keep the EEuropeangas turbine market highly relevant for Spanish utilities aiming to bridge the last mile toward a 100% renewable portfolio by 2050.
Broader European Markets
The UK, Netherlands, France, and Italy collectively form a secondary but still substantial pillar of demand. British capacity-market auctions guarantee availability payments for at least 15 years, de-risking asset-financing and nudging brownfield stations to reinvest in life-extension or derating upgrades. The Netherlands has positioned itself as a hydrogen trading hub, allocating EUR 9 billion to step up electrolyzer capacity that will eventually feed dual-fuel turbines at the Maasvlakte and Magnum sites. France’s extended nuclear outages during 2024-25 have underscored the need for peaking-capacity insurance, prompting EDF to sign a three-year master service agreement covering 20 heavy-duty turbines in both metropolitan and overseas territories. Italy, meanwhile, is channeling EU Recovery Fund proceeds into 1 GW of industrial cogeneration projects, designed around 40-90 MW turbines, thereby further diversifying the customer mix of the European gas turbine market.

Regulatory Landscape
The regulatory baseline for gas turbines in Europe is shaped by emissions controls for combustion plants and EU-wide energy-market reforms. The Industrial Emissions Directive update (Industrial and Livestock Rearing Emissions Directive 2.0) entered into force in August 2024, reinforcing permitting, reporting, and performance expectations for large combustion plants, alongside existing NOx-focused compliance drivers that continue to drive retrofit activity under the broader Industrial Emissions framework.
Directive (EU) 2024/1788 (in force since June 2024) established common rules for the internal markets for renewable gas, natural gas, and hydrogen. This supports integration of low-carbon gases and related infrastructure planning, which in turn affects turbine fuel-flexibility requirements in tenders. Regulation (EU) 2026/261 (January 2026) set a framework to reduce EU exposure to Russian natural gas and to prepare for phasing out Russian oil imports, influencing gas infrastructure strategy and security-of-supply considerations for gas-fired generation investments. At the equipment level, adjacent product rules also affect turbine islands: from 24 July 2026, new stand-alone fans placed on the EU market must meet updated ErP performance and product-information requirements, which can shape balance-of-plant specifications for power and CHP installations.
Competitive Landscape
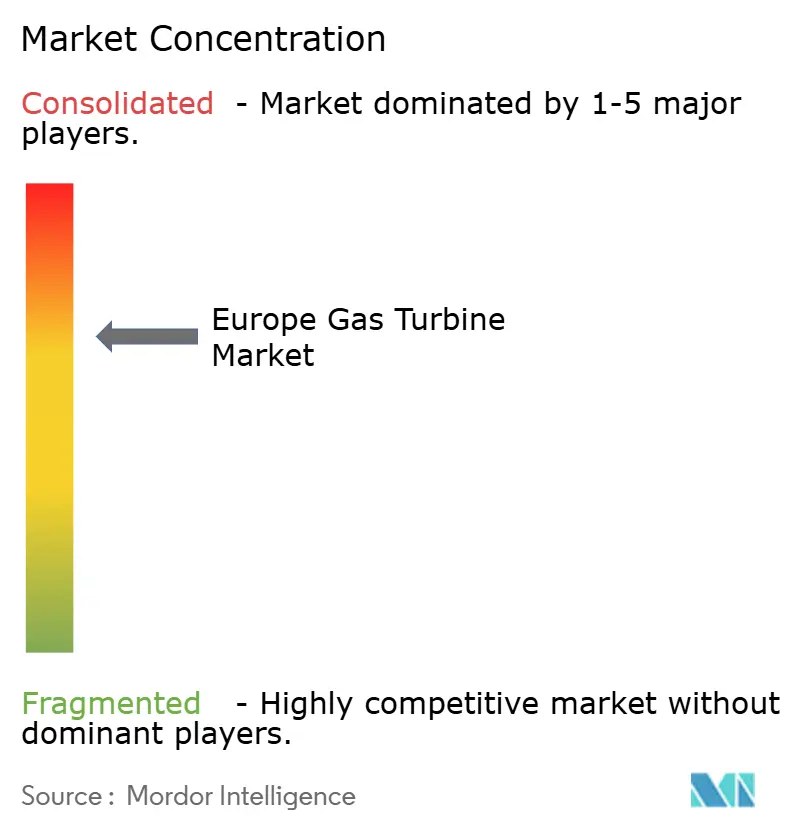
Siemens Energy, GE Vernova, and Mitsubishi Power Europe collectively account for roughly 60% of new-build orders, resulting in a moderate market concentration. All three have validated 100% hydrogen combustion for at least one frame size while meeting the sub-25 ppm NOx requirement, which has become the de facto technical tender requirement. Service contracts now represent 60-70% of the life-cycle value, shifting competitive intensity from pure capital expenditure bidding to the depth of regional service depots and digital asset-performance platforms. GE Vernova’s acquisition of Woodward’s heavy-duty combustion assets exemplifies vertical integration strategies aimed at locking in proprietary know-how and shortening development lead times.
Second-tier players such as Ansaldo Energia, Solar Turbines, and Rolls-Royce are carving out niches. Ansaldo’s sequential-combustion architecture appeals to Italian and German operators who value in-situ fuel flexibility, while Solar’s 5-15 MW Taurus series rides the wave of distributed-energy and micro-grid adoption. Rolls-Royce is repackaging its Trent 60 platform for data centre standby markets, promising same-day starts after prolonged storage and fuel flexibility of up to 50% hydrogen. EthosEnergy, backed by One Equity Partners, continues to consolidate the aftermarket segment by securing multi-year fleet-wide service deals—its recently signed EDF agreement covers turbines built by five separate OEMs, underscoring how multi-brand expertise is now a strategic differentiator.
Digitalisation is the emerging battleground. OEMs embed physics-based twins to predict hot-section creep and turbine-blade oxidation with an accuracy of ±2°C, thereby extending inspection intervals by up to 1,000 equivalent starts. Hybridisation with batteries is also gaining traction; Siemens Energy and Fluence are jointly marketing a turnkey solution that retrofits a 50 MWh lithium-ion rack onto a 200 MW CCGT, enabling zero-fuel fast-frequency response. Smaller disruptors, such as SoftInergy, offer software overlays that optimize dispatch between turbine and battery, and even between multiple fuels. These layered solutions enhance customer stickiness and capture data monetisation streams, making the European gas turbine market more service-centric than ever.
Europe Gas Turbine Industry Leaders
-
General Electric Company
-
Mitsubishi Hitachi Power Systems Ltd
-
Siemens AG
-
Kawasaki Heavy Industries Ltd
-
Ansaldo Energia S.p.A.
- *Disclaimer: Major Players sorted in no particular order
Europe Gas Turbine Market Companies Covered in this Report
- General Electric Co.
- Siemens Energy AG
- Mitsubishi Power Europe
- Kawasaki Heavy Industries Ltd.
- Solar Turbines Europe S.A.
- Ansaldo Energia S.p.A.
- Rolls-Royce plc (MTU Aero Engines / Vericor)
- MAN Energy Solutions SE
- Harbin Electric International Co.
- Bharat Heavy Electricals Ltd.
- Doosan Škoda Power
- Capstone Green Energy Corp.
- OPRA Turbines B.V.
- Shanghai Electric Group Co.
- Zorya-Mashproekt
- ALSTOM (legacy fleet services)
- Siemens Industrial Turbomachinery AB (Sweden)
- Dresser-Rand (Siemens)
- EthosEnergy Group
- Turboden S.p.A. (micro-turbines)
Market Opportunities and Future Outlook
Coal-to-gas replacement and fast-start flexibility needs continue to create near-term whitespace for utility-scale CCGT and OCGT projects, especially where permitting timelines and grid-connection constraints favor proven dispatchable capacity. Poland is a visible anchor market: in March 2026, PGE signed EPC and service agreements with a consortium including Siemens Energy for two 600 MW open-cycle gas turbine units in Rybnik and Gryfino, and in July 2026 Tauron selected Ansaldo Energia to supply two AE94.3 gas turbines for a 600 MWe-class project, combining equipment supply with a large service scope. These transactions support an opportunity set for OEMs that bundle equipment with long-term service agreements, fast-ramping performance, and compliance-ready emissions packages.
Fuel-flexibility upgrades and hydrogen-capable combustion development also widen retrofit and new-build pathways linked to EU decarbonized-gas market rules (Directive (EU) 2024/1788) and EU hydrogen programs. On the technology side, HyPowerGT (Horizon project) is advancing dry-low emission hydrogen combustion toward TRL7 on a 16.9 MWe NovaLT16 turbine by 2026, which provides a clearer engineering route for higher hydrogen blends in industrial and distributed applications. In parallel, late-stage project pipelines in Eastern Europe add near-term execution volume for EPCs and service networks, including the Mintia CCGT project in Romania, which surpassed 83% completion by June 2026, and ORLEN Group’s CCGT Grudziadz, which delivered first power to Poland’s national grid during commissioning in July 2026. Overall, these programs and project milestones concentrate opportunity around hydrogen-ready specifications, lifecycle services, and delivery capacity for large-frame and fast-start units across utilities and industrial CHP.
Recent Industry Developments in Europe Gas Turbine Market
- July 2026: Tauron selected Ansaldo Energia to supply two AE94.3 gas turbines for a 600 MWe-class gas unit project, pairing the equipment order with a sizable long-term service package. The award reinforces competitive dynamics in large-frame utility procurement and highlights how service scope is increasingly integral to winning European tenders.
- September 2025: Energa SA signed agreements with a consortium including Siemens Energy for the design and construction of two 560-561 MWe CCGT units in Gdansk and Grudziadz, alongside long-term maintenance arrangements. The contracts add to Poland’s pipeline of coal-to-gas replacement projects and deepen OEM aftermarket positioning around multi-year service commitments.
- December 2024: Technip Energies and GE Vernova were awarded a major contract for the Net Zero Teesside Power project in the UK, featuring a 9HA.02 gas turbine and a 16-year maintenance service contract. The project links high-efficiency gas turbines with CCS-oriented project architecture, supporting a template for firm capacity procurement under tighter decarbonization constraints.
Europe Gas Turbine Market Report Scope and Research Methodology
Market Definition and Coverage
For this study, the market is defined as revenue earned from gas turbine equipment supplied in Europe for power generation and mechanical drive use, counted across new installations and replacement demand. Values are tracked in current USD and mapped to the point where the turbine is supplied into the region.
Scope exclusions: Excludes steam turbines and balance-of-plant equipment that sit outside the gas turbine equipment value.
Segments Covered in This Report
-
By Capacity
- Up to 30 MW
- 30 to 120 MW
- Above 120 MW
-
By Operating Cycle
- Combined Cycle
- Simple/Open Cycle
- Cogeneration/CHP
-
By Fuel Type
- Natural Gas
- Liquid Fuels (Diesel/Kerosene/LPG)
- Other Fuel Types (Hydrogen, Biogas)
-
By End-User Industry
- Power Utilities
- Oil and Gas
- Other End-user Industries (Industrial, Marine)
-
By Country
- United Kingdom
- Germany
- France
- Italy
- Spain
- Russia
- Rest of Europe
Data Sources, Market Sizing, and Validation
Desk Research
Desk research was used to set the factual backbone for the model, mainly around power sector activity, gas supply context, and policy signals that influence turbine ordering cycles in Europe. Public sources included Eurostat, ENTSO-E system data, the European Commission energy publications, the International Energy Agency, and releases from national grid operators and energy regulators to understand generation mix, capacity additions, and plant utilization.
To translate those signals into market math, we also reviewed company annual reports, investor presentations, trade association updates, and trade press for disclosed order wins, delivery timing, and product positioning. Where helpful, internal paid subscriptions for company financials and news, plus patent databases, were used to confirm ownership changes, technology direction, and major contract announcements without relying on a single source. These desk sources are illustrative only, and many other references were used for data collection, validation, and clarification.
Primary Interviews and Surveys
Primary work focused on interviews and survey-based checks with utilities, project developers, EPC-linked experts, turbine service providers, and component suppliers across key European markets, and then findings were compared back to the desk model. Respondent input was used to confirm typical procurement lead times, the split between simple cycle and combined cycle demand, and realistic pricing and delivery patterns by capacity range, so assumptions did not drift from what buyers and suppliers describe in practice.
Distribution of primary research fieldwork respondents
| Company type | Respondent position |
|---|---|
| Top tier: 38% | CXOs: 13% |
| Mid tier: 42% | Functional/Unit leaders: 33% |
| Smaller Players: 20% | Managers: 54% |
Market-Sizing & Forecasting
Sizing starts with a top-down build that reconstructs the demand pool from Europe power capacity additions, replacement cycles for aging units, and the share of projects that select gas turbines by capacity band and operating cycle. Once the demand pool is formed, it is converted into value using a price ladder that reflects typical unit pricing differences between small turbines and large frame turbines, and then adjusted for country mix.
To keep the totals practical, results are corroborated through selective bottom-up approximations, including a roll-up of visible project awards, sampled unit counts by country, and channel checks on average selling price movement where inflation and material costs have been changing. A few inputs that matter most in this market include combined-cycle versus simple/open-cycle ordering share, gas price and supply security signals, grid flexibility needs driven by variable renewables, permitting and emissions compliance timelines, and utilization trends for existing CCGT fleets. Forecasts are built using scenario analysis with a base case anchored to expected power demand and capacity replacement needs, then stress-tested with primary feedback on how quickly projects can move from planning to turbine delivery. Where bottom-up visibility is limited in smaller countries, gaps are handled by applying peer-country ratios tied to installed base and planned capacity, followed by a reasonableness check with experts.
Data Validation & Update Cycle
Validation is done through several passes so unusual outputs are caught early, such as a sudden jump in implied unit counts, an unrealistic price swing, or a country total that does not align with known build activity. Our team compares the model outputs with independent signals like installed capacity changes, public project pipelines, and generation mix data, and then variances are investigated and corrected before sign-off.
The report is refreshed annually, and we also trigger interim checks when major events occur, such as policy shifts that change gas plant economics, large cancellations, or unexpected order announcements. Before delivery, an analyst does a final sweep across key assumptions and recent news so clients receive the most up-to-date view available at the time.
Mordor Intelligence's Europe Gas Turbine Market Sizing Compared With Other Published Estimates
Published market sizes for Europe gas turbines often look far apart, even when everyone is discussing similar end uses, because included revenue streams and timing assumptions are not the same. Differences usually come from what is counted as the market, which year is treated as the base, and how pricing is escalated when equipment costs and FX rates move.
Generator sets and full power-plant EPC packages sit outside Mordor Intelligence's scope, which keeps the estimate focused on gas turbine equipment revenue rather than broader project spend that can inflate totals. In practice, common gap drivers are whether services are blended into equipment value, how combined-cycle versus simple cycle mix is assumed to evolve, and how replacement demand is treated in countries with older fleets and lower utilization.
Benchmark comparison
| Source | Market Size | Gaps in Research Methodology |
|---|---|---|
| Mordor Intelligence | USD 7.29 B (2025) | |
| Global Consultancy A | USD 5.67 B (2024) | Uses an earlier base year and appears to apply a narrower revenue capture that emphasizes core power generation demand, with less visibility on mechanical drive and country-level replacement timing. |
| Industry Publisher B | USD 2.75 B (2024) | Leans toward a tighter definition centered on power generation technology mix, and the value level suggests a smaller scope or a different price basis that likely excludes parts of the broader Europe demand pool. |
The spread in the table is mainly explained by what gets counted as market value and how the base year and pricing basis are set. When equipment-only revenue is separated cleanly from wider plant spend, and when country mix and replacement cycles are checked against real project activity, the resulting number becomes easier to track and reproduce year over year.
Key Questions Answered in the Report
What is the current size of the Europe gas turbine market?
The Europe gas turbine market size is USD 7.65 billion in 2026 and is forecast to grow to USD 9.77 billion by 2031.
Which capacity segment is expanding the fastest?
Sub-30 MW turbines are projected to grow at a 5.4% CAGR through 2031, supported by distributed-generation and data-centre micro-grid projects.
How is hydrogen shaping future turbine investments?
EU green-finance taxonomy rewards hydrogen-ready turbines, enabling lower-cost capital and accelerating retrofits that can blend 30% hydrogen now and transition to 100% by 2030.
Why are utilities still investing in gas turbines despite battery cost declines?
Gas turbines offer rapid-response flexibility and large-scale inertia required to stabilise grids with 60% renewable penetration, functions current batteries cannot fully replace at scale.
Which country leads the regional market today, and which is growing fastest?
Germany leads with a 21.70% revenue share, while Spain is forecast to post the highest 5.6% CAGR due to its aggressive renewable build-out and supportive grid policies.
How does the EU ETS influence gas turbine dispatch?
A carbon price above EUR 90/t raises CCGT variable costs, reducing baseload hours and pushing operators to run mainly during peak-price periods to preserve margins.