
Market Overview
| Study Period | 2021 - 2031 |
|---|---|
| Forecast Data Period | 2026 - 2031 |
| Historical Data Period | 2021 - 2024 |
| Market Size (2026) | USD 3.86 Billion |
| Market Size (2031) | USD 17.25 Billion |
| Growth Rate (2026 - 2031) | 34.91 % |
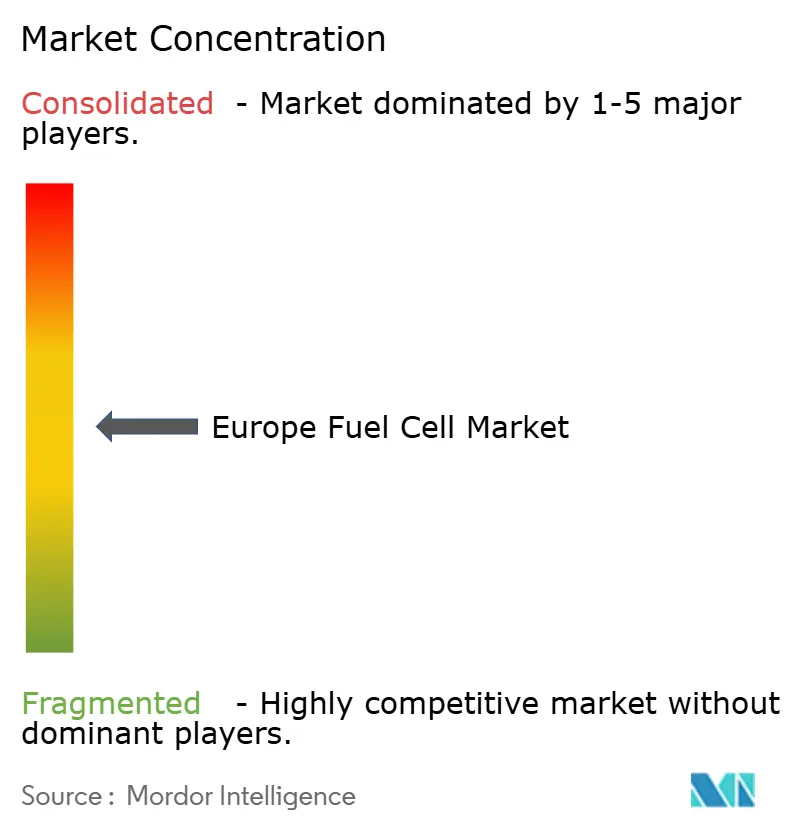
| Market Concentration | Medium |
Major Players *Disclaimer: Major Players sorted in no particular order Image © Mordor Intelligence. Reuse requires attribution under CC BY 4.0. | |

Europe Fuel Cell Market Analysis by Mordor Intelligence
The Europe Fuel Cell Market size is estimated at USD 3.86 billion in 2026, and is expected to reach USD 17.25 billion by 2031, at a CAGR of 34.91% during the forecast period (2026-2031).
Binding EU decarbonization mandates, falling electrolyser costs, and fleet-procurement commitments are propelling the European fuel cell market toward large-scale commercialization. Surplus offshore wind is driving levelized hydrogen prices below EUR 3.50 per kilogram in Denmark and the Netherlands, allowing heavy-duty trucks to reach total-cost-of-ownership parity with diesel. Concurrently, IPCEI-backed gigafactories from Bosch, ElringKlinger, PowerCell Sweden, and Symbio are cutting stack costs through automated production lines. The competitive landscape remains fragmented, offering regional specialists room to win municipal fleet contracts, while North American and Asian entrants localize manufacturing to satisfy European content rules. Platinum dependence and impending PFAS restrictions pose near-term cost and regulatory headwinds, yet preferential green-finance taxonomy treatment is unlocking low-cost capital and lowering project IRR hurdles.
Key Report Takeaways
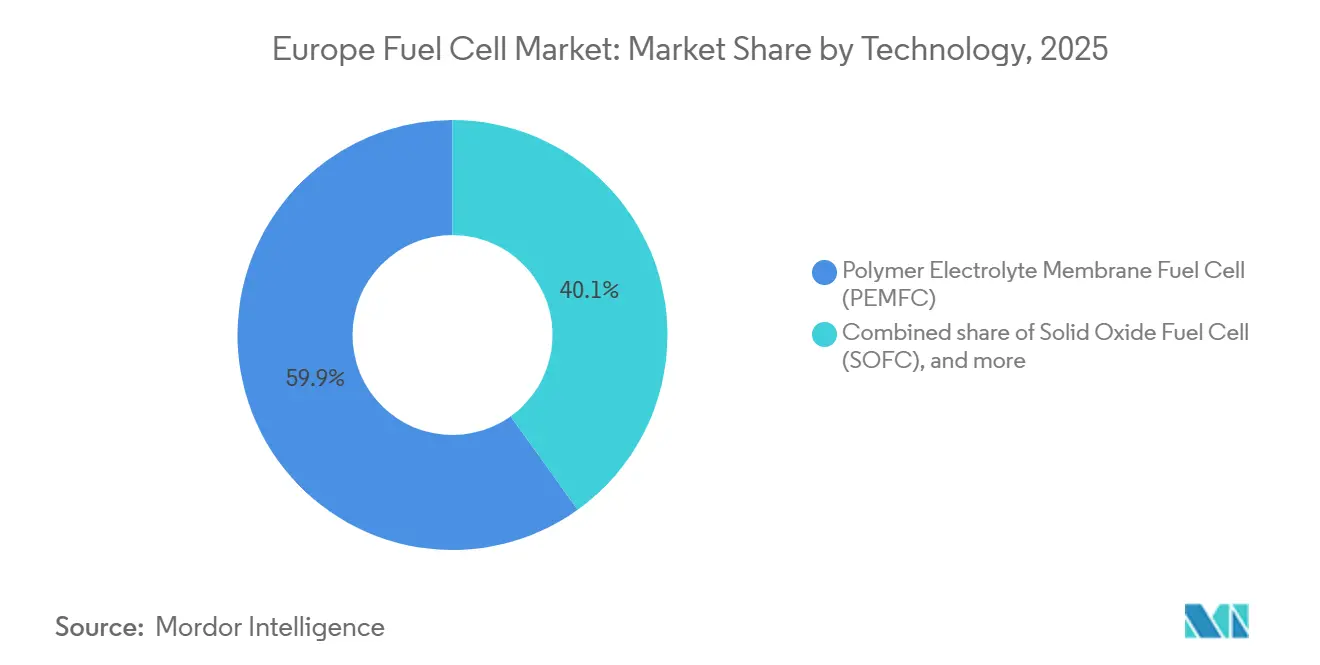
- By technology, polymer electrolyte membrane fuel cells (PEMFC) led with 59.9% revenue share of the European fuel cell market in 2025; Solid Oxide Fuel Cells are projected to post the fastest 47.5% CAGR through 2031.
- By fuel type, hydrogen captured a 61.3% share of the European fuel cell market size in 2025, while ammonia is forecast to advance at a 51.1% CAGR between 2026-2031.
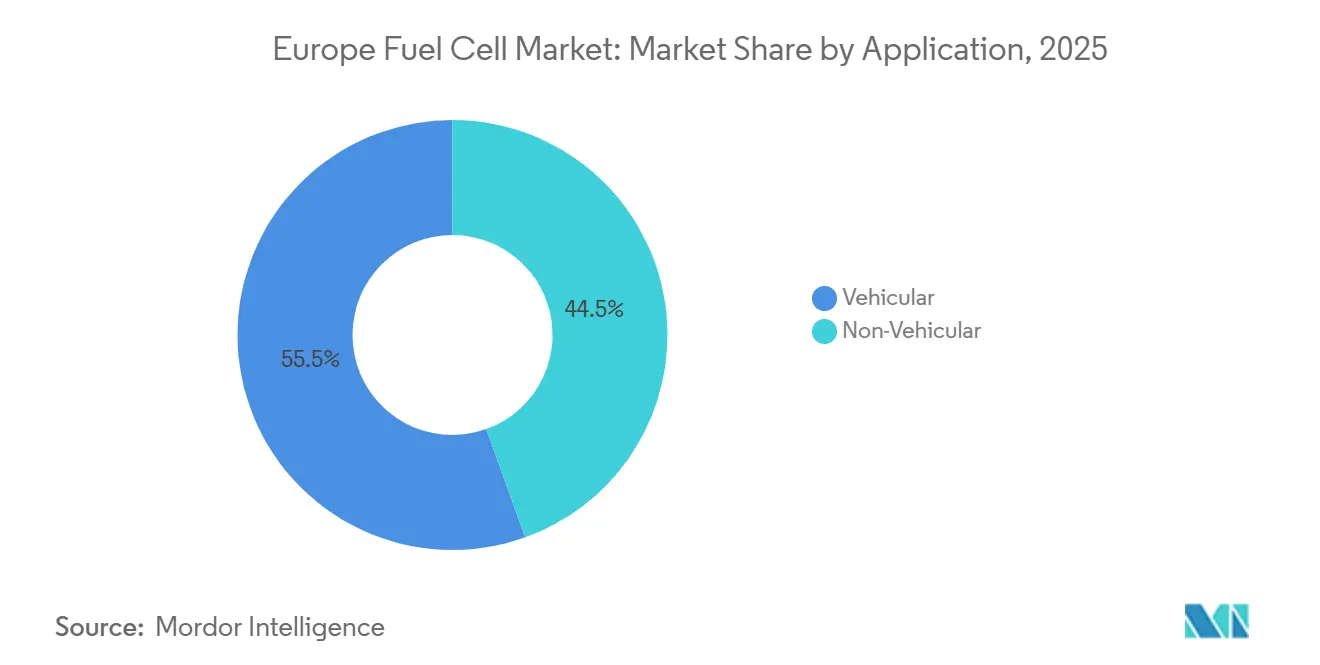
- By application, vehicular deployments accounted for 55.5% of the European fuel cell market share in 2025 and are expected to grow at a 39.9% CAGR to 2031.
- By end-user industry, transportation dominated with 58.2% revenue share in 2025; utilities represent the fastest-growing segment, expanding at 43.3% CAGR during 2026-2031.
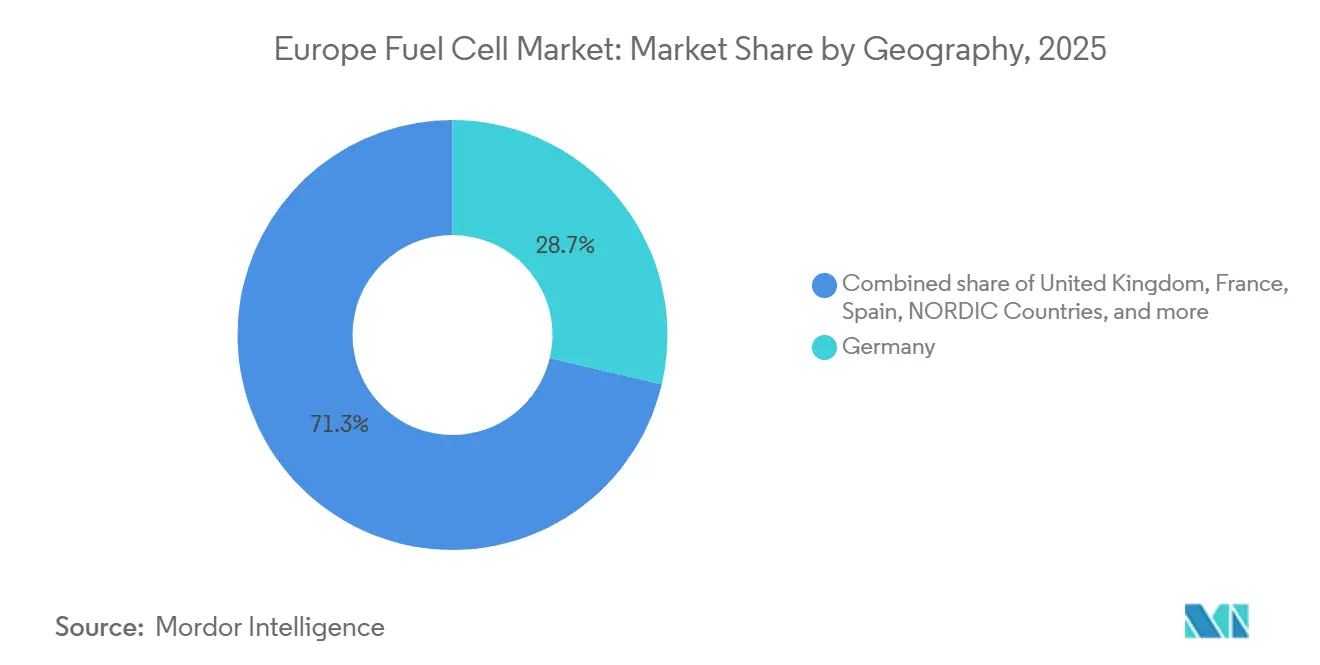
- By geography, Germany held 28.7% of the European fuel cell market in 2025, whereas France is on track for the highest 40.7% CAGR through 2031.
Note: Market size and forecast figures in this report are generated using Mordor Intelligence’s proprietary estimation framework, updated with the latest available data and insights as of January 2026.
Market Trends and Insights
Drivers Impact Analysis of Europe Fuel Cell Market*
| Driver | (~) % Impact on CAGR Forecast | Geographic Relevance | Impact Timeline |
|---|---|---|---|
| EU Green Deal & Fit-for-55 hydrogen targets | +8.2% | Pan-European, strongest in Germany, France, Netherlands | Medium term (2-4 years) |
| Rapid build-out of electrolyser & H₂-refuelling infrastructure | +7.5% | Germany, Netherlands, Denmark, France, with spillover to Belgium and Austria | Medium term (2-4 years) |
| Corporate fleet decarbonization commitments (buses & trucks) | +6.8% | Germany, France, UK, Italy, Nordic countries | Short term (≤ 2 years) |
| IPCEI-backed fuel-cell gigafactories reducing stack costs | +5.9% | Germany, France, Sweden, Netherlands | Long term (≥ 4 years) |
| Surplus North-Sea wind-to-hydrogen projects lowering LCOH | +4.3% | Denmark, Netherlands, UK, Germany (coastal regions) | Medium term (2-4 years) |
| EU sustainable-finance taxonomy unlocking low-cost capital | +3.6% | Pan-European, particularly France, Germany, Spain | Long term (≥ 4 years) |
| Source: Mordor Intelligence | |||
EU Green Deal & Fit-for-55 Hydrogen Targets
The Fit-for-55 package requires 42% of industrial hydrogen to come from renewable sources by 2030, rising to 60% by 2035, anchoring demand for fuel-cell applications across mobility and distributed power.[1]European Commission, “Fit-for-55 Legislative Package,” europa.eu Germany’s 2024 National Hydrogen Strategy sets aside EUR 3.5 billion for 10 gigawatts of domestic electrolysers, while France’s Plan Hydrogène 2.0 allocates EUR 5.4 billion for 6.5 gigawatts and 1,000 heavy-duty refueling points by 2030.[2]Reuters Staff, “France Updates Plan Hydrogène 2.0,” reuters.com The REPowerEU initiative targets 20 million tonnes of hydrogen consumption by 2030, stabilizing long-term offtake for the European fuel cell market. Renewable Fuel of Non-Biological Origin standards finalized in 2024 demand 70% lifecycle emissions savings versus fossil hydrogen, driving green-hydrogen projects. These policy anchors reduce regulatory risk for fleet operators evaluating multi-year investment horizons.
Rapid Build-Out of Electrolyser & H₂-Refuelling Infrastructure
Operating electrolyser capacity climbed to 6.1 gigawatts by end-2025, with another 12 gigawatts in construction or committed financing. Germany’s H2Global awarded EUR 900 million in import contracts, while the Netherlands completed 52 heavy-duty stations that close the Rotterdam-Lower Saxony corridor.[3]H2Global Foundation, “H2Global Contract Awards,” h2global.de Denmark’s HySynergy couples a 250-megawatt electrolyser with offshore wind at Esbjerg, delivering hydrogen at EUR 3.20 per kilogram. TotalEnergies will retrofit 600 European service stations with hydrogen dispensers by 2028, accelerating network density. Infrastructure coverage is now sufficient for logistics managers to route long-haul trucks without detours, addressing a critical European fuel cell market adoption barrier.
Corporate Fleet Decarbonization Commitments (Buses & Trucks)
Operators ordered 4,200 fuel-cell buses and 1,800 trucks during 2024-2025 as municipal zero-emission zones multiplied across Europe.[4]Transport & Environment, “Zero-Emission Zones Tracking,” transportenvironment.org Germany’s subsidy program covers up to 80% of the incremental cost for heavy-duty trucks above 18 tonnes, spurring a 340% order surge. IKEA will shift 600 long-haul trucks to hydrogen by 2030 and co-develop refueling at 14 hubs with Cummins and Plug Power. France’s RATP awarded a EUR 180 million contract for 250 fuel-cell buses to Symbio and Alstom, citing range and refueling advantages over battery alternatives. The UK requires all new buses sold in England to be zero-emission from 2025, ensuring steady demand for the European fuel cell market.
IPCEI-Backed Fuel-Cell Gigafactories Reducing Stack Costs
The European Commission cleared EUR 5.2 billion of state aid in 2024 for 18 hydrogen technology projects, including multi-gigawatt fuel-cell lines. Bosch-Volvo’s cellcentric facility in Stuttgart can build 2 gigawatts of PEMFC stacks annually, targeting a 40% cost cut through automation. ElringKlinger’s Dettingen plant achieved EUR 110 per kilowatt stack costs for 5,000-unit orders, down from EUR 185 in 2023. PowerCell Sweden is scaling its S3 platform to 500 megawatts by 2026 using titanium-coated plates that remove gold plating. These localized gigafactories strengthen supply security and accelerate learning curves inside the European fuel cell market.
Restraints Impact Analysis of Europe Fuel Cell Market*
| Restraint | (~) % Impact on CAGR Forecast | Geographic Relevance | Impact Timeline |
|---|---|---|---|
| High platinum content & upfront CAPEX | -4.7% | Pan-European, most acute in Southern and Eastern Europe | Short term (≤ 2 years) |
| Sparse heavy-duty H₂ corridor coverage | -3.2% | Eastern Europe, Iberian Peninsula, Southern Italy | Medium term (2-4 years) |
| Impending PFAS restrictions on PEM membranes | -2.8% | Pan-European, regulatory enforcement strongest in Germany, Netherlands, Denmark | Medium term (2-4 years) |
| Grid-congestion delays to renewable-powered electrolysers | -2.1% | Germany (southern states), Spain (Andalusia, Castile), Italy (Sicily) | Short term (≤ 2 years) |
| Source: Mordor Intelligence | |||
High Platinum Content & Upfront CAPEX
PEMFCs require 0.3-0.5 grams of platinum per kilowatt, translating to USD 150-200 per kilowatt in catalyst cost at 2025 spot prices, roughly 25-30% of stack expense. Spain and Italy, where subsidies cover 40-50% of incremental cost, see payback periods stretching beyond typical fleet refresh cycles. Platinum supply is concentrated in South Africa and Russia, exposing European buyers to geopolitical risk. Recycling covers only 15-20% of end-of-life stacks versus 95% for catalytic converters, forcing reliance on virgin metal. Horizon Europe projects aim to commercialize PGM-free cathodes, but durability remains below the 10,000-hour target for heavy-duty trucks, constraining near-term cost reduction.
Sparse Heavy-Duty H₂ Corridor Coverage
Although Germany, the Netherlands, and Denmark enjoy dense refueling networks, Eastern Europe, the Iberian Peninsula, and Southern Italy have fewer than five 700-bar truck stations each, forcing detours or dual-fuel operation. Fleet operators in Poland and Portugal, therefore, delay orders, dampening the European fuel cell market’s regional uptake until EU cohesion funds deliver additional corridors by 2028.
*Our forecasts treat driver/restraint impacts as directional, not additive. The impact forecasts reflect baseline growth, mix effects, and variable interactions.
Europe Fuel Cell Market Segment Analysis
By Technology:
SOFC Gains on Efficiency ArbitrageSolid Oxide Fuel Cells are scaling at a 47.5% CAGR during 2026-2031, driven by an 85-90% combined heat-and-power efficiency at industrial sites. Ceres Power’s Steel Cell operates at 500-650 °C, avoiding precious-metal catalysts and accepting natural gas, biogas, or hydrogen feeds, lowering fuel-switching risk. Bloom Energy installed 240 megawatts of SOFCs across European data centers in 2024-2025, providing 99.9% uptime. In contrast, Polymer Electrolyte Membrane Fuel Cells retained 59.9% market share in 2025 as rapid start-up and compact packaging underpin bus and truck applications. Within stationary power, phosphoric-acid and molten-carbonate technologies now account for less than 5% of the European fuel cell market size and continue to decline.
SOFC vendors benefit from policies that count high-temperature cogeneration toward industrial decarbonization targets. The European Commission’s 2024 study projected SOFC total-cost-of-ownership undercutting gas engines by 2028 if hydrogen prices drop below EUR 4.00 per kilogram. Bosch’s cellcentric venture is also integrating PEMFCs with battery-electric drivetrains for a 1,000-kilometer truck range, showing how multi-technology portfolios can hedge regulatory and material-cost risk. Consequently, technology choice is fragmenting along application lines inside the European fuel cell market.


By Fuel Type:
Ammonia Emerges as Cracking-Free PathwayHydrogen held a 61.3% share in 2025 due to established 700-bar standards that mirror diesel refueling times. However, ammonia is outstripping all other fuels with a 51.1% CAGR through 2031 as maritime and island grids seek higher energy density and simpler logistics. Siemens Energy and Alfa Laval’s 2-megawatt direct-ammonia SOFC aboard a Maersk vessel reached 60% efficiency without onboard cracking, meeting IMO Tier III NOx rules. Spain’s Balearic Islands contracted AFC Energy for a 20-megawatt ammonia plant that displaces diesel gensets. Natural-gas-fed SOFCs captured a 12-15% share but face growth limits because fossil-derived fuels lack green-finance alignment.
IMO’s mid-term GHG strategy mandates a 20% intensity cut by 2030 and 70% by 2040, making ammonia fuel cells central to transoceanic compliance. Methanol remains confined to regional fleets near production hubs, while biogas fuel cells occupy a negative-carbon-intensity niche at wastewater plants. Consequently, fuel diversification is reshaping supply chains and refueling infrastructure within the European fuel cell market.
By Application:
Heavy-Duty Vehicular Dominates, Stationary GainsVehicular deployments claimed a 55.5% share in 2025 and are rising at a 39.9% CAGR. Zero-emission-zone mandates across 12 cities ban diesel buses and trucks above 3.5 tonnes by 2028, pushing operators toward hydrogen over batteries on routes exceeding 250 kilometers. Daimler Truck, Volvo, and Scania plan serial production from 2026-2027, while Alstom’s Coradia iLint trains replace diesel units on non-electrified lines without costly catenary investment. Material-handling equipment contributes 8-10% of vehicle volume, leveraging Plug Power’s turnkey systems.
Stationary, portable, and micro-CHP applications collectively represent a 44.5% share and expand at a 30-32% CAGR. Bloom Energy, Doosan Fuel Cell, and SFC Energy deployed 380 megawatts in 2024-2025 across data centers and hospitals, where 99.9% uptime is essential. Utilities deploy fuel-cell peakers for 4-8 hour storage, smoothing wind variability without lithium exposure. Marine pilots demonstrate high-temperature SOFC viability, positioning shipping as a future growth vector for the European fuel cell market.
By End-User Industry:
Utilities Accelerate Grid BalancingTransportation dominated the European fuel cell market size with 58.2% revenue share in 2025. Utilities are growing fastest at 43.3% CAGR as grid operators procure fuel-cell peakers and co-located electrolysers to arbitrage off-peak renewables. Germany’s TenneT ordered 150 megawatts to stabilize high-wind corridors, while EDF pilots 50-megawatt SOFCs at nuclear plants to re-electrify hydrogen during evening peaks. Commercial and industrial facilities account for a 22-25% share as data-center operators seek diesel-free backup that qualifies for renewable energy credits.
Defense and residential segments stay below 5% due to niche specifications and high installed costs. The UK Ministry of Defence’s GBP 45 million order for portable generators underscores defense interest, but volume remains modest compared with public-transit and utility procurements inside the European fuel cell market.
Geography Analysis
Germany Fuel Cell Market
Germany controlled 28.7% of the European fuel cell market in 2025, supported by 110 operational hydrogen stations, substantial federal subsidies, and IPCEI gigafactory investments. Market momentum continues as Daimler Truck secures 5,000 fuel-cell systems from Cellcentric for delivery during 2027-2028, indicating a transition from pilots to serial production. However, grid congestion in Bavaria and Baden-Württemberg delays renewable-powered electrolysers, signaling potential supply bottlenecks.
France Fuel Cell Market
France is expanding at a 40.7% CAGR, the fastest regional trajectory. Nuclear-derived electricity allows hydrogen production at EUR 3.00-3.50 per kilogram, undercutting German wind-based supplies. The Marseille-Fos industrial cluster is evolving into a Mediterranean ammonia import and cracking hub, drawing TotalEnergies and Air Liquide investment worth EUR 1.2 billion. Paris aims to deploy 700 fuel-cell buses ahead of the 2028 Olympic Games, cementing public-transit leadership.
United Kingdom Fuel Cell Market
The United Kingdom invested GBP 200 million in hydrogen rail to replace diesel on the TransPennine and Tyne Valley lines, alongside 38 fuel-cell buses in Aberdeen, Manchester, and London. While post-Brexit regulatory divergence slows EU funding access, domestic subsidies and offshore wind capacity bolster local hydrogen economics.
Broader European Markets
Italy and Spain grow at a 32-35% CAGR from smaller bases, leveraging EU cohesion funds to build hydrogen corridors in southern regions. Nordic countries collectively hold a 9-11% share, benefiting from high renewable-penetration grids and in-region OEMs such as PowerCell Sweden and Nel. The Netherlands maintains a 7-8% share by integrating port logistics with on-site electrolysers at Rotterdam. Eastern European uptake is slower due to limited refueling infrastructure, but the EU Just Transition Mechanism grants drive pilot bus projects in Poland and the Czech Republic.
Regulatory Landscape
EU policy continues to standardize hydrogen as a traded energy carrier while tightening infrastructure and emissions compliance for fuel cell end uses. Directive (EU) 2024/1788 set common rules for hydrogen market organization and cross-border trade, aligning network access, unbundling principles, and market design across member states. In mobility, Regulation (EU) 2023/1804 (AFIR) establishes hydrogen refueling station requirements from 2030, and Commission Delegated Regulation (EU) 2025/656 (applicable from January 8, 2026) links heavy-duty hydrogen refueling point compliance to EN 17127:2024, raising harmonized technical requirements for station developers and fleet operators.
On the implementation side, the European Commission created the Hydrogen Mechanism in July 2026 under the framework of the hydrogen market rules to support market development and coordination. Public support remains a core instrument, with hydrogen-related IPCEIs (Hy2Tech, Hy2Use, Hy2Infra, Hy2Move) enabling state-aid exemptions across the value chain. Heavy-duty vehicle CO2 standards (45% reduction from 2030, 65% from 2035, 90% from 2040) also keep regulatory pressure on truck and bus OEMs to commercialize zero-emission powertrains. Alongside decarbonization policies and renewable fuel requirements, these measures increase compliance clarity for refueling hardware, hydrogen supply qualification, and fleet procurement programs that directly affect fuel cell adoption in Europe.
Competitive Landscape
The top five vendors controlled 35% of 2025 revenue, confirming a moderately fragmented European fuel cell market. Ballard, Plug Power, and Cummins dominate PEMFC stacks for heavy-duty vehicles, leveraging North American scale. Bosch-Volvo’s cellcentric and PowerCell Sweden secure European localization, satisfying content requirements under IPCEI. Ceres Power, Bloom Energy, and Doosan Fuel Cell lead SOFC deployments for stationary power, where high-temperature operation and fuel flexibility earn premium margins.
Regional specialists: Symbio, Nedstack, ElringKlinger, and Intelligent Energy win municipal fleet contracts by offering local service networks and integrated systems. Chinese entrants Weichai Power and Sinosynergy entered in 2024-2025 with 30-40% lower-priced stacks, capturing Eastern European orders but facing scrutiny under the EU Foreign Subsidies Regulation. Patent filings for PGM-free catalysts rose 180% between 2023-2025, indicating industry focus on material cost reduction.
Strategic alliances proliferate: ITM Power integrates electrolysers with Plug Power dispensers, Alstom partners with Siemens Energy on rail traction, and Toyota supplies modules to European truck OEMs under white-label agreements. Utilities increasingly sign 10-15-year service contracts that shift performance risk onto manufacturers, favoring vendors with mature maintenance networks.
Europe Fuel Cell Industry Leaders
Ballard Power Systems
Ceres Power Holdings plc
Plug Power Inc.
Topsoe (Haldor Topsoe A/S)
Cummins Inc. (Hydrogenics)
- *Disclaimer: Major Players sorted in no particular order
Europe Fuel Cell Market Companies Covered in this Report
- Ballard Power Systems
- Plug Power
- Cummins Inc.
- Topsoe
- Ceres Power
- PowerCell Sweden
- Bosch (cellcentric)
- ElringKlinger / EKPO
- Symbio
- Intelligent Energy
- Nedstack
- SFC Energy
- AFC Energy
- Bloom Energy
- Doosan Fuel Cell
- ITM Power
- Proton Motor Fuel Cell
- Nuvera Fuel Cells
- Alstom
- Siemens Energy
- Toyota Motor Europe

Market Opportunities and Future Outlook
A near-term opportunity for fuel cell suppliers sits at the intersection of binding infrastructure rules and targeted public funding for hydrogen corridors. AFIR creates a clear compliance pathway for heavy-duty hydrogen refueling points, reinforced by the January 2026 applicability of Delegated Regulation (EU) 2025/656 referencing EN 17127:2024, while the Alternative Fuels Infrastructure Facility (AFIF) earmarks EUR 570 million for 2025-2026 to support hydrogen refueling infrastructure. This combination supports whitespace in regions with sparse 700-bar truck coverage (notably parts of Eastern Europe, Iberia, and Southern Italy), where fleets have delayed orders due to routing constraints. It also rewards vendors that can package dispensers, compression, and service contracts to de-risk uptime for logistics operators.
Industrial and port-based distributed power also provides a scaling pathway, particularly where grid-connection delays constrain electrification timelines. Evidence of this shift includes high-power hydrogen generation being deployed for port construction and cargo operations, such as hydrogen generator deployment at the Port of Valencia tied to terminal expansion activity, plus refinery-linked hydrogen build-outs that pull through on-site equipment and long-term service models. EU financing tools such as the European Hydrogen Bank auctions, with awards exceeding EUR 1 billion across nine projects between December 2025 and February 2026, help narrow the operating-cost gap for renewable hydrogen and can accelerate multi-megawatt demand nodes that fuel cell OEMs target for stationary power, backup power, and hard-to-electrify transport applications. On the technology side, growing interest in on-site SOFC/SOEC systems for industrial users and data-center-like loads, together with durability-focused heavy-duty platforms (truck, bus, and rail), expands addressable use cases beyond early demonstration fleets and improves bankability for OEMs with validated field performance and maintenance networks.
Recent Industry Developments in Europe Fuel Cell Market
- June 2026: Plug Power completed commissioning and handover of a 5 MW GenEco PEM electrolyzer system at European Energys Made Power-to-X facility in Esbjerg, Denmark. Bringing a multi-megawatt PtX asset into operation strengthens local hydrogen supply for mobility and industrial offtakers and increases pull-through for downstream fuel cell deployments that depend on reliable hydrogen availability.
- May 2026: Solaris Bus and Coach selected Ballards FCmove-SC fuel cell engine to power its next-generation Generation 2 hydrogen bus platform. The designation supports higher-volume standardization of fuel cell powertrains in European public transit fleets, improving serviceability and parts commonality across operators and cities.
- March 2026: Ceres Power and Centrica announced a strategic partnership to accelerate deployment of solid oxide fuel cell and solid oxide electrolysis solutions for on-site power across the UK and Europe. Pairing Ceres technology with Centricas energy-services footprint advances commercial delivery models for distributed, low-emission power in industrial and commercial settings where grid constraints and resiliency requirements are driving procurement.


Europe Fuel Cell Market Report Scope and Research Methodology
Market Definition and Coverage
For this study, the Europe fuel cell market covers revenue generated from fuel cell systems used in transportation, stationary power, and portable power across European countries, reported in USD for the study period.
Scope exclusions: We exclude upstream hydrogen production and distribution, and we also exclude batteries and non-fuel-cell power electronics that are sold separately.
Segments Covered in This Report
- By Technology
- Polymer Electrolyte Membrane Fuel Cell (PEMFC)
- Solid Oxide Fuel Cell (SOFC)
- Alkaline Fuel Cell (AFC)
- Others [Phosphoric Acid Fuel Cell (PAFC), Molten Carbonate Fuel Cell (MCFC), Direct Methanol Fuel Cell (DMFC)]
- By Fuel Type
- Hydrogen
- Natural Gas/Methane
- Ammonia
- Others (Methanol, Biogas)
- By Application
- Vehicular (Passenger Cars, Buses & Coaches, Trucks, Material Handling Equipment, Rail, Marine Vessels)
- Non-Vehicular (Stationary Power, Portable Power, Micro-Combined Heat & Power)
- By End-User Industry
- Transportation
- Utilities
- Commercial and Industrial
- Others (Defense, Residential)
- By Geography
- Germany
- France
- United Kingdom
- Italy
- Spain
- NORDIC Countries
- Netherlands
- Russia
- Rest of Europe
Data Sources, Market Sizing, and Validation
Desk Research
Desk research was used to set the market boundaries and to collect the most repeatable demand signals we could track across Europe. For fuel cells, this typically means public energy and transport statistics and policy trackers that show where deployments are actually happening.
We referred to sources such as Eurostat energy and industrial data, European Commission hydrogen and clean mobility publications, the European Patent Office for fuel cell related filings, and the International Energy Agency updates on hydrogen and fuel cell deployment. These were supported with company annual reports, investor presentations, association websites, and reputable press coverage for announced projects and capacity plans. Where financial and trade information was hard to reconcile across countries, we also used paid database subscriptions for company financials and intelligence, shipment level import and export signals, and patent lookups to pressure test our assumptions. The sources named here are not exhaustive, and many other public and internal references were also used for data collection, validation, and clarification.
Primary Interviews and Surveys
Primary interviews and surveys were run with a mix of fuel cell ecosystem participants, such as system suppliers, component makers, project developers, integrators, and end users across transport fleets and stationary power buyers. We used these discussions to confirm what is being installed versus what is only announced, and to align pricing logic (stack versus system level) with current contract and procurement behavior across Europe.
Distribution of primary research fieldwork respondents
| Company type | Respondent position |
|---|---|
| Top tier: 30% | CXOs: 13% |
| Mid tier: 53% | Functional/Unit leaders: 32% |
| Smaller Players: 17% | Managers: 55% |
Market-Sizing & Forecasting
Sizing starts with a top-down build where regional deployment signals and policy driven adoption are converted into value, and then adjusted country by country to reflect the active project pipeline and actual commissioning pace. Once that backbone is set, we corroborate it with selective bottom-up checks, such as sampling typical system pricing and matching it against known volumes in mobility fleets, stationary installations, and portable shipments.
The model is driven by a few market fingerprints that can be tracked and explained easily. Key inputs include stack and system average selling price movements (which differ by technology and power range), installed capacity additions and project announcements that later get filtered for delays, mobility rollouts for buses and trucks, stationary backup and micro-CHP adoption, and the fuel mix trend (hydrogen versus natural gas or ammonia based systems) that affects configuration and value. When a local data point is missing, we fill the gap using nearby-country analogs and then bring it back in line through interview based reality checks.
For forecasting, scenario analysis is used, with an agreed base case shaped by expected policy execution, hydrogen infrastructure buildout timing, and the pace of OEM and fleet procurement. The scenarios are then reviewed against expert expectations so the final path stays practical and not overly optimistic.
Data Validation & Update Cycle
Validation is done through triangulation across independent signals, and then reviewed in more than one analyst pass before sign-off. We check for large variances by country, technology, and application, and we re-check any sharp year-to-year jumps against project timing, pricing assumptions, and documented deployments.
Reports are refreshed annually, and interim updates are made when a material event changes the demand picture, such as a large tender award, policy revision, or visible pricing shift. Before delivery, a fresh review is completed so the numbers reflect the latest public releases and the most recent interview feedback.
Mordor Intelligence's Europe Fuel Cell Market Market Size Compared With Other Published Estimates
It is normal to see different market sizes for the same topic because the scope boundaries and the timing choices behind the model are not identical. Differences show up quickly in fuel cells since deployments can be lumpy, pricing is moving, and some sources mix early-stage announcements with installed reality.
A practical gap driver is refresh cadence and currency timing, because older FX rates and older price points can make a fast-growing market look smaller or larger than it is, and Mordor Intelligence ties pricing updates to recent deal and shipment signals before finalizing the year value.
Benchmark comparison
| Source | Market Size | Gaps in Research Methodology |
|---|---|---|
| Mordor Intelligence | USD 3.86 B (2026) | |
| Industry Publisher A | USD 2.01 B (2025) | Uses a different base year and a slower adoption curve, and the value framing leans more on broad type and application splits without clear adjustment for delayed European project commissioning. |
| Regional Consultancy B | USD 2.80 B (2026) | Shows a lower 2026 value that appears sensitive to how system ASP is defined (stack-level versus full system), and the coverage list is wider, which can dilute country-level validation of what is actually installed. |
The comparison mainly shows that year selection, FX timing, and the chosen pricing unit can move the total meaningfully for this market. By keeping scope tight to fuel cell systems sold into defined applications, and by checking price and deployment assumptions against current Europe signals, the estimate stays transparent and repeatable for planning.


Key Questions Answered in the Report
How fast is the Europe fuel cell market expected to grow through 2031?
The market is projected to expand from USD 3.86 billion in 2026 to USD 17.25 billion by 2031 at a 34.91% CAGR.
Which technology segment is growing the quickest?
Solid Oxide Fuel Cells lead growth with a 47.5% CAGR, owing to high combined heat-and-power efficiency and fuel flexibility.
Why is ammonia attracting attention as a fuel?
Ammonia enables cracking-free storage and transport, driving a 51.1% CAGR as shipping lines and island grids seek high-density, zero-carbon fuels.
What is the main barrier to wider adoption of fuel-cell trucks?
High platinum-based catalyst costs keep vehicle purchase prices 60-80% above diesel equivalents before subsidies.
Which country will likely outpace Germany in growth?
France is set to grow at a 40.7% CAGR through 2031, leveraging nuclear-based hydrogen and large public-transit procurements.
Are new EU chemical rules a threat to PEM fuel cells?
Yes, proposed PFAS restrictions could force membrane redesigns by 2028, potentially shifting investment toward SOFC platforms.
Page last updated on:


 Your data is secure and never sold or shared.


