
Europe Fleet Management Market Size and Share
Market Overview
| Study Period | 2020 - 2031 |
|---|---|
| Forecast Data Period | 2026 - 2031 |
| Base Year Market Size (2025) | USD 8.06 Billion |
| Market Size (2026) | USD 9.01 Billion |
| Market Size (2031) | USD 15.72 Billion |
| Growth Rate (2026 - 2031) | 11.78 % |
| Market Concentration | Medium |
Major Players *Disclaimer: Major Players sorted in no particular order Image © Mordor Intelligence. Reuse requires attribution under CC BY 4.0. | |
Europe Fleet Management Market Analysis by Mordor Intelligence
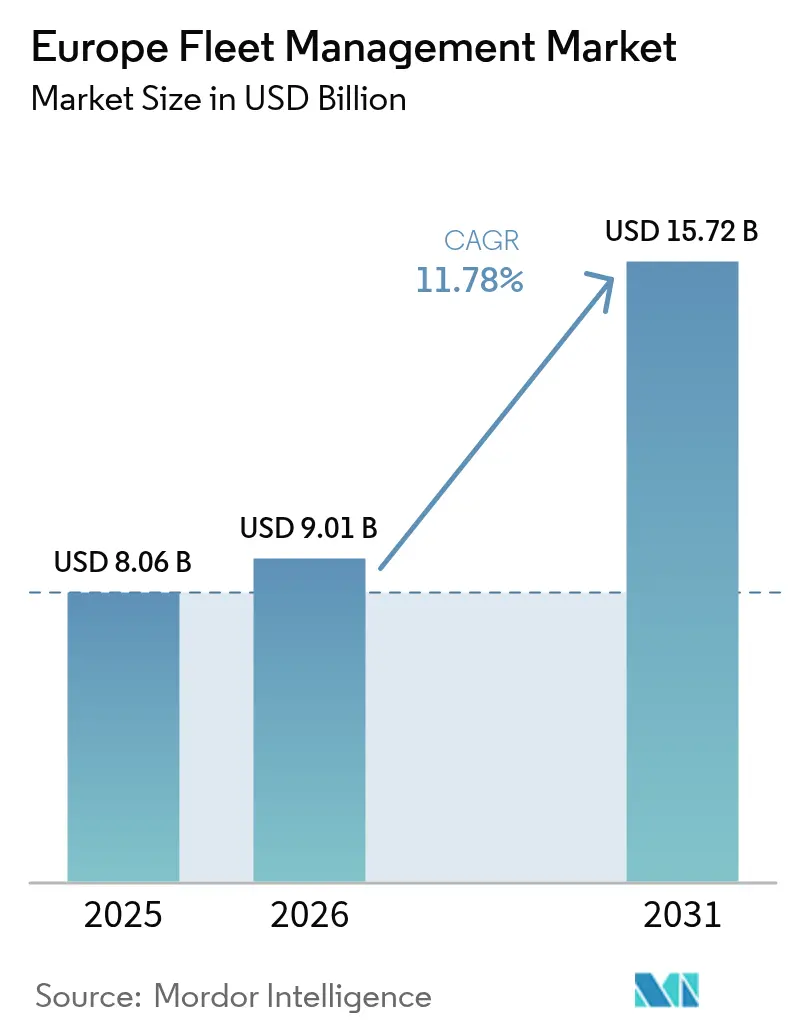
The Europe fleet management market size was valued at USD 8.06 billion in 2025 and estimated to grow from USD 9.01 billion in 2026 to reach USD 15.72 billion by 2031, at a CAGR of 11.78% during the forecast period (2026-2031). Rising regulatory pressure, the spread of connected-vehicle architectures, and intensifying last-mile logistics are together expanding addressable demand. The EU smart-tachograph Phase II rule that starts in 2025 compels real-time data transmission, turning telematics from an optional efficiency tool into a compliance requirement.[1] E-commerce volume growth elevates urban delivery mileage, pushing operators toward granular route optimization and driver behaviour analytics. At the same time, falling cellular-IoT tariffs and eSIM adoption lower connectivity costs while 5G coverage enables high-bandwidth applications such as AI video safety monitoring.[2] OEMs are opening application programming interfaces to monetize in-vehicle data streams, giving fleets a direct path to embedded telematics. Finally, national carbon-reduction targets and low-emission zones speed up electrification, which requires tighter energy and asset coordination.
Key Report Takeaways
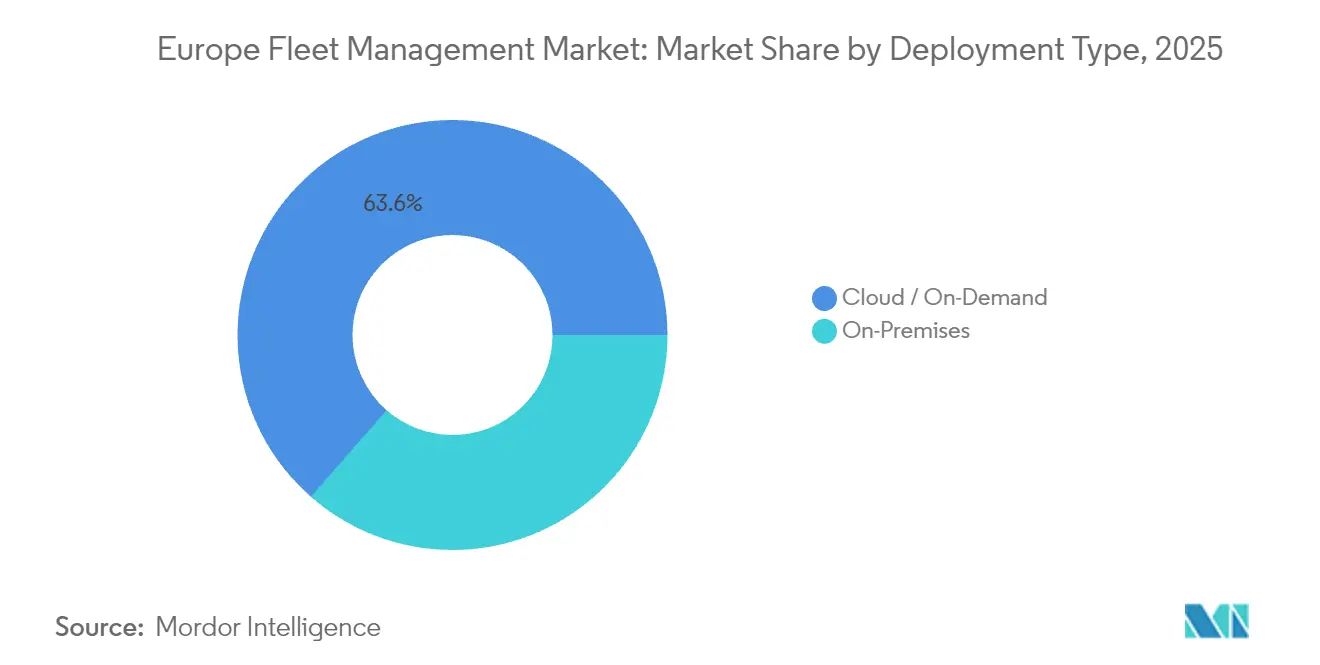
- By deployment type, cloud captured 63.55% of the European fleet management market share in 2025, while cloud solutions are expanding at a 14.56% CAGR through 2031.
- By application, safety and compliance management is advancing at a 14.34% CAGR to 2031, whereas asset management held 26.72% of the European fleet management market size in 2025.
- By end-user vertical, transportation and logistics led with 32.18% revenue share in 2025; energy and utilities are projected to grow at 13.21% CAGR between 2026 and 2031.
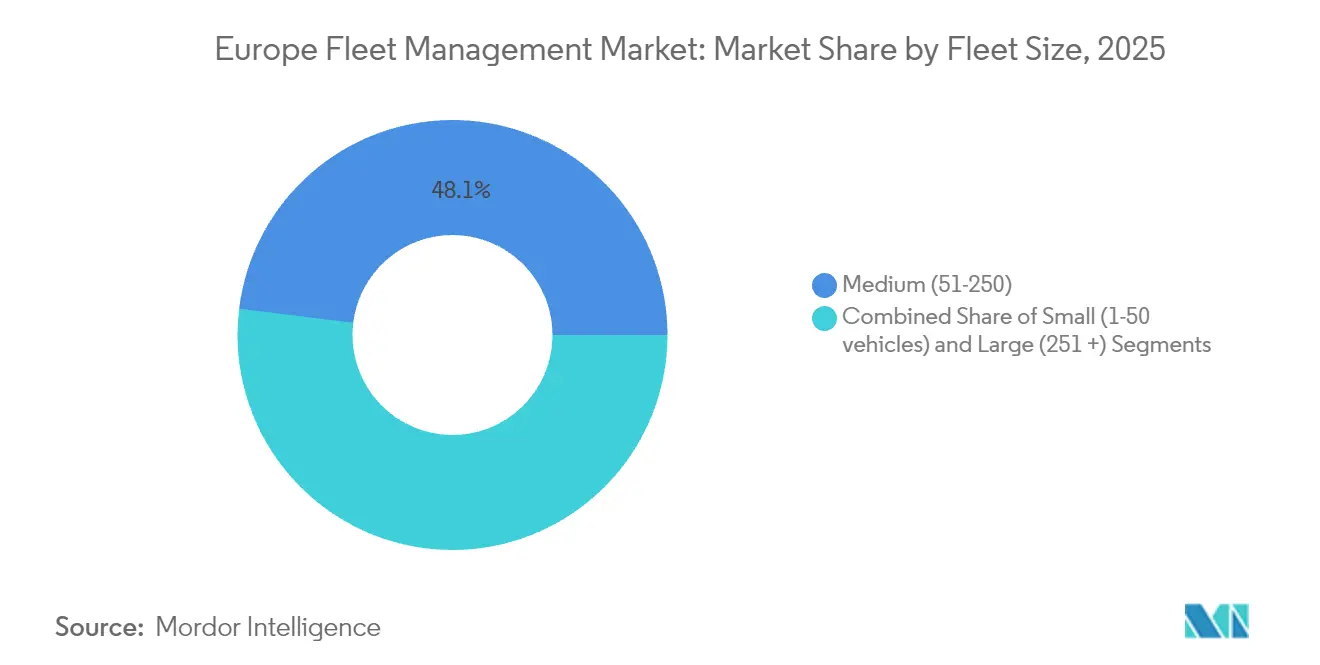
- By fleet size, medium fleets accounted for 48.05% of the European fleet management market size in 2025; large fleets are growing fastest at 12.63% CAGR.
- By vehicle type, light commercial vehicles held 54.02% of the European fleet management market share in 2025, whereas bus and coach fleets are accelerating at a 14.62% CAGR.
- By geography, Germany commanded 24.05% of Europe's fleet management market share in 2025, while Spain is set to post the highest CAGR at 14.88% through 2031.
Note: Market size and forecast figures in this report are generated using Mordor Intelligence’s proprietary estimation framework, updated with the latest available data and insights as of 2026.
Worldwide, activity is shaped by contributions from multiple regions, with Europe representing one of the more structurally developed among them. The global report on fleet management market by Mordor Intelligence reflects how these regional layers combine into a single system.
Europe Fleet Management Market Trends and Insights
Drivers Impact Analysis*
| Driver | (~) % Impact on CAGR Forecast | Geographic Relevance | Impact Timeline |
|---|---|---|---|
| EU smart-tachograph Phase II mandate (2025) | 2.10% | EU-wide, strongest in Germany, France, Italy | Short term (≤ 2 years) |
| E-commerce-driven LCV mileage surge | +1.80% | Western Europe core, expanding to CEE | Medium term (2-4 years) |
| Falling cellular-IoT tariffs and eSIM adoption | +1.40% | Global, with early gains in Nordic countries | Medium term (2-4 years) |
| OEM open-API telematics monetisation | +1.20% | Germany, UK, France automotive hubs | Long term (≥ 4 years) |
| EU ETS-2 credits for low-CO₂ fleets | +0.90% | EU-wide, implementation from 2027 | Long term (≥ 4 years) |
| 5G C-V2X micro-platooning pilots | +0.70% | Germany, Netherlands, Sweden test corridors | Long term (≥ 4 years) |
| Source: Mordor Intelligence | |||
EU Smart-Tachograph Phase II Mandate Creates Compliance Imperative
The mandate enforced from June 2025 forces every commercial vehicle above 3.5 t to transmit location and driver-hours data continuously, replacing periodic data downloads with real-time oversight. Automatic fines structured between EUR 1,500 and EUR 15,000 leave operators’ little choice but to install integrated telematics suites. Large German logistics firms have already completed rollouts to avoid service disruption, and suppliers report that small fleets now request multi-vehicle subscriptions rather than standalone tachographs. Because operators prefer a single pane of glass across all classes of vehicles, demand is spilling into light vans and company-car pools, lifting total platform adoption.
E-Commerce Growth Intensifies Last-Mile Delivery Optimization
Online retail penetration climbed to 13.4% of European sales in 2024, and last-mile costs swallow 41% of logistics spend for parcel operators. Light vans now cover 23% more mileage than in 2024 as consumers expect next-day delivery. Operators such as Seur cut route-related costs by 15% after introducing AI-based scheduling, demonstrating tangible return on telematics. Low-emission zones in Barcelona, Madrid, and Paris add further complexity by restricting time-window access, making real-time regulatory data essential. The Europe fleet management market, therefore benefits from converging e-commerce and environmental pressures that require constant location, traffic, and compliance feeds.
Cellular-IoT Cost Reductions Enable Mass-Market Adoption
European data-only SIM prices fell 34% between 2024 and 2025, while eSIM modules simplify cross-border roaming and remote re-provisioning. Nordic fleets lead with 78% IoT penetration and report per-unit savings of EUR 45 when switching to embedded SIMs. As operators integrate 5G, live HD video, advanced driver assistance, and over-the-air diagnostics become economically viable for fleets of every size. Connectivity resilience also improves because firmware updates occur without physical service visits, shrinking downtime for high-utilization assets.
OEM Telematics Platforms Monetize Connected Vehicle Data
Manufacturers are translating connected-vehicle sensors into recurring revenue. Volkswagen Commercial Vehicles gathered EUR 127 million in 2024 from Connect Pro subscriptions that deliver utilization dashboards and maintenance alerts.[3] Mercedes-Benz Trucks reports a 28% drop in unscheduled repairs after embedding predictive analytics. Open-API programs invite third-party developers to add niche functions, improving customer stickiness and driving a long-run shift in fleet procurement decisions away from hardware toward services.
Restraints Impact Analysis*
| Restraint | (~) % Impact on CAGR Forecast | Geographic Relevance | Impact Timeline |
|---|---|---|---|
| GDPR and ePrivacy compliance burden | -1.60% | EU-wide, strongest enforcement in Germany, France | Short term (≤ 2 years) |
| High cap-ex for AI video telematics | -1.30% | Western Europe, limited SME adoption | Medium term (2-4 years) |
| Patchwork low-emission city zones | -0.80% | Major metropolitan areas across EU | Medium term (2-4 years) |
| Telematics-chip supply disruptions | -0.70% | Global supply chain, EU manufacturing impact | Short term (≤ 2 years) |
| Source: Mordor Intelligence | |||
GDPR Compliance Creates Implementation Complexity
Under GDPR, employee consent for GPS tracking must be explicit and revocable, and several German court cases in 2024 confirmed that blanket monitoring infringes worker rights. For medium fleets, annual spending on legal review, data-protection officers, and software redesign totals about EUR 125,000. Multinational operators must sometimes deactivate features such as driver-cam streaming when crossing borders with stricter rules, diluting the efficiency promise of telematics and extending deployment timelines.
AI Video Telematics Capital Requirements Limit SME Adoption
Full driver-safety camera stacks cost more than USD 500 per vehicle once hardware, installation, and cloud storage are counted. Return on investment can stretch to 24 months for fleets under 50 vehicles, twice the payback enjoyed by large operators that negotiate bulk pricing and absorb downtime more easily. The result is a two-tier technology landscape: enterprise fleets move quickly into machine-vision analytics, while smaller players stay with basic GPS devices, slowing overall penetration within the Europe fleet management market.
*Our forecasts treat driver/restraint impacts as directional, not additive. The impact forecasts reflect baseline growth, mix effects, and variable interactions.
Segment Analysis
By Deployment Type: Cloud Dominance Accelerates
Cloud services captured 63.55% of Europe fleet management market share in 2025 and are climbing at a 14.56% CAGR through 2031, propelled by pay-as-you-go pricing and automatic software updates. Deutsche Telekom observes that a multi-tenant architecture trims total cost of ownership by 34% relative to on-premises hosting because operators avoid server procurement and maintenance obligations. For fleet managers, elastic data storage accommodates seasonal volume swings without manual scaling. Data-sovereignty concerns confined some critical infrastructure fleets to private servers, yet cloud providers have responded with EU-based data centers that carry GDPR certification, closing the compliance gap.
Edge computing now operates as an extension of the cloud model rather than a replacement. Time-sensitive driver-assistance calculations run on in-vehicle processors, while aggregate analysis, reporting, and over-the-air updates flow through centralized hubs. This hybrid approach satisfies both latency and governance requirements, cementing cloud as the default architecture for new deployments within the Europe fleet management market.

By Application: Safety Compliance Drives Growth
Asset management held 26.72% of Europe fleet management market size in 2025 because every operator values location and utilization data. Safety and compliance tools, however, are advancing at a 14.34% CAGR because regulators and insurers tie monetary incentives to incident prevention. Allianz provides up to 15% premium discounts when fleets demonstrate proactive driver monitoring, accelerating adoption among high-mileage courier services. The EU Vision Zero program, which aims for zero road fatalities by 2050, positions AI-enabled fatigue detection and blind-spot alerts as pre-requisites for operating licenses in several member states. Vendors now bundle safety dashboards with tachograph files, ensuring compliance submissions are seamless and verifiable.
By End-User Vertical: Energy Utilities Emerge as Growth Driver
Transportation and logistics still account for 32.18% of Europe fleet management market share, yet utilities outpace every other sector at 13.21% CAGR as grid entities integrate electric vans and service trucks. E. ON coordinates charging schedules with substation load curves, preventing overload while maintaining field maintenance availability. Construction firms gain theft-mitigation and regulatory reporting, while manufacturers embed telematics in just-in-time logistics for higher production uptime. Minor verticals such as municipal services leverage the same platforms but require added modules for waste collection routes or emergency dispatch.
By Fleet Size: Large Fleets Drive Technology Adoption
Medium fleets supplied 48.05% of revenue in 2025 because their complexity justifies telematics without overwhelming management bandwidth. Large fleets surpass 251 vehicles and are growing fastest at 12.63% CAGR, as scale economics amplify fuel and maintenance savings. DHL reported EUR 45 million in annual savings after rolling telematics across 75,000 European vehicles, equal to a 7-month payback period. Small fleets gravitate toward smartphone-based tracking that uses existing hardware, creating an entry point that converts into premium modules once enterprise functionality is needed.
By Vehicle Type: Bus Electrification Accelerates Telematics Adoption
Light commercial vehicles delivered 54.02% of Europe fleet management market size in 2025 owing to omnipresent parcel delivery demand. The bus and coach segment posts the highest CAGR at 14.62% as city authorities fund zero-emission public transport. Solaris equips every electric bus with battery-health telemetry and charging-slot scheduling, maximizing duty cycles despite limited depot capacity. Heavy trucks concentrate on fuel cost reduction through predictive gearshift coaching and aerodynamic route selection, while specialist vehicles ambulances, cherry pickers, refuse trucks require integrations with onboard mission equipment.
Geography Analysis
Germany holds 24.05% of Europe fleet management market share because its industrial base, dense logistics corridors, and strong compliance culture foster early adoption. The Autobahn digital upgrade enables continuous 5G coverage, giving domestic suppliers such as Bosch and Continental an ideal testbed for edge-enabled driver-assistance prototypes. Major carriers like Deutsche Post DHL and DB Schenker operate multi-brand telematics architectures that serve as proof points for small subcontractors that share freight assignments.
Spain is the fastest-growing national market at 14.88% CAGR through 2031. Government incentives under Plan Moves III subsidize electric van purchases and require telematics for mileage reporting, instantly linking energy policy with fleet-software demand. Spain’s role as Europe’s gateway to North Africa also means fleets shuttle across customs unions, favouring platforms with multilingual interfaces and seamless roaming that eSIM promises.
France, the United Kingdom, and Italy represent mature segments where basic tracking is near saturation. Growth therefore pivots to advanced analytics, carbon-accounting dashboards, and autonomous-driving trial support. In Central and Eastern Europe, accession-driven infrastructure grants spur highway expansion, making connected-truck corridors viable and opening a fresh customer base for pan-European providers able to deliver local language support.
Regulatory Landscape
EU-wide road-transport digitization rules continue to tighten, with the smart-tachograph Phase II requirement taking effect from June 2025 and pushing fleets toward always-on, auditable telematics for driver-hours and cross-border compliance. In parallel, the Intelligent Transport Systems framework under Directive (EU) 2023/2661 sets interoperability and data-availability obligations across the transport ecosystem, and the European Commission escalated enforcement in July 2026 by issuing reasoned opinions to 10 Member States for missing the transposition deadline of 21 December 2025.
Decarbonization rules are also increasingly shaping fleet software requirements. The European Commission tabled COM(2025)994 in December 2025 (Clean Corporate Vehicles) to set national targets for zero- and low-emission shares in large corporate fleets, which increases demand for fleet-level emissions, utilization, and charging analytics. For heavy-duty operators, Regulation (EU) 2026/1046 (adopted in April 2026) amended the EU CO2 standards framework for trucks by adjusting how emission credits are calculated for reporting periods 2025-2029, reinforcing the need for reliable vehicle-data capture and reporting workflows.
Competitive Landscape
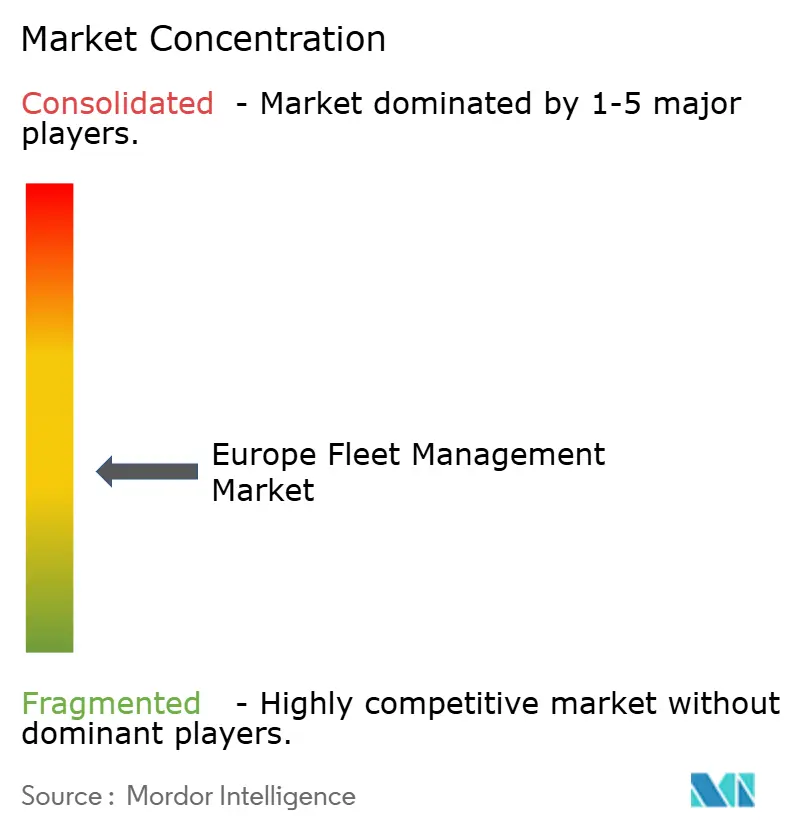
The Europe fleet management market remains moderately fragmented. Traditional leaders such as TomTom and Verizon Connect rely on hardware ecosystems and deep channel partnerships, yet challenger platforms emphasize intuitive, mobile-first design and AI analytics. Telematics is becoming increasingly software-defined; therefore, intellectual-property filings are rising for cloud-native routing engines and vehicle-to-everything protocols, with more than 1,400 related European Patent Office applications logged in 2024.
OEM-supplier alliances intensify competitive overlap. Volkswagen, Daimler Truck, and Stellantis now embed factory telematics, shortening decision cycles for fleets that no longer need aftermarket hardware. Meanwhile, Vodafone Business and MiX Telematics launched 5G service bundles that include SIM, hardware, and analytics under one invoice, reducing procurement complexity for operators targeting real-time dash-cam streaming. Specialist regional vendors differentiate through vertical templates for emergency services or construction, giving them defensible niches even as global brands scale.
The pandemic-era chip shortage exposed vulnerability in single-supplier device manufacturing. To hedge, providers are diversifying reference designs and adopting software abstraction layers that decouple device firmware from analytics stacks. Those strategic moves, along with mergers such as Verizon Connect’s acquisition of Fleet Complete and Trimble’s purchase of PTV, signal a gradual consolidation yet leave the combined share of the top five suppliers below 40%, preserving customer leverage in contract negotiations.
Europe Fleet Management Industry Leaders
-
MiX Telematics Limited
-
Inseego Corp.
-
ABAX AS
-
Geotab Inc.
-
Verizon Connect Inc.
- *Disclaimer: Major Players sorted in no particular order
Market Opportunities and Future Outlook
OEM-embedded connectivity and data rights are widening the serviceable market for software-first fleet platforms. The EU Data Act (Regulation (EU) 2023/2854) took effect for market opening on data portability from September 2025, giving fleet owners a legal basis to access connected-vehicle operational data and appoint third-party recipients. This supports integrations that pull data from factory-fitted modems into independent fleet-management applications.
Whitespace is also emerging in connected operations beyond vehicles, where fleets want a single pane of glass for tools, trailers, and other assets alongside vehicles. ABAX introduced ABAX Smart Connect in April 2026 to integrate manufacturer-connected tools (including Hilti and STIHL) into its platform. Geotab expanded its footprint and integration capacity after surpassing 1 million active fleet subscriptions across EMEA in May 2026. Competitive pressure is building around AI video safety and analytics at scale, including Netradyne acquiring Germany-founded Moove Connected Mobility in May 2026 to use it as a regional hub for Europe.
Recent Industry Developments
- June 2026: Geotab acquired Link Labs to add IoT asset-tracking capabilities that cover indoor and outdoor equipment alongside vehicles. This widens Geotab's focus from vehicle telematics toward broader operational visibility for fleets that track tools, trailers, and high-value assets under one platform.
- October 2025: Geotab acquired the commercial operations of Verizon Connect in multiple countries including the UK, Ireland, France, Germany, Italy, the Netherlands, Poland, and Portugal. This expanded Geotab's go-to-market coverage in Europe and added more installed-base relationships that can be migrated to broader software modules.
- December 2024: Geotab opened a USD 45 million data center in Frankfurt to strengthen GDPR-aligned data handling and reduce latency for European customers. The localized infrastructure supports more compute-intensive use cases, including richer analytics and faster reporting for compliance and safety workflows.
Research Methodology Framework and Report Scope
Market Definition and Coverage
We define the Europe fleet management market as revenues earned from software, hardware, and connectivity used to monitor, manage, and optimize fleet operations, including tracking, diagnostics, maintenance planning, driver and safety management, and compliance reporting across European countries.
Scope exclusions: We exclude stand-alone vehicle leasing and insurance products when they are not bundled or priced as a fleet management solution.
Segmentation Overview
- By Deployment Type
- On-Demand (Cloud)
- On-Premises
- By Application
- Asset Management
- Information Management
- Driver Management
- Safety and Compliance Management
- Risk Management
- Operations Management
- By End-user Vertical
- Transportation and Logistics
- Energy and Utilities
- Construction
- Manufacturing
- Other End-Users Verticals
- By Fleet Size
- Small (1-50 vehicles)
- Medium (51-250)
- Large (251 +)
- By Vehicle Type
- Light Commercial Vehicles
- Heavy Commercial Vehicles
- Bus and Coach
- By Geography (Country)
- Germany
- United Kingdom
- France
- Spain
- Italy
- Rest of Europe
Data Sources, Market Sizing, and Validation
Desk Research
Desk research started with public data that anchors the fleet pool and operating context in Europe, then matched that to how fleet management solutions are deployed and paid for. We relied on sources such as Eurostat for transport activity indicators, the European Commission for mobility and road safety policy signals, and the European Automobile Manufacturers Association for vehicle parc and registrations context.
To keep inputs grounded, we also reviewed publications and datasets from national transport ministries and road agencies, along with selected peer-reviewed papers on telematics adoption and fleet safety outcomes. Company annual reports, investor presentations, and trusted press coverage were reviewed to understand pricing logic, typical contract structures, and where functions are treated as fleet management versus adjacent services. Where needed, a paid subscription that compiles company financials and a shipment-level import and export database were referenced to cross-check supplier exposure and hardware flow patterns. The desk research sources mentioned above are illustrative and not exhaustive, and many other references were also used for data collection, clarification, and validation.
Primary Interviews and Surveys
Primary work was used to pressure-test pricing, attach rates, and what buyers actually include under a fleet management budget line, where desk sources often stay silent. We spoke with a mix of solution providers, connectivity partners, fleet operators, and channel participants across major European markets, and we also collected views from teams responsible for operations, safety and compliance, and procurement so the assumptions reflect real buying behavior.
Distribution of primary research fieldwork respondents
| Company type | Respondent position |
|---|---|
| Top tier: 30% | CXOs: 13% |
| Mid tier: 56% | Functional/Unit leaders: 42% |
| Smaller Players: 14% | Managers: 45% |
Market-Sizing & Forecasting
The core model uses a top-down build that reconstructs demand from the addressable fleet pool, solution penetration, and typical annual spend per managed vehicle, then splits that spend across key use cases such as safety and compliance or operations management. Where the data was uneven by country, we used a practical gap-handling approach that links smaller markets to nearby peers using vehicle parc mix, commercial activity, and connectivity readiness as the main variables.
To keep results realistic, selective bottom-up checks were run using sampled price ranges for software subscriptions, telematics hardware bundles, and connectivity add-ons. These were then compared against supplier revenue footprints and channel feedback to adjust totals. Inputs that mattered most included commercial vehicle parc trends, connected vehicle adoption signals, smart tachograph compliance timing, mobile network coverage and cost direction, and the share of fleets using cloud deployment versus on-premise setups. Forecasts were produced using scenario analysis, with baseline adoption and pricing paths confirmed in interviews and then stress-tested for changes in regulation intensity, fuel and maintenance cost pressure, and EV fleet expansion.
Data Validation & Update Cycle
We validate outputs by triangulating model totals against independent signals such as per-vehicle spend ranges, supplier revenue disclosures, and country-level fleet and transport indicators, and then investigating major variances before sign-off. Outliers are handled through consistency checks on penetration, pricing, and country mix, so one assumption does not silently drive the whole result, and analysts re-contact sources when a key input falls outside the expected range.
The report is refreshed annually, and interim updates are made when material events shift adoption or pricing expectations, such as new compliance deadlines or major connectivity cost changes. Before delivery, a final review pass is completed so clients receive an updated view that matches the latest public releases and primary feedback.
Mordor Intelligence's Europe Fleet Management Market Size Versus Other Published Estimates
Different published market sizes for Europe fleet management can vary even when they sound similar, since authors may count different revenue lines and also choose different time points for currency conversion and pricing. We reviewed the main drivers of divergence so buyers can understand what is in scope and what is not.
The biggest gap often comes from whether telematics hardware and connectivity charges are counted alongside fleet software, and whether on-premise deployments are treated the same as cloud subscriptions, which can inflate or shrink the total depending on the assumed mix. Some studies also treat vehicle financing and leasing related services as part of fleet management by default, while others keep these as separate line items, and refresh cadence can further change the view when mobile data pricing or compliance-driven adoption moves quickly.
Benchmark comparison
| Source | Market Size | Gaps in Research Methodology |
|---|---|---|
| Mordor Intelligence | USD 8.06 B (2025) | |
| Trade Journal A | USD 6.90 B (2025) | Often narrows the scope to recurring software subscriptions and excludes most hardware and connectivity pass-through revenues, which reduces the total in markets with high telematics bundle penetration. |
| Regional Consultancy B | USD 10.40 B (2025) | Commonly folds in adjacent fleet services like leasing administration or broader mobility management spend, and may apply a higher per-vehicle spend assumption across small fleets. |
The spread in estimates is largely explained by what gets counted as a fleet management revenue line and how per-vehicle spend is applied across different fleet sizes and countries. The main gap comes from including or excluding bundled telematics hardware and recurring connectivity. Mordor Intelligence counts these revenues only when they are packaged and invoiced as part of a fleet management solution, and then cross-checks that through deployment mix and buyer validation.
Key Questions Answered in the Report
What is the current value of the Europe fleet management market?
The market is valued at USD 9.01 billion in 2026 and is projected to reach USD 15.72 billion by 2031.
Which deployment model dominates fleet management in Europe?
Cloud deployment leads with 63.55% share in 2025 and continues to expand at a 14.56% CAGR.
Which application segment is growing fastest?
Safety and compliance management is advancing at 14.34% CAGR through 2031, driven by regulatory and insurance incentives.
Why is Spain the fastest-growing national market?
EU funding for logistics modernization and incentives for low-emission fleets propel Spain´s 14.88% CAGR outlook.
How do GDPR rules affect telematics adoption?
GDPR requires explicit driver consent and privacy-by-design systems, adding an average EUR 125,000 annual compliance cost for medium fleets.
What technology trend is reshaping OEM strategies?
Automakers are opening APIs and packaging telematics as subscriptions, generating recurring revenue and expanding data-driven services.