| Study Period | 2017 - 2030 |
| Base Year For Estimation | 2024 |
| Forecast Data Period | 2025 - 2030 |
| Market Size (2025) | USD 2.17 Billion |
| Market Size (2030) | USD 2.71 Billion |
| CAGR (2025 - 2030) | 4.53 % |
| Market Concentration | Medium |
Major Players*Disclaimer: Major Players sorted in no particular order |

Europe Feed Amino Acids Market Analysis
The Europe Feed Amino Acids Market size is estimated at 2.17 billion USD in 2025, and is expected to reach 2.71 billion USD by 2030, growing at a CAGR of 4.53% during the forecast period (2025-2030).
The European feed amino acids industry has witnessed significant transformation driven by shifting consumer preferences towards high-quality animal protein products and sustainable farming practices. The integration of essential amino acids in animal feed has become increasingly crucial, evidenced by their substantial 24.9% share of the European feed additives market in 2022. This shift reflects growing awareness among farmers about the importance of optimal animal nutrition in livestock production. The industry has also seen increased adoption of precision feeding techniques, allowing farmers to optimize amino acid supplementation based on specific animal requirements and growth stages.
Technological advancements in feed formulation and production processes have revolutionized the industry landscape. Manufacturers are investing in research and development to enhance the bioavailability and efficiency of synthetic amino acids products. Advanced encapsulation technologies are being employed to protect amino acids from degradation during feed processing and ensure better absorption in animals. These innovations have led to the development of new product variants with improved stability and effectiveness, contributing to better feed conversion ratios and reduced environmental impact.
The market has experienced significant structural changes in response to evolving environmental regulations and sustainability requirements. Feed manufacturers are increasingly focusing on developing eco-friendly production processes and reducing nitrogen emissions through optimized amino acid supplementation. The industry has also witnessed a surge in partnerships between feed manufacturers and research institutions to develop novel fermented amino acids formulations that address specific nutritional challenges while maintaining environmental compliance. These collaborations have resulted in more efficient feed solutions that optimize resource utilization while maintaining animal performance.
The sector has demonstrated remarkable resilience and adaptability to changing market dynamics, particularly in feed production methodologies. The industry has maintained steady growth despite various challenges, with overall feed production increasing by 1.9% through 2022. This growth has been accompanied by significant investments in production capacity expansion and modernization of existing facilities. The market has also seen increased emphasis on quality control measures and traceability systems, ensuring consistent product quality and safety standards across the supply chain. These developments have strengthened the industry's foundation and positioned it for sustained growth in the coming years.
Europe Feed Amino Acids Market Trends
Europe is 3rd largest exporter of poultry meat and broiler meat production accounted for 82.6% of poultry meat production which is expected to drive the demand for poultry production
- Europe was a major producer and exporter of poultry meat globally, with an estimated annual production of approximately 13.4 million metric tons in 2021. Despite being the second most consumed meat in the region, with a consumption rate of 26.9 kg per capita per year, poultry production in Europe has not kept pace with rising global demand. Poland is the largest producer of poultry meat in the region, accounting for 19.2% of production or 2.5 million metric tons, followed by France (12.5%), Spain (12.3%), Germany (12%), and Italy (10.4%).
- Broiler meat production constituted the majority (82.6%) of total poultry meat production in the European Union in 2021, followed by duck meat at 3.3%. Europe's poultry flock numbered approximately 2.45 billion birds in 2021, with Russia, France, the Netherlands, Ukraine, Poland, and the United Kingdom collectively comprising more than 50% of the population. The laying hen segment is experiencing growth across Europe due to increased egg consumption, which rose from 5,864 metric tons in 2017 to 6,135 thousand metric tons in 2021.
- Europe is the fourth-largest importer and the third-largest exporter of poultry meat globally. In 2021, the European Union exported roughly 2,252 thousand metric tons (carcass weight) of poultry meat to various countries, including the United Kingdom, Ghana, and Ukraine. Overall, the increasing production of poultry birds, rising demand for poultry products, and growing consumption of eggs are expected to be key drivers of market growth in the European region.

Understand The Key Trends Shaping This Market
Download PDF
High demand for fish feed which accounted for 82% and surge in seafood imports had a negative impact on compound feed for aquaculture
- In 2022, Europe held a significant share of 8.0% in global aquaculture compound feed production, with a production volume of 4.5 million metric tons. The compounded feed production witnessed a notable increase of 15% between 2018 and 2022, driven by the growing demand for nutrient-balanced feed to reduce the risk of disease and improve feed efficiency. However, aquaculture feed production observed a decline of 21.2% in 2018, which may have been influenced by the surge in seafood imports and the relatively low prices of imported seafood, impacting the compound feed market in 2018.
- The major aqua feed producers in the European region are Turkey, the United Kingdom, the Netherlands, Spain, Italy, and France. The region produced 17.4 million metric tons of aquaculture species in 2021, indicating a growth of 1.7% since 2018. The growth is attributed to the rise in population and per capita consumption of seafood, which is driving aquaculture production in the region. This, in turn, is propelling the demand for compound feed, which is expected to increase by 18.2% during the forecast period (2023-2029).
- Fish feed dominates aqua feed production, accounting for an 82% share in 2022, followed by shrimp feed and other aquatic species feed, with a share of 4.3% and 13.7%, respectively, in the region. Fish food is the most consumed aquatic food across the region, and it is highly produced compared to other aquatic species. The expanding aquaculture sector, driven by the rising demand for seafood and aquaculture products and the growing awareness regarding quality meat, are the major factors augmenting the growth of the market studied.

OTHER KEY INDUSTRY TRENDS COVERED IN THE REPORT
- Europe's diary sector is witnessing growth and beef meat is the third largest meat consumed in the region which is contributing to the growth of ruminants population
- Avian influenza outbreak and Russia- Ukraine war had negative impact on feed production but growth in poultry population has increased the demand for poultry feed
- African swine fever (ASF) epidemic in the eastern EU countries and high cost of grains had a negative impact during 2020-2021 and increasing swine population will increase the demand for producing swine feed
- Spain's pig population was 24.3% of the Europe's pig population and government support in Hungary for rearing is further helping in increasing the demand for swine
- Government funding and lower financial risks are helping in increasing the production of ruminants feed but animal welfare policies and increasing utility costs are restrains for region
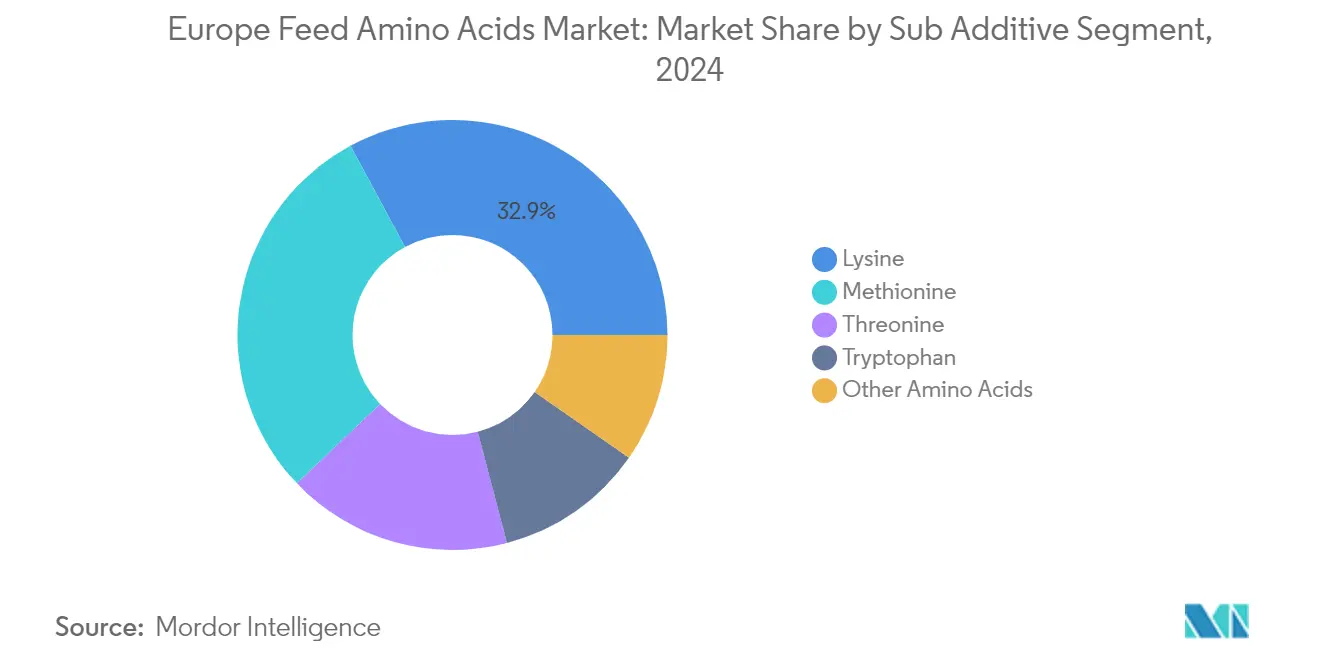
Segment Analysis: Sub Additive
Lysine Segment in Europe Feed Amino Acids Market
Lysine dominates the European feed amino acids market, holding approximately 33% of the market share in 2024. This significant market position is primarily attributed to its crucial role in animal growth and development, particularly in meat production. Lysine's effectiveness in improving feed efficiency and breast meat yield in broiler chickens has made it indispensable in the poultry segment, which accounts for about 35% of total lysine consumption. The amino acid's importance in bone formation and its role in producing carnitine, a nutrient responsible for converting fatty acids into energy, has further cemented its position as the leading feed additive in Europe. Germany, Spain, and Russia are the primary consumers of lysine in the region, with Germany alone accounting for nearly 18% of the lysine market, driven by high meat consumption and advanced animal farming practices.
Methionine Segment in Europe Feed Amino Acids Market
Methionine is emerging as the fastest-growing segment in the European animal feed amino acids market, projected to grow at approximately 5% during 2024-2029. This growth trajectory is driven by methionine's critical role in regulating metabolic processes, improving the innate immune system, and enhancing digestive functioning in animals. The segment's expansion is particularly notable in the poultry industry, where methionine plays a vital role in the development of the digestive tract, growth performance, increasing muscle mass, and improving egg production. The swine segment is also contributing significantly to methionine's growth, as the amino acid helps improve gut health and overall animal performance. The increasing adoption of advanced feed technologies and growing awareness about the benefits of methionine in animal nutrition are further propelling its market growth across Europe.
Remaining Segments in Sub Additive Market
The European animal feed amino acids market is further segmented into Threonine, Tryptophan, and other amino acids, each playing distinct roles in animal nutrition. Threonine has established itself as a crucial component in protein synthesis and nutritional metabolism, particularly important in poultry and swine diets. Tryptophan, while having a smaller market share, is gaining importance due to its role in protein synthesis and as a precursor to serotonin, which helps regulate stress responses in animals. Other amino acids, including valine, histidine, and phenylalanine, collectively contribute to the market by supporting various aspects of animal health, reproduction, and lactation, making them essential components in modern animal nutrition strategies.
Segment Analysis: Animal
Poultry Segment in Europe Feed Amino Acids Market
The poultry segment dominates the European feed amino acids market, accounting for approximately 35% of the total market value in 2024. This significant market share is primarily driven by the high demand for poultry meat and eggs across the region. Among poultry types, broilers constitute the largest sub-segment, representing about 56% of the total poultry amino acids market, followed by layers and other poultry birds. The segment's dominance is further strengthened by the extensive use of lysine and methionine, which together account for over 62% of amino acids used in poultry feed. Russia, France, and the United Kingdom are the leading countries in Europe's feed amino acids market for poultry, with Russia holding the largest share at 17%.
Swine Segment in Europe Feed Amino Acids Market
The swine segment is emerging as the fastest-growing segment in the European feed amino acids market, projected to grow at approximately 5% CAGR during 2024-2029. This growth is primarily attributed to the increasing demand for functional variants of swine feed that enhance immunity and prevent infections. The segment's growth is particularly strong in countries like Spain, Germany, and France, which collectively account for over 50% of the region's swine population. The rising awareness among pig farmers about the importance of maintaining a healthy pig diet through essential amino acids supplementation is driving the adoption of compound feeds. Additionally, the segment's growth is supported by the essential role of amino acids in normal nutritional, physiological, and immunological functions in pigs.
Remaining Segments in Animal Segmentation
The remaining segments in the European feed amino acids market include ruminants and aquaculture, each playing distinct roles in the market dynamics. The ruminants segment, encompassing dairy cattle, beef cattle, and other ruminants, is particularly significant in countries with strong dairy industries. The segment benefits from the increasing focus on milk production efficiency and meat quality. The aquaculture segment, though smaller in market share, is gaining importance due to the growing fish farming industry in Europe, particularly in countries like Norway and the United Kingdom. Both segments are characterized by specific amino acid requirements, with methionine and lysine being crucial for optimal growth and development of these animals.
Europe Feed Amino Acids Market Geography Segment Analysis
Feed Amino Acids Market in Spain
Spain has established itself as the dominant force in Europe's feed amino acids market, commanding approximately 16% of the total market value in 2024. The country's leadership position is primarily driven by its robust swine sector, which accounts for over half of the feed amino acids consumption. The Spanish market benefits from an advanced feed production infrastructure, with facilities producing over 31.8 million metric tons of feed annually. The country's strategic focus on amino acid-inclusive products has been particularly evident in the swine segment, where increasing demand for pork products has fueled market growth. Spanish manufacturers have shown a particular preference for lysine and methionine, which together represent nearly 60% of the country's amino acid consumption. The market's strength is further reinforced by the country's significant investment in research and development, focusing on feed efficiency and animal nutrition optimization. Spain's position is also bolstered by its strong export capabilities and well-established distribution networks across Europe.
Feed Amino Acids Market in United Kingdom
The United Kingdom has emerged as the most dynamic market in Europe's feed amino acids sector, projected to grow at approximately 5% CAGR from 2024 to 2029. The country's remarkable growth trajectory is underpinned by its strong focus on poultry production, which represents the largest segment of its feed amino acids market. British manufacturers have been particularly innovative in developing specialized animal nutrition ingredients that cater to specific animal nutrition requirements. The market has benefited from increased awareness among farmers about the benefits of amino acid supplementation in animal feed, particularly in improving feed conversion rates and animal health outcomes. The UK's commitment to sustainable farming practices has also driven the adoption of advanced amino acid solutions that help reduce nitrogen emissions from livestock operations. The country's robust research infrastructure and collaboration between industry and academic institutions have fostered continuous innovation in feed amino acids technologies. Additionally, the UK's strict regulatory framework has helped maintain high-quality standards, building trust among both domestic and international customers.
Feed Amino Acids Market in France
France maintains a strong position in Europe's feed amino acids market, driven by its well-established livestock sector and advanced feed production capabilities. The French market is characterized by its sophisticated approach to animal nutrition, with particular emphasis on dairy cattle and poultry segments. The country's success is built on its strong research and development infrastructure, which has enabled the development of innovative amino acid formulations tailored to specific animal needs. French manufacturers have shown particular expertise in developing specialized amino acid blends that optimize animal growth and health outcomes. The market benefits from strong collaboration between feed manufacturers, research institutions, and livestock producers, creating an ecosystem that promotes innovation and efficiency. French producers have also demonstrated leadership in sustainable farming practices, incorporating amino acid supplementation strategies that reduce environmental impact while maintaining high productivity levels. The country's strong agricultural heritage and commitment to quality have helped maintain its position as a key player in the European feed amino acids market.
Feed Amino Acids Market in Germany
Germany's feed amino acids market is characterized by its strong technological foundation and emphasis on efficiency in livestock production. The country's market is distinguished by its high level of automation and precision in feed formulation, particularly in the swine and poultry sectors. German manufacturers have developed sophisticated approaches to amino acid supplementation, focusing on optimal protein utilization and reduced environmental impact. The market benefits from strong integration between feed producers and livestock farmers, enabling rapid adoption of new amino acid technologies and formulations. German companies have been particularly successful in developing specialized amino acid products that address specific nutritional requirements across different growth stages of animals. The country's strong focus on research and development has led to continuous improvements in amino acid efficacy and application methods. Additionally, Germany's stringent quality control standards and commitment to sustainable production methods have helped maintain its position as a key player in the European market.
Feed Amino Acids Market in Other Countries
The remaining European countries, including Italy, the Netherlands, Russia, and Turkey, collectively represent a significant portion of the feed amino acids market, each contributing unique strengths to the regional landscape. These markets are characterized by varying levels of technological advancement and different focus areas in terms of livestock production. The Italian market shows particular strength in poultry and swine sectors, while the Netherlands demonstrates expertise in dairy cattle nutrition. Russia's market is marked by the rapid modernization of its feed production facilities, while Turkey shows growing sophistication in its approach to animal nutrition. These countries exhibit diverse patterns of amino acid utilization, reflecting their specific livestock production priorities and local market conditions. The development of these markets is supported by increasing awareness of the benefits of amino acid supplementation in animal feed, coupled with growing demand for high-quality animal products. Their continued evolution is shaped by factors such as technological adoption, regulatory frameworks, and changing consumer preferences.
Get Analysis on Important Geographic Markets
Download PDF
Europe Feed Amino Acids Industry Overview
Top Companies in Europe Feed Amino Acids Market
The European feed amino acids market is characterized by companies focusing on strategic product innovations and operational expansions to maintain their competitive edge. Major players are investing significantly in research and development to introduce novel animal nutrition formulations that enhance animal performance. Companies are establishing partnerships and collaborations to strengthen their distribution networks and expand their geographical presence across Europe. Manufacturing capacity expansions, particularly in key markets like Germany, France, and Spain, demonstrate the industry's commitment to meeting growing demand. The emphasis on developing sustainable and cost-effective production methods, coupled with investments in digital solutions for customer service, reflects the industry's evolution towards more sophisticated operational models. Strategic acquisitions and mergers have become increasingly common as companies seek to consolidate their market positions and expand their product portfolios.
Consolidated Market Led By Global Players
The European feed amino acids market exhibits a consolidated structure dominated by large multinational corporations with diverse product portfolios and extensive manufacturing capabilities. These major players leverage their strong research capabilities, established distribution networks, and economies of scale to maintain their market positions. The market is characterized by the presence of both specialized amino acid manufacturers and diversified chemical companies that have integrated feed additives into their broader product offerings. Regional players maintain their relevance through specialized product offerings and strong local relationships, though their market share remains relatively limited compared to global leaders.
The industry has witnessed significant consolidation through strategic acquisitions and partnerships, particularly among leading players seeking to strengthen their market presence and expand their technological capabilities. Companies are increasingly focusing on vertical integration to ensure supply chain stability and cost optimization. The competitive landscape is further shaped by the presence of Asian manufacturers who have established production facilities in Europe to serve the local market more effectively. Market entry barriers remain high due to substantial capital requirements, stringent regulatory compliance needs, and the importance of established customer relationships in the industry.
Innovation and Sustainability Drive Future Success
Success in the European feed amino acids market increasingly depends on companies' ability to develop innovative products while maintaining cost competitiveness. Market leaders are investing in advanced production technologies and sustainable manufacturing processes to meet growing environmental concerns and regulatory requirements. The ability to provide comprehensive animal nutrition ingredients solutions, rather than standalone products, is becoming crucial for maintaining market share. Companies are also focusing on developing digital platforms and technical support services to enhance customer engagement and provide value-added solutions. Building strong relationships with key stakeholders, including feed manufacturers and livestock producers, remains essential for market success.
For new entrants and smaller players, success lies in identifying and serving niche market segments with specialized products and superior customer service. Companies need to focus on developing sustainable production methods and obtaining relevant certifications to meet increasing regulatory requirements and consumer preferences for environmentally friendly products. Investment in research and development capabilities, particularly in areas such as fermentation technology and biotechnology, is crucial for long-term success. The ability to establish strategic partnerships with local distributors and key customers, while maintaining operational flexibility to respond to market changes, will be critical for gaining market share. Companies must also consider potential regulatory changes regarding animal welfare and environmental protection in their long-term strategies.
Europe Feed Amino Acids Market Leaders
-
Adisseo
-
Archer Daniel Midland Co.
-
Evonik Industries AG
-
IFF(Danisco Animal Nutrition)
-
SHV (Nutreco NV)
- *Disclaimer: Major Players sorted in no particular order

Need More Details on Market Players and Competiters?
Download PDF
Europe Feed Amino Acids Market News
- October 2022: The partnership between Evonik and BASF allowed Evonik certain non-exclusive licensing rights to OpteinicsTM, a digital solution to improve comprehension and reduce the environmental impact of the animal protein and feed industries.
- February 2021: IFF collaborated with DuPont’s Nutrition & Biosciences and continues to operate under IFF. The deal values the combined company at USD 45.4 billion on an enterprise value basis. The definitive agreement for the merger will create leading ingredients and solutions for customers worldwide.
- November 2020: Adisseo acquired Framelco Group, a Dutch feed additive company. This allowed the company to provide value-added, innovative livestock and aqua specialty products.
Free With This Report
We provide a complimentary and exhaustive set of data points on regional and country-level metrics that present the fundamental structure of the industry. Presented in the form of 35+ free charts, the section covers difficult-to-find data of various regions on feed production through various animal categories such as Ruminants, Poultry, Swine, and Aquaculture.


Europe Feed Amino Acids Market Report - Table of Contents
1. EXECUTIVE SUMMARY & KEY FINDINGS
2. REPORT OFFERS
3. INTRODUCTION
- 3.1 Study Assumptions & Market Definition
- 3.2 Scope of the Study
- 3.3 Research Methodology
4. KEY INDUSTRY TRENDS
-
4.1 Animal Headcount
- 4.1.1 Poultry
- 4.1.2 Ruminants
- 4.1.3 Swine
-
4.2 Feed Production
- 4.2.1 Aquaculture
- 4.2.2 Poultry
- 4.2.3 Ruminants
- 4.2.4 Swine
-
4.3 Regulatory Framework
- 4.3.1 France
- 4.3.2 Germany
- 4.3.3 Italy
- 4.3.4 Netherlands
- 4.3.5 Russia
- 4.3.6 Spain
- 4.3.7 Turkey
- 4.3.8 United Kingdom
- 4.4 Value Chain & Distribution Channel Analysis
5. MARKET SEGMENTATION (includes market size in Value in USD and Volume, Forecasts up to 2030 and analysis of growth prospects)
-
5.1 Sub Additive
- 5.1.1 Lysine
- 5.1.2 Methionine
- 5.1.3 Threonine
- 5.1.4 Tryptophan
- 5.1.5 Other Amino Acids
-
5.2 Animal
- 5.2.1 Aquaculture
- 5.2.1.1 By Sub Animal
- 5.2.1.1.1 Fish
- 5.2.1.1.2 Shrimp
- 5.2.1.1.3 Other Aquaculture Species
- 5.2.2 Poultry
- 5.2.2.1 By Sub Animal
- 5.2.2.1.1 Broiler
- 5.2.2.1.2 Layer
- 5.2.2.1.3 Other Poultry Birds
- 5.2.3 Ruminants
- 5.2.3.1 By Sub Animal
- 5.2.3.1.1 Beef Cattle
- 5.2.3.1.2 Dairy Cattle
- 5.2.3.1.3 Other Ruminants
- 5.2.4 Swine
- 5.2.5 Other Animals
-
5.3 Country
- 5.3.1 France
- 5.3.2 Germany
- 5.3.3 Italy
- 5.3.4 Netherlands
- 5.3.5 Russia
- 5.3.6 Spain
- 5.3.7 Turkey
- 5.3.8 United Kingdom
- 5.3.9 Rest of Europe
6. COMPETITIVE LANDSCAPE
- 6.1 Key Strategic Moves
- 6.2 Market Share Analysis
- 6.3 Company Landscape
-
6.4 Company Profiles (includes Global Level Overview, Market Level Overview, Core Business Segments, Financials, Headcount, Key Information, Market Rank, Market Share, Products and Services, and Analysis of Recent Developments).
- 6.4.1 Adisseo
- 6.4.2 Ajinomoto Co., Inc.
- 6.4.3 Alltech, Inc.
- 6.4.4 Archer Daniel Midland Co.
- 6.4.5 Dangschat T.O.H. GmbH & Co. KG
- 6.4.6 Evonik Industries AG
- 6.4.7 IFF(Danisco Animal Nutrition)
- 6.4.8 Kemin Industries
- 6.4.9 Lonza Group Ltd.
- 6.4.10 SHV (Nutreco NV)
7. KEY STRATEGIC QUESTIONS FOR FEED ADDITIVE CEOS
8. APPENDIX
-
8.1 Global Overview
- 8.1.1 Overview
- 8.1.2 Porter’s Five Forces Framework
- 8.1.3 Global Value Chain Analysis
- 8.1.4 Global Market Size and DROs
- 8.2 Sources & References
- 8.3 List of Tables & Figures
- 8.4 Primary Insights
- 8.5 Data Pack
- 8.6 Glossary of Terms
You Can Purchase Parts Of This Report. Check Out Prices For Specific Sections
Get Price Break-up Now
List of Tables & Figures
- Figure 1:
- POPULATION OF POULTRY, NUMBER, EUROPE, 2017-2022
- Figure 2:
- POPULATION OF RUMINANTS, NUMBER, EUROPE, 2017-2022
- Figure 3:
- POPULATION OF SWINE, NUMBER, EUROPE, 2017-2022
- Figure 4:
- PRODUCTION VOLUME OF AQUACULTURE FEED, METRIC TON, EUROPE, 2017-2022
- Figure 5:
- PRODUCTION VOLUME OF POULTRY FEED, METRIC TON, EUROPE, 2017-2022
- Figure 6:
- PRODUCTION VOLUME OF RUMINANTS FEED, METRIC TON, EUROPE, 2017-2022
- Figure 7:
- PRODUCTION VOLUME OF SWINE FEED, METRIC TON, EUROPE, 2017-2022
- Figure 8:
- VOLUME OF FEED AMINO ACIDS, METRIC TON, EUROPE, 2017 - 2029
- Figure 9:
- VALUE OF FEED AMINO ACIDS, USD, EUROPE, 2017 - 2029
- Figure 10:
- VOLUME OF FEED AMINO ACIDS BY SUB ADDITIVE CATEGORIES, METRIC TON, EUROPE, 2017 - 2029
- Figure 11:
- VALUE OF FEED AMINO ACIDS BY SUB ADDITIVE CATEGORIES, USD, EUROPE, 2017 - 2029
- Figure 12:
- VOLUME SHARE OF FEED AMINO ACIDS BY SUB ADDITIVE CATEGORIES, %, EUROPE, 2017,2023 AND 2029
- Figure 13:
- VALUE SHARE OF FEED AMINO ACIDS BY SUB ADDITIVE CATEGORIES, %, EUROPE, 2017,2023 AND 2029
- Figure 14:
- VOLUME OF LYSINE FEED AMINO ACIDS, METRIC TON, EUROPE, 2017 - 2029
- Figure 15:
- VALUE OF LYSINE FEED AMINO ACIDS, USD, EUROPE, 2017 - 2029
- Figure 16:
- VALUE SHARE OF LYSINE FEED AMINO ACIDS BY ANIMAL TYPE, %, EUROPE, 2022 AND 2029
- Figure 17:
- VOLUME OF METHIONINE FEED AMINO ACIDS, METRIC TON, EUROPE, 2017 - 2029
- Figure 18:
- VALUE OF METHIONINE FEED AMINO ACIDS, USD, EUROPE, 2017 - 2029
- Figure 19:
- VALUE SHARE OF METHIONINE FEED AMINO ACIDS BY ANIMAL TYPE, %, EUROPE, 2022 AND 2029
- Figure 20:
- VOLUME OF THREONINE FEED AMINO ACIDS, METRIC TON, EUROPE, 2017 - 2029
- Figure 21:
- VALUE OF THREONINE FEED AMINO ACIDS, USD, EUROPE, 2017 - 2029
- Figure 22:
- VALUE SHARE OF THREONINE FEED AMINO ACIDS BY ANIMAL TYPE, %, EUROPE, 2022 AND 2029
- Figure 23:
- VOLUME OF TRYPTOPHAN FEED AMINO ACIDS, METRIC TON, EUROPE, 2017 - 2029
- Figure 24:
- VALUE OF TRYPTOPHAN FEED AMINO ACIDS, USD, EUROPE, 2017 - 2029
- Figure 25:
- VALUE SHARE OF TRYPTOPHAN FEED AMINO ACIDS BY ANIMAL TYPE, %, EUROPE, 2022 AND 2029
- Figure 26:
- VOLUME OF OTHER AMINO ACIDS FEED AMINO ACIDS, METRIC TON, EUROPE, 2017 - 2029
- Figure 27:
- VALUE OF OTHER AMINO ACIDS FEED AMINO ACIDS, USD, EUROPE, 2017 - 2029
- Figure 28:
- VALUE SHARE OF OTHER AMINO ACIDS FEED AMINO ACIDS BY ANIMAL TYPE, %, EUROPE, 2022 AND 2029
- Figure 29:
- VOLUME OF FEED AMINO ACIDS BY ANIMAL TYPE, METRIC TON, EUROPE, 2017 - 2029
- Figure 30:
- VALUE OF FEED AMINO ACIDS BY ANIMAL TYPE, USD, EUROPE, 2017 - 2029
- Figure 31:
- VOLUME SHARE OF FEED AMINO ACIDS BY ANIMAL TYPE, %, EUROPE, 2017,2023 AND 2029
- Figure 32:
- VALUE SHARE OF FEED AMINO ACIDS BY ANIMAL TYPE, %, EUROPE, 2017,2023 AND 2029
- Figure 33:
- VOLUME OF AQUACULTURE FEED AMINO ACIDS BY SUB ANIMAL TYPE, METRIC TON, EUROPE, 2017 - 2029
- Figure 34:
- VALUE OF AQUACULTURE FEED AMINO ACIDS BY SUB ANIMAL TYPE, USD, EUROPE, 2017 - 2029
- Figure 35:
- VOLUME SHARE OF AQUACULTURE FEED AMINO ACIDS BY SUB ANIMAL TYPE, %, EUROPE, 2017,2023 AND 2029
- Figure 36:
- VALUE SHARE OF AQUACULTURE FEED AMINO ACIDS BY SUB ANIMAL TYPE, %, EUROPE, 2017,2023 AND 2029
- Figure 37:
- VOLUME OF FISH FEED AMINO ACIDS, METRIC TON, EUROPE, 2017 - 2029
- Figure 38:
- VALUE OF FISH FEED AMINO ACIDS, USD, EUROPE, 2017 - 2029
- Figure 39:
- VALUE SHARE OF FISH FEED AMINO ACIDS BY SUB ADDITIVE CATEGORIES, %, EUROPE, 2022 AND 2029
- Figure 40:
- VOLUME OF SHRIMP FEED AMINO ACIDS, METRIC TON, EUROPE, 2017 - 2029
- Figure 41:
- VALUE OF SHRIMP FEED AMINO ACIDS, USD, EUROPE, 2017 - 2029
- Figure 42:
- VALUE SHARE OF SHRIMP FEED AMINO ACIDS BY SUB ADDITIVE CATEGORIES, %, EUROPE, 2022 AND 2029
- Figure 43:
- VOLUME OF OTHER AQUACULTURE SPECIES FEED AMINO ACIDS, METRIC TON, EUROPE, 2017 - 2029
- Figure 44:
- VALUE OF OTHER AQUACULTURE SPECIES FEED AMINO ACIDS, USD, EUROPE, 2017 - 2029
- Figure 45:
- VALUE SHARE OF OTHER AQUACULTURE SPECIES FEED AMINO ACIDS BY SUB ADDITIVE CATEGORIES, %, EUROPE, 2022 AND 2029
- Figure 46:
- VOLUME OF POULTRY FEED AMINO ACIDS BY SUB ANIMAL TYPE, METRIC TON, EUROPE, 2017 - 2029
- Figure 47:
- VALUE OF POULTRY FEED AMINO ACIDS BY SUB ANIMAL TYPE, USD, EUROPE, 2017 - 2029
- Figure 48:
- VOLUME SHARE OF POULTRY FEED AMINO ACIDS BY SUB ANIMAL TYPE, %, EUROPE, 2017,2023 AND 2029
- Figure 49:
- VALUE SHARE OF POULTRY FEED AMINO ACIDS BY SUB ANIMAL TYPE, %, EUROPE, 2017,2023 AND 2029
- Figure 50:
- VOLUME OF BROILER FEED AMINO ACIDS, METRIC TON, EUROPE, 2017 - 2029
- Figure 51:
- VALUE OF BROILER FEED AMINO ACIDS, USD, EUROPE, 2017 - 2029
- Figure 52:
- VALUE SHARE OF BROILER FEED AMINO ACIDS BY SUB ADDITIVE CATEGORIES, %, EUROPE, 2022 AND 2029
- Figure 53:
- VOLUME OF LAYER FEED AMINO ACIDS, METRIC TON, EUROPE, 2017 - 2029
- Figure 54:
- VALUE OF LAYER FEED AMINO ACIDS, USD, EUROPE, 2017 - 2029
- Figure 55:
- VALUE SHARE OF LAYER FEED AMINO ACIDS BY SUB ADDITIVE CATEGORIES, %, EUROPE, 2022 AND 2029
- Figure 56:
- VOLUME OF OTHER POULTRY BIRDS FEED AMINO ACIDS, METRIC TON, EUROPE, 2017 - 2029
- Figure 57:
- VALUE OF OTHER POULTRY BIRDS FEED AMINO ACIDS, USD, EUROPE, 2017 - 2029
- Figure 58:
- VALUE SHARE OF OTHER POULTRY BIRDS FEED AMINO ACIDS BY SUB ADDITIVE CATEGORIES, %, EUROPE, 2022 AND 2029
- Figure 59:
- VOLUME OF RUMINANTS FEED AMINO ACIDS BY SUB ANIMAL TYPE, METRIC TON, EUROPE, 2017 - 2029
- Figure 60:
- VALUE OF RUMINANTS FEED AMINO ACIDS BY SUB ANIMAL TYPE, USD, EUROPE, 2017 - 2029
- Figure 61:
- VOLUME SHARE OF RUMINANTS FEED AMINO ACIDS BY SUB ANIMAL TYPE, %, EUROPE, 2017,2023 AND 2029
- Figure 62:
- VALUE SHARE OF RUMINANTS FEED AMINO ACIDS BY SUB ANIMAL TYPE, %, EUROPE, 2017,2023 AND 2029
- Figure 63:
- VOLUME OF BEEF CATTLE FEED AMINO ACIDS, METRIC TON, EUROPE, 2017 - 2029
- Figure 64:
- VALUE OF BEEF CATTLE FEED AMINO ACIDS, USD, EUROPE, 2017 - 2029
- Figure 65:
- VALUE SHARE OF BEEF CATTLE FEED AMINO ACIDS BY SUB ADDITIVE CATEGORIES, %, EUROPE, 2022 AND 2029
- Figure 66:
- VOLUME OF DAIRY CATTLE FEED AMINO ACIDS, METRIC TON, EUROPE, 2017 - 2029
- Figure 67:
- VALUE OF DAIRY CATTLE FEED AMINO ACIDS, USD, EUROPE, 2017 - 2029
- Figure 68:
- VALUE SHARE OF DAIRY CATTLE FEED AMINO ACIDS BY SUB ADDITIVE CATEGORIES, %, EUROPE, 2022 AND 2029
- Figure 69:
- VOLUME OF OTHER RUMINANTS FEED AMINO ACIDS, METRIC TON, EUROPE, 2017 - 2029
- Figure 70:
- VALUE OF OTHER RUMINANTS FEED AMINO ACIDS, USD, EUROPE, 2017 - 2029
- Figure 71:
- VALUE SHARE OF OTHER RUMINANTS FEED AMINO ACIDS BY SUB ADDITIVE CATEGORIES, %, EUROPE, 2022 AND 2029
- Figure 72:
- VOLUME OF SWINE FEED AMINO ACIDS, METRIC TON, EUROPE, 2017 - 2029
- Figure 73:
- VALUE OF SWINE FEED AMINO ACIDS, USD, EUROPE, 2017 - 2029
- Figure 74:
- VALUE SHARE OF SWINE FEED AMINO ACIDS BY SUB ADDITIVE CATEGORIES, %, EUROPE, 2022 AND 2029
- Figure 75:
- VOLUME OF OTHER ANIMALS FEED AMINO ACIDS, METRIC TON, EUROPE, 2017 - 2029
- Figure 76:
- VALUE OF OTHER ANIMALS FEED AMINO ACIDS, USD, EUROPE, 2017 - 2029
- Figure 77:
- VALUE SHARE OF OTHER ANIMALS FEED AMINO ACIDS BY SUB ADDITIVE CATEGORIES, %, EUROPE, 2022 AND 2029
- Figure 78:
- VOLUME OF FEED AMINO ACIDS BY COUNTRY, METRIC TON, EUROPE, 2017 - 2029
- Figure 79:
- VALUE OF FEED AMINO ACIDS BY COUNTRY, USD, EUROPE, 2017 - 2029
- Figure 80:
- VOLUME SHARE OF FEED AMINO ACIDS BY COUNTRY, %, EUROPE, 2017,2023 AND 2029
- Figure 81:
- VALUE SHARE OF FEED AMINO ACIDS BY COUNTRY, %, EUROPE, 2017,2023 AND 2029
- Figure 82:
- VOLUME OF FRANCE FEED AMINO ACIDS, METRIC TON, EUROPE, 2017 - 2029
- Figure 83:
- VALUE OF FRANCE FEED AMINO ACIDS, USD, EUROPE, 2017 - 2029
- Figure 84:
- VALUE SHARE OF FRANCE FEED AMINO ACIDS BY SUB ADDITIVE CATEGORIES, %, EUROPE, 2022 AND 2029
- Figure 85:
- VOLUME OF GERMANY FEED AMINO ACIDS, METRIC TON, EUROPE, 2017 - 2029
- Figure 86:
- VALUE OF GERMANY FEED AMINO ACIDS, USD, EUROPE, 2017 - 2029
- Figure 87:
- VALUE SHARE OF GERMANY FEED AMINO ACIDS BY SUB ADDITIVE CATEGORIES, %, EUROPE, 2022 AND 2029
- Figure 88:
- VOLUME OF ITALY FEED AMINO ACIDS, METRIC TON, EUROPE, 2017 - 2029
- Figure 89:
- VALUE OF ITALY FEED AMINO ACIDS, USD, EUROPE, 2017 - 2029
- Figure 90:
- VALUE SHARE OF ITALY FEED AMINO ACIDS BY SUB ADDITIVE CATEGORIES, %, EUROPE, 2022 AND 2029
- Figure 91:
- VOLUME OF NETHERLANDS FEED AMINO ACIDS, METRIC TON, EUROPE, 2017 - 2029
- Figure 92:
- VALUE OF NETHERLANDS FEED AMINO ACIDS, USD, EUROPE, 2017 - 2029
- Figure 93:
- VALUE SHARE OF NETHERLANDS FEED AMINO ACIDS BY SUB ADDITIVE CATEGORIES, %, EUROPE, 2022 AND 2029
- Figure 94:
- VOLUME OF RUSSIA FEED AMINO ACIDS, METRIC TON, EUROPE, 2017 - 2029
- Figure 95:
- VALUE OF RUSSIA FEED AMINO ACIDS, USD, EUROPE, 2017 - 2029
- Figure 96:
- VALUE SHARE OF RUSSIA FEED AMINO ACIDS BY SUB ADDITIVE CATEGORIES, %, EUROPE, 2022 AND 2029
- Figure 97:
- VOLUME OF SPAIN FEED AMINO ACIDS, METRIC TON, EUROPE, 2017 - 2029
- Figure 98:
- VALUE OF SPAIN FEED AMINO ACIDS, USD, EUROPE, 2017 - 2029
- Figure 99:
- VALUE SHARE OF SPAIN FEED AMINO ACIDS BY SUB ADDITIVE CATEGORIES, %, EUROPE, 2022 AND 2029
- Figure 100:
- VOLUME OF TURKEY FEED AMINO ACIDS, METRIC TON, EUROPE, 2017 - 2029
- Figure 101:
- VALUE OF TURKEY FEED AMINO ACIDS, USD, EUROPE, 2017 - 2029
- Figure 102:
- VALUE SHARE OF TURKEY FEED AMINO ACIDS BY SUB ADDITIVE CATEGORIES, %, EUROPE, 2022 AND 2029
- Figure 103:
- VOLUME OF UNITED KINGDOM FEED AMINO ACIDS, METRIC TON, EUROPE, 2017 - 2029
- Figure 104:
- VALUE OF UNITED KINGDOM FEED AMINO ACIDS, USD, EUROPE, 2017 - 2029
- Figure 105:
- VALUE SHARE OF UNITED KINGDOM FEED AMINO ACIDS BY SUB ADDITIVE CATEGORIES, %, EUROPE, 2022 AND 2029
- Figure 106:
- VOLUME OF REST OF EUROPE FEED AMINO ACIDS, METRIC TON, EUROPE, 2017 - 2029
- Figure 107:
- VALUE OF REST OF EUROPE FEED AMINO ACIDS, USD, EUROPE, 2017 - 2029
- Figure 108:
- VALUE SHARE OF REST OF EUROPE FEED AMINO ACIDS BY SUB ADDITIVE CATEGORIES, %, EUROPE, 2022 AND 2029
- Figure 109:
- MOST ACTIVE COMPANIES BY NUMBER OF STRATEGIC MOVES, COUNT, EUROPE, 2017 - 2023
- Figure 110:
- MOST ADOPTED STRATEGIES, COUNT, EUROPE, 2017 - 2023
- Figure 111:
- VALUE SHARE OF MAJOR PLAYERS, %, EUROPE
Europe Feed Amino Acids Industry Segmentation
Lysine, Methionine, Threonine, Tryptophan are covered as segments by Sub Additive. Aquaculture, Poultry, Ruminants, Swine are covered as segments by Animal. France, Germany, Italy, Netherlands, Russia, Spain, Turkey, United Kingdom are covered as segments by Country.| Sub Additive | Lysine | |||
| Methionine | ||||
| Threonine | ||||
| Tryptophan | ||||
| Other Amino Acids | ||||
| Animal | Aquaculture | By Sub Animal | Fish | |
| Shrimp | ||||
| Other Aquaculture Species | ||||
| Poultry | By Sub Animal | Broiler | ||
| Layer | ||||
| Other Poultry Birds | ||||
| Ruminants | By Sub Animal | Beef Cattle | ||
| Dairy Cattle | ||||
| Other Ruminants | ||||
| Swine | ||||
| Other Animals | ||||
| Country | France | |||
| Germany | ||||
| Italy | ||||
| Netherlands | ||||
| Russia | ||||
| Spain | ||||
| Turkey | ||||
| United Kingdom | ||||
| Rest of Europe | ||||
Need A Different Region or Segment?
Customize Now
Market Definition
- FUNCTIONS - For the study, feed additives are considered to be commercially manufactured products that are used to enhance characteristics such as weight gain, feed conversion ratio, and feed intake when fed in appropriate proportions.
- RESELLERS - Companies engaged in reselling feed additives without value addition have been excluded from the market scope, to avoid double counting.
- END CONSUMERS - Compound feed manufacturers are considered to be end-consumers in the market studied. The scope excludes farmers buying feed additives to be used directly as supplements or premixes.
- INTERNAL COMPANY CONSUMPTION - Companies engaged in the production of compound feed as well as the manufacturing of feed additives are part of the study. However, while estimating the market sizes, the internal consumption of feed additives by such companies has been excluded.
| Keyword | Definition |
|---|---|
| Feed additives | Feed additives are products used in animal nutrition for purposes of improving the quality of feed and the quality of food from animal origin, or to improve the animals’ performance and health. |
| Probiotics | Probiotics are microorganisms introduced into the body for their beneficial qualities. (It maintains or restores beneficial bacteria to the gut). |
| Antibiotics | Antibiotic is a drug that is specifically used to inhibit the growth of bacteria. |
| Prebiotics | A non-digestible food ingredient that promotes the growth of beneficial microorganisms in the intestines. |
| Antioxidants | Antioxidants are compounds that inhibit oxidation, a chemical reaction that produces free radicals. |
| Phytogenics | Phytogenics are a group of natural and non-antibiotic growth promoters derived from herbs, spices, essential oils, and oleoresins. |
| Vitamins | Vitamins are organic compounds, which are required for normal growth and maintenance of the body. |
| Metabolism | A chemical process that occurs within a living organism in order to maintain life. |
| Amino acids | Amino acids are the building blocks of proteins and play an important role in metabolic pathways. |
| Enzymes | Enzyme is a substance that acts as a catalyst to bring about a specific biochemical reaction. |
| Anti-microbial resistance | The ability of a microorganism to resist the effects of an antimicrobial agent. |
| Anti-microbial | Destroying or inhibiting the growth of microorganisms. |
| Osmotic balance | It is a process of maintaining salt and water balance across membranes within the body's fluids. |
| Bacteriocin | Bacteriocins are the toxins produced by bacteria to inhibit the growth of similar or closely related bacterial strains. |
| Biohydrogenation | It is a process that occurs in the rumen of an animal in which bacteria convert unsaturated fatty acids (USFA) to saturated fatty acids (SFA). |
| Oxidative rancidity | It is a reaction of fatty acids with oxygen, which generally causes unpleasant odors in animals. To prevent these, antioxidants were added. |
| Mycotoxicosis | Any condition or disease caused by fungal toxins, mainly due to contamination of animal feed with mycotoxins. |
| Mycotoxins | Mycotoxins are toxin compounds that are naturally produced by certain types of molds (fungi). |
| Feed Probiotics | Microbial feed supplements positively affect gastrointestinal microbial balance. |
| Probiotic yeast | Feed yeast (single-cell fungi) and other fungi used as probiotics. |
| Feed enzymes | They are used to supplement digestive enzymes in an animal’s stomach to break down food. Enzymes also ensure that meat and egg production is improved. |
| Mycotoxin detoxifiers | They are used to prevent fungal growth and to stop any harmful mold from being absorbed in the gut and blood. |
| Feed antibiotics | They are used both for the prevention and treatment of diseases but also for rapid growth and development. |
| Feed antioxidants | They are used to protect the deterioration of other feed nutrients in the feed such as fats, vitamins, pigments, and flavoring agents, thus providing nutrient security to the animals. |
| Feed phytogenics | Phytogenics are natural substances, added to livestock feed to promote growth, aid in digestion, and act as anti-microbial agents. |
| Feed vitamins | They are used to maintain the normal physiological function and normal growth and development of animals. |
| Feed flavors and sweetners | These flavors and sweeteners help to mask tastes and odors during changes in additives or medications and make them ideal for animal diets undergoing transition. |
| Feed acidifiers | Animal feed acidifiers are organic acids incorporated into the feed for nutritional or preservative purposes. Acidifiers enhance congestion and microbiological balance in the alimentary and digestive tracts of livestock. |
| Feed minerals | Feed minerals play an important role in the regular dietary requirements of animal feed. |
| Feed binders | Feed binders are the binding agents used in the manufacture of safe animal feed products. It enhances the taste of food and prolongs the storage period of the feed. |
| Key Terms | Abbreviation |
| LSDV | Lumpy Skin Disease Virus |
| ASF | African Swine Fever |
| GPA | Growth Promoter Antibiotics |
| NSP | Non-Starch Polysaccharides |
| PUFA | Polyunsaturated Fatty Acid |
| Afs | Aflatoxins |
| AGP | Antibiotic Growth Promoters |
| FAO | The Food And Agriculture Organization of the United Nations |
| USDA | The United States Department of Agriculture |
Need More Details on Market Definition?
Ask a Question
Research Methodology
Mordor Intelligence follows a four-step methodology in all our reports.
- Step-1: IDENTIFY KEY VARIABLES: In order to build a robust forecasting methodology, the variables and factors identified in Step-1 are tested against available historical market numbers. Through an iterative process, the variables required for market forecast are set and the model is built on the basis of these variables.
- Step-2: Build a Market Model: Market-size estimations for the forecast years are in nominal terms. Inflation is not a part of the pricing, and the average selling price (ASP) is kept constant throughout the forecast period.
- Step-3: Validate and Finalize: In this important step, all market numbers, variables and analyst calls are validated through an extensive network of primary research experts from the market studied. The respondents are selected across levels and functions to generate a holistic picture of the market studied.
- Step-4: Research Outputs: Syndicated Reports, Custom Consulting Assignments, Databases & Subscription Platforms

Get More Details On Research Methodology
Download PDF


