
Market Overview
| Study Period | 2020 - 2031 |
|---|---|
| Forecast Data Period | 2026 - 2031 |
| Base Year Market Size (2025) | USD 56.81 Billion |
| Market Size (2026) | USD 61.74 Billion |
| Market Size (2031) | USD 93.58 Billion |
| Growth Rate (2026 - 2031) | 8.67 % |
| Market Concentration | Medium |
Major Players *Disclaimer: Major Players sorted in no particular order Image © Mordor Intelligence. Reuse requires attribution under CC BY 4.0. | |
Europe Event Management Industry Analysis by Mordor Intelligence
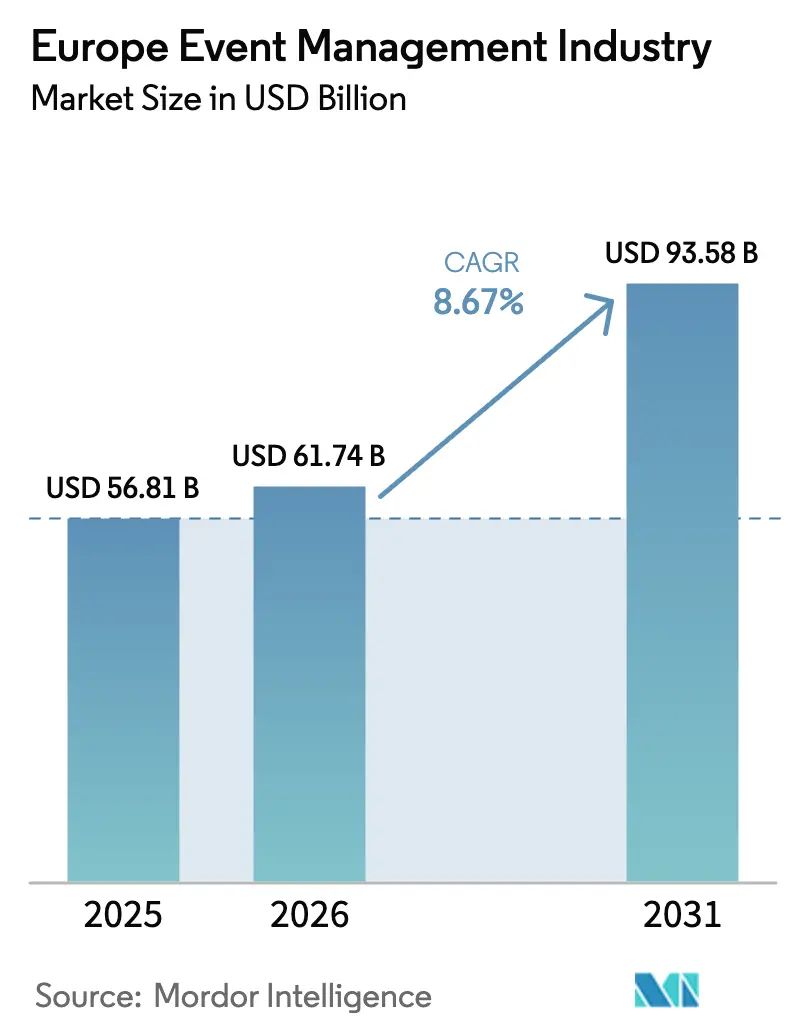
The Europe event management industry market size was valued at USD 56.81 billion in 2025 and estimated to grow from USD 61.74 billion in 2026 to reach USD 93.58 billion by 2031, at a CAGR of 8.67% during the forecast period (2026-2031). This trajectory affirms a strong rebound underpinned by renewed corporate travel, the normalization of large gatherings, and the widespread integration of hybrid delivery models that blend on-site interaction with digital reach. Upward momentum reflects a balance between pent-up demand for in-person networking and persistent investment in virtual infrastructure that insulates organizers from travel disruptions. Sustained marketing outlays on immersive activations, steady government backing for sustainable practices, and improving data analytics capabilities further raise the growth ceiling of the Europe event management industry market. Meanwhile, mid-sized agencies exploit flexible cost bases to win niche mandates, and venue operators pursue premium pricing to recoup inflation-linked overheads.
Key Report Takeaways
- By event type, Corporate Events led with 35.02% revenue share in 2025; Incentive Events are forecast to expand at a 9.88% CAGR through 2031.
- By mode, in-person gatherings captured 62.76% of the Europe event management industry market share in 2025, while hybrid formats are projected to advance at a 12.27% CAGR to 2031.
- By service, Venue / Location Rental accounted for 30.92% of the Europe event management industry market size in 2025, and Virtual / Hybrid Enablement is growing at a 9.96% CAGR through 2031.
- By end user, SMEs controlled a 71.62% share in 2025; large enterprises are set to post the highest 8.81% CAGR over 2026-2031.
- By geography, the United Kingdom retained 27.63% revenue share in 2025; the Nordics region is projected to grow at a 9.03% CAGR to 2031.
Note: Market size and forecast figures in this report are generated using Mordor Intelligence’s proprietary estimation framework, updated with the latest available data and insights as of 2026.
Market Trends and Insights
Drivers Impact Analysis of Europe Event Management Industry*
| Drivers | (~) % Impact on CAGR Forecast | Geographic Relevance | Impact Timeline |
|---|---|---|---|
| Resurgence of in-person MICE events post-pandemic | +2.1% | Global, strongest in UK, Germany, France | Short term (≤ 2 years) |
| Digitalization & adoption of event-management platforms | +1.8% | NORDICS, BENELUX, with spillover to Central Europe | Medium term (2-4 years) |
| Experiential marketing spend by corporates | +1.5% | UK, Germany, France, with expansion to NORDICS | Medium term (2-4 years) |
| EU & government push for sustainable, inclusive events | +1.2% | EU-wide, early adoption in NORDICS, Netherlands | Long term (≥ 4 years) |
| AI-driven matchmaking & ROI analytics | +0.9% | NORDICS, UK, Germany, gradual adoption elsewhere | Medium term (2-4 years) |
| EU Digital Product Passport spurring data-sharing services | +0.7% | EU-wide, initial focus on manufacturing hubs | Long term (≥ 4 years) |
| Source: Mordor Intelligence | |||
Resurgence of In-Person MICE Gatherings
Face-to-face meetings re-emerged as a strategic priority when European business-travel outlays started climbing toward USD 450 billion for 2027. Corporations cite higher deal-conversion rates, quicker product-validation cycles, and deeper client trust as the principal benefits of convening onsite. Trade-show organizers report that AI-powered matchmaking lifted scheduled meetings by 44% compared with the 2023 editions. Convention-center occupancy recovered to 74.8% in 2024, yet venue operators still wrestle with margin compression caused by cost inflation. Enterprise willingness to pay premium day-rates despite inflation underscores the revived importance of physical interaction inside the Europe event management industry market[1].
Digitalization and Platform Adoption
Event technology now spans registration, content streaming, CRM integration, and real-time analytics in one unified stack. Sweden-based InvitePeople posted 95% retention and 48% higher attendee interactions after embedding AI-driven personalization. Across Europe, 73% of planners deem hybrid capability non-negotiable, while privacy-by-design architecture remains a gating factor for procurement. Nordic leadership in broadband quality and cashless payments accelerates experimentation, which then diffuses into Central Europe. These dynamics add fresh tailwinds to the Europe event management industry market.
Rising Experiential Marketing Budgets
Experiential events outperformed traditional media on customer-loyalty metrics in the 2024 Bellwether survey, prompting agencies to scale immersive stages and interactive installations. Automotive, tech, and luxury brands now earmark larger budget shares for live activations that combine education with entertainment. Post-event analytics show that 69% of enterprises tie events directly to revenue generation, while 75% observe productivity gains from corporate gatherings. As spending pivots toward high-engagement formats, the Europe event management industry market secures an expanding marketing wallet share.
EU Drive for Sustainable and Inclusive Events
The Corporate Sustainability Reporting Directive obliges large companies to disclose event-related emissions from 2025. Organizers increasingly adopt ISO 20121 frameworks that mandate objective-setting, supply-chain audits, and stakeholder reporting. Nordic venues already run on renewable energy and furnish real-time carbon dashboards to planners. Demand for carbon-accounting software and accessibility audits broadens service scope, bolstering premium pricing opportunities within the Europe event management industry market[2].
Restraints Impact Analysis of Europe Event Management Industry*
| Restraints | (~) % Impact on CAGR Forecast | Geographic Relevance | Impact Timeline |
|---|---|---|---|
| Inflation-driven venue & staffing cost surge | -1.4% | EU-wide, most severe in Netherlands, Germany, UK | Short term (≤ 2 years) |
| GDPR / cyber-security compliance burdens | -0.8% | EU-wide, highest impact in Germany, France | Medium term (2-4 years) |
| Mandatory carbon-foot-print reporting raises costs | -0.6% | EU-wide, early implementation in NORDICS, Netherlands | Long term (≥ 4 years) |
| Virtual alternatives dent demand in Tier-2 cities | -0.5% | Central and Eastern Europe, smaller German cities | Medium term (2-4 years) |
| Source: Mordor Intelligence | |||
Inflation-Driven Venue and Staffing Costs
Average daily venue rates in the Netherlands climbed 38% over 2019 levels, yet profit margins fell to 35.3% as wage expenses surged. Staff shortages across catering and production disciplines hamper service quality and inflate overtime payments. Elevated energy tariffs oblige venues to implement dynamic pricing and minimum-spend clauses, squeezing corporate budgets. Smaller agencies face liquidity strain, driving consolidation that marginally tempers the Europe event management industry market expansion[3].
GDPR and Cybersecurity Compliance Burden
Non-compliance fines can reach 4% of turnover, prompting rigorous consent workflows, data-residency checks, and ISO 27001 certification of event-tech stacks. The complexity multiplies for hybrid formats that process personal data across streaming, polling, and matchmaking modules. Vendor due diligence cycles extend bid lead times for SME organizers, raising transaction costs and constraining agility. This drag modestly offsets growth prospects in the Europe event management industry market.
*Our forecasts treat driver/restraint impacts as directional, not additive. The impact forecasts reflect baseline growth, mix effects, and variable interactions.
Europe Event Management Industry Segment Analysis
By Event Type:
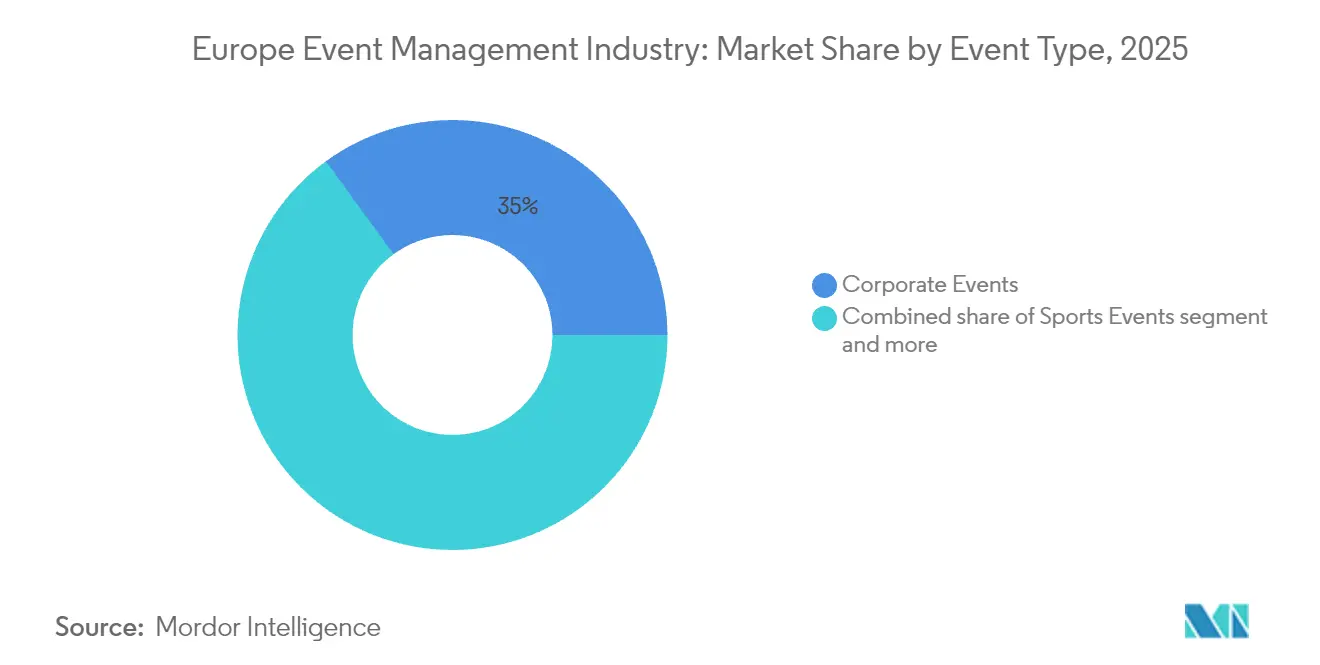
Corporate Dominance Drives RecoveryCorporate Events commanded 35.02% of the Europe event management industry market in 2025, a lead reinforced by executives eager to rebuild culture and client rapport post-remote work. Incentive gatherings, albeit smaller in baseline volume, grow at a brisk 9.88% CAGR as companies use travel and experiences to differentiate retention packages. Association conferences returned to large auditoriums, adding hybrid layers to serve remote professionals. Charity organizers pair live galas with online auctions to widen donor funnels. Festivals and entertainment productions trail the pre-2020 peak because of insurance premiums and crowd-control mandates, but open-air formats draw steady footfall. Meanwhile, sports events reboot hospitality suites, capitalizing on pent-up fan appetite. Hybrid-first events crystallize as a durable niche, granting risk-hedged reach to cautious planners. This diversified mix anchors recurring revenue streams across the Europe event management industry market.
The Europe event management industry market size for Corporate Events climbed alongside board-approved experiential budgets, while the Europe event management industry market share of Incentive Events still sits below 10%, leaving white space for providers fluent in curated travel logistics. Vendors that fuse carbon tracking with experiential storytelling win mid-decade bids from sustainability-minded multinational clients.

By Mode:
In-Person Leadership with Hybrid AccelerationIn-person formats retained 62.76% market share in 2025 because trust-building and complex negotiation favor physical presence. Hybrid models, advancing at 12.27% CAGR, extend content to global users and hedge against travel uncertainties. Virtual sessions stabilize near 15% share, serving internal trainings and onboarding. Organizers designing multi-touchpoint journeys observe higher conversion from pre-event webinars into on-site attendance. AV suppliers and cloud-streaming integrators profit from elevated technical specifications that accompany simultaneous live and digital audiences. This segmentation underscores how the Europe event management industry market adopts a portfolio approach rather than a zero-sum substitution path.
Hybrid’s ascent expands the Europe event management industry market size for platform vendors, while the incremental Europe event management industry market share gain for virtual-only providers plateaus due to audience fatigue. Execution complexity encourages large enterprises to outsource end-to-end production, widening the service revenue pool.
By Service:
Venue Rental Anchors Growth amid Digital InnovationVenue / Location Rental represented 30.92% of the Europe event management industry market size in 2025 and retains pricing power given the finite supply in major hubs. Smart-building retrofits that show real-time occupancy and carbon data enhance appeal. Virtual / Hybrid Enablement services, rising at 9.96% CAGR, encompass studios, extended-reality sets, and backend cloud orchestration. Communication and logistics migrate toward omnichannel marketing and mobile app way-finding, reinforcing attendee engagement. AI-driven matchmaking underpins attendee management, with data privacy modules embedded from inception. Catering embraces plant-forward menus to align with ESG mandates. Team-building experiences pivot to outdoor and wellness-oriented concepts. Integrated providers bundle these components to deepen wallet share in the Europe event management industry market.
The Europe event management industry market share gains in enablement offset margin pressure in commodity services such as basic logistics. Agencies that control both venue brokerage and hybrid production capture outsized value.

By End User:
SME Dominance Reflects Market FragmentationSMEs commanded 71.62% revenue in 2025, demonstrating that Europe’s economic fabric remains heavily decentralized. These clients seek modular packages that cap exposure yet deliver polished brand touchpoints. Large enterprises, projected to post an 8.81% CAGR, require multi-disciplinary teams capable of global compliance reporting and multi-language delivery. Public-sector events proliferate due to stakeholder-consultation mandates embedded in EU directives, adding predictable calendar cycles. Non-profits leverage peer-to-peer fundraising tools inside hybrid builds. Individual professionals consume micro-conferences and career fairs that monetize personal upskilling. Providers that segment by client scale and compliance complexity outperform generic rivals across the Europe event management industry market.
Tailored bundles grow the Europe event management industry market size in the SME tier, while enterprise frameworks with sustainability scorecards bolster the Europe event management industry market share of full-service consultancies.
Geography Analysis
United Kingdom and Continental Europe Event Management Industry
The United Kingdom held a 27.63% share in 2025, sustained by London’s diverse venue stock, multilingual talent, and global air links. Brexit added customs paperwork, yet the mature supplier base blunted friction for cross-border exhibitors. Government incentives for creative-industry apprenticeships enlarge the future workforce. Germany ranks second, drawing industrial expos that orbit its manufacturing clusters. France leverages Parisian cultural cachet and luxury brand patronage. Italy and Spain accelerate as airlines reopen capacity and southern climates appeal for outdoor networking. Benelux punches above its GDP weight by hosting regulatory forums near EU institutions.
Nordics, Baltics and Central Europe Event Management Industry
Nordic nations deliver the fastest 9.03% CAGR, powered by proactive green-event subsidies and unmatched digital readiness. Local operators integrate cash-free transactions and circular-economy supply chains, winning ESG-oriented briefs. Baltic capitals pilot paperless accreditation that slashes queue times and emissions. Central and Eastern European cities offer competitive price points, though infrastructure gaps and skill shortages temper immediate upside. The European Travel Commission logged 6% visitor arrivals versus 2019, confirming a wider tourism uplift that indirectly supports delegate flows. Currency stability against the USD lowers budget volatility for multinationals planning multi-year rotations. Collectively, these nuances shape a patchwork of opportunities that define the Europe event management industry market.
Regulatory Landscape
The Europe event management industry operates under a tightening EU compliance stack spanning sustainability reporting, consumer protection, and digital governance. The Corporate Sustainability Reporting Directive (CSRD), which applies from 2025 for in-scope large companies and is fully in effect in 2026, pushes organizers and suppliers toward auditable event emissions and broader Scope 3 data capture under ESRS. This raises requirements for traceable supplier reporting, carbon accounting, and documentation across venue, catering, and production purchases.
Event marketing and digital engagement are also being reshaped by upcoming enforcement dates. The EU AI Act includes transparency duties (Article 50) that become enforceable from 2 August 2026, affecting AI-driven attendee engagement and content generation workflows used in hybrid events. Separately, the Empowering Consumers for the Green Transition Directive applies from 27 September 2026 and raises the bar for substantiation and clarity of environmental claims in consumer-facing event promotions and sponsor activations. Directive (EU) 2026/1024 on package travel entered into force on 28 May 2026 and changes how bundled travel-related event offerings are treated by simplifying and reorganizing the legal framework.
Value Chain Analysis
The value chain starts with client-side demand owners (corporates, SMEs, public sector, associations) and moves through strategy and creative, venue sourcing and contracting, production and on-site operations (staging, AV, lighting, security), attendee management and engagement technology (registration, matchmaking, analytics), and then post-event reporting (ROI, lead attribution, and sustainability disclosures). Large integrated players span multiple links of the chain, for example combining venue ownership or management with exhibition organization and technical services. Specialist agencies and local suppliers fill gaps in design, staffing, logistics, and catering.
Compliance and data requirements are increasingly shaping procurement and supplier selection. CSRD-driven Scope 3 reporting is shifting buying behavior toward vendors that can provide verifiable sustainability data and documentation across temporary structures, freight, F&B, and venue utilities. On the standards and advocacy side, the European Events and Exhibition Industry Alliance (EEEIA) formed in April 2026 in Brussels to consolidate policy engagement across venues, organizers, and service providers. This reinforces cross-border alignment on operational norms that influence how service providers package and evidence their offerings.
Competitive Landscape
Market fragmentation characterizes the Europe event management industry: the top five suppliers account for under 15% combined revenue. Scale players concentrate on multinational briefs, bundling venue contracting, creative design, and hybrid technology. Mid-tier agencies differentiate through vertical specialization, such as pharma congresses or fintech roadshows. Technology disruptors like Grip deploy machine-learning algorithms that elevate networking ROI and squeeze manual curation models. White-label SaaS platforms empower micro-agencies to punch above headcount, reinforcing fragmentation.
M&A activity intensified as Impact XM bought Touch Associates to expand its European footprint, while Weezevent merged with Eventix to create a trans-regional ticketing backbone. Strategic stakes target data analytics, GDPR compliance, and sustainability scoring to augment premium value propositions. Venue groups invest in on-site broadcast studios, capturing hybrid revenue streams. Supplier pricing gravitates to dynamic tiering tied to occupancy, bandwidth, and carbon offsets. The Europe event management industry market rewards firms that integrate privacy-safe data, sustainable operations, and immersive tech in one seamless offer.
Europe Event Management Market Leaders
-
GL events
-
Reed Exhibitions
-
ASM Global
-
CWT Meetings & Events
-
BCD Meetings & Events
- *Disclaimer: Major Players sorted in no particular order

Europe Event Management Industry Companies Covered in this Report
- GL events
- Reed Exhibitions
- ASM Global
- CWT Meetings & Events
- BCD Meetings & Events
- Informa (RX)
- Forum Europe
- Smart Works Events
- Absolute Event Services
- DFA Productions
- Eclipse Leisure
- Felix Events
- Hughes Productions
- Irwin Video
- JP Events Ltd
- Off Limits
- Owl Live
- GL Events Live
- Maritz Global Events
- Messe Frankfurt Venue GmbH
Market Opportunities and Future Outlook
Sustainability compliance creates a clear service upsell path. CSRD and ESRS-linked reporting needs translate into demand for event-level carbon measurement, supplier data collection, and audit-ready documentation embedded into planning, venue operations, and post-event reporting. Providers that already run end-to-end delivery models, such as GL events with its integrated venue, infrastructure, and technical services footprint, have a practical advantage in bundling measurable sustainability outputs (for venues, production, and logistics) into a single contract and reducing the reporting workload for enterprise clients.
Hybrid delivery continues to broaden the addressable audience and reduce disruption exposure by combining on-site execution with digital production and engagement tooling. This supports opportunities in integrated platform stacks (registration, streaming, CRM, and analytics) and in technical production capacity at venues, including in-venue studios and higher-spec AV and connectivity services. The policy push around AI transparency (EU AI Act enforceable from 2 August 2026) and green-claims substantiation (Green Transition Directive applying from 27 September 2026) also opens whitespace for event-tech and agency offerings that build in privacy-by-design, AI disclosure controls, and compliant sponsor-activation claims management, rather than treating them as one-off legal additions.
Recent Industry Developments in Europe Event Management Industry
- July 2026: Legends Global / ASM Global announced a 15-year management agreement for the Acrisure Amphitheater and Amway Stadium in Grand Rapids, Michigan. The deal stabilizes revenue, expands premium venue services, and strengthens the US market footprint.
- March 2026: GL events reports that the French Competition Authority approved the acquisition of Fimalac venues, including 23 regional venues and Salle Pleyel, with closing expected from 16 April 2026. The consolidation of a key European venue portfolio expands scale and cross-selling opportunities in France and regional markets.
- March 2025: Impact XM acquired Touch Associates to deepen experiential production capacity across Europe. This expands the Europe based experiential and events production footprint and service offerings.
Europe Event Management Industry Report Scope and Research Methodology
Market Definition and Coverage
For this study, the market is defined as revenues earned by firms that plan, organize, and manage events across Europe, including fees for end-to-end delivery as well as outsourced event services used by organizers.
Scope exclusions: We exclude venue-owned core rental income and travel or accommodation spending unless it is packaged and billed as part of an event management service.
Segments Covered in This Report
- By Event Type
- Corporate Events
- Association & Conference Events
- Non-profit & Charity Events
- Festivals & Entertainment
- Sports Events
- Hybrid / Virtual-First Events
- Others
- By Mode
- In-person
- Hybrid
- Virtual
- By Service
- Strategy & Planning
- Communication & Logistics
- Venue / Location Rental
- Attendee Management & Engagement
- Virtual / Hybrid Enablement
- Catering & Hospitality
- Team-building & Experiences
- By End User
- Corporate Organisations
- SMEs
- Public Sector / Government
- Individual Consumers
- Non-profits & Associations
- By Geography
- United Kingdom
- Germany
- France
- Italy
- Spain
- BENELUX (Belgium, Netherlands, and Luxembourg)
- NORDICS (Denmark, Finland, Iceland, Norway, and Sweden)
- Rest of Europe
Data Sources, Market Sizing, and Validation
Desk Research
Desk research was used to map the demand base for events and to anchor key inputs that are hard to estimate from interviews alone. We relied on public, repeatable references such as Eurostat service-sector indicators, national statistical offices in major European countries, ICCA country and city rankings for association meetings, UFI releases on exhibition activity, and EU guidance that affects cross-border events and sustainability reporting.
To translate activity signals into a revenue model, we also reviewed annual reports and investor presentations of listed organizers and venue groups, along with reputable press coverage of major event calendars and capacity expansions. Where needed, we used paid subscriptions focused on company financial intelligence, news and financials, and global contracts and tenders to sanity-check contract values and the timing of large awarded programs. This list of desk research sources is illustrative, and many other public and proprietary references were also used to collect data, validate assumptions, and clarify findings.
Primary Interviews and Surveys
Primary work centered on validating how budgets get allocated across planners, agencies, and specialist subcontractors, and how those allocations shift by event format and country. We spoke with respondents across organizer types, venue-facing teams, and service providers, and then checked differences across the main European markets and the wider regional cluster to close data gaps and firm up pricing and utilization assumptions.
Distribution of primary research fieldwork respondents
| Company type | Respondent position |
|---|---|
| Top tier: 26% | CXOs: 18% |
| Mid tier: 54% | Functional/Unit leaders: 24% |
| Smaller Players: 20% | Managers: 58% |
Market-Sizing & Forecasting
Market sizing started from a top-down build where service revenue is reconstructed from the regional event activity pool and typical outsourcing intensity, and then shaped by country mix across Europe. The totals were corroborated using selective bottom-up checks, such as sampling organizer revenues, cross-checking known program budgets, and testing implied average fees against observed contract ranges so that outliers could be corrected.
Inputs used in the model included (as examples) the annual count and scale mix of business events and exhibitions, the share of hybrid delivery that adds platform and production spend, venue capacity utilization and booking lead times, typical per-attendee production and staffing intensity for larger formats, and agency fee structures by service bundle. Where a direct data point was missing for smaller countries, we filled gaps using proxy indicators like service-sector output trends and meeting destination rankings, and then normalized results to avoid double counting between organizer fees and subcontracted services.
For forecasting, we used scenario analysis supported by a light multivariate regression on drivers such as corporate marketing spend direction, inbound business travel normalization, and the pace of hybrid adoption. The final growth path was adjusted only after primary feedback confirmed which assumptions were likely to hold over the forecast window.
Data Validation & Update Cycle
Validation was done through multiple checks so the final number stays tied to real activity and realistic pricing. We compared modeled revenue against independent signals like major event calendars, publicly discussed attendance levels, and organizer financial disclosures, and then reviewed large variances country by country before sign-off.
Anomalies triggered follow-up calls, especially when implied fees moved faster than what providers said they could pass through, or when format mix shifts changed the service basket too sharply. Reports are refreshed annually, and interim updates are made when material events occur (for example, regulation shifts, major cancellations, or large venue capacity additions). Before delivery, a final analyst pass is completed so clients receive the most current view available at that time.
Mordor Intelligence's Europe Event Management Market Estimate Compared With Other Published Estimates
Published market sizes for Europe event management can vary a lot, even when they look like they are talking about the same thing. The differences usually come from what is counted as event management revenue versus the wider events economy, the base year chosen, and how pricing and format shifts are handled.
The main gap comes from whether venue rental, travel, and on-site visitor spend are included, where Mordor Intelligence counts only organizer and outsourced service revenues and keeps venue-owned core rental and broader tourism spend outside the total, which pulls the number closer to what service providers actually bill each year.
Benchmark comparison
| Source | Market Size | Gaps in Research Methodology |
|---|---|---|
| Mordor Intelligence | USD 56.81 B (2025) | |
| Industry Association A | USD 72.40 B (2025) | Often treats the market as the broader events economy, which can fold in venue rental and attendee travel spend, thereby inflating the service-only revenue pool. |
| Global Consultancy B | USD 49.90 B (2024) | Uses an earlier base year and tends to apply more conservative fee growth, and it may understate hybrid-related production and platform services that lifted average project values. |
The table shows that the spread is mostly explained by scope boundaries and base-year handling rather than a true disagreement on demand direction. By separating organizer and outsourced services from adjacent spend categories, and by checking fee and format assumptions against interviews and public activity signals, the estimate stays transparent and easier to reproduce when inputs change.
Key Questions Answered in the Report
How large is the Europe event management industry market in 2026?
It reached USD 61.74 billion in 2026 and is projected to hit USD 93.58 billion by 2031.
What CAGR does the market expect through 2031?
The forecast CAGR stands at 8.67% over the 2026–2031 period.
Which event type currently dominates spending?
Corporate Events account for 35.02% of 2025 revenue owing to renewed emphasis on face-to-face collaboration.
Which geographic bloc is growing fastest?
Nordic countries lead with a 9.03% CAGR thanks to advanced digital infrastructure and strong sustainability credentials.