| Study Period | 2018 - 2030 |
| Base Year For Estimation | 2024 |
| Forecast Data Period | 2025 - 2030 |
| Market Size (2025) | USD 23.65 Billion |
| Market Size (2030) | USD 33.56 Billion |
| CAGR (2025 - 2030) | 7.25 % |
| Market Concentration | Low |
Major Players*Disclaimer: Major Players sorted in no particular order |

Europe Energy Drinks Market Analysis
The Europe Energy Drinks Market size is estimated at 23.65 billion USD in 2025, and is expected to reach 33.56 billion USD by 2030, growing at a CAGR of 7.25% during the forecast period (2025-2030).
The European energy drink landscape has undergone a significant transformation, evolving from a niche athletic supplement to a mainstream beverage category. This shift is evidenced by the fact that in 2023, approximately 70% of Europeans reported regular energy drink consumption, highlighting the broad consumer acceptance across various demographics. The industry has witnessed substantial digital transformation in its marketing and distribution strategies, with manufacturers leveraging social media platforms for brand building and consumer engagement. Leading brands have established strategic partnerships with sports clubs and entertainment venues, creating multi-channel marketing campaigns that resonate with diverse consumer segments. The rise of digital commerce has further accelerated market penetration, with 96% of Europeans aged 16-29 reporting daily internet usage in 2022, creating new opportunities for direct-to-consumer sales and personalized marketing.
Product innovation and formulation evolution have become central to market competition, with manufacturers responding to growing health consciousness among consumers. In 2023, a notable 41% of German consumers expressed willingness to pay premium prices for energy drinks made exclusively from natural energy boosters, reflecting a broader shift toward healthier alternatives. Manufacturers are increasingly incorporating functional ingredients like guarana, green tea, and natural caffeine, while simultaneously reducing or eliminating artificial additives. This trend has sparked a wave of product launches featuring clean labels, organic certifications, and enhanced nutritional profiles, exemplified by recent launches like PepsiCo's Rockstar Energy + Hemp, which combines traditional energy-boosting ingredients with innovative hemp extract.
The packaging landscape has witnessed significant evolution, driven by sustainability concerns and changing consumer preferences. In 2022, Europeans utilized approximately 50 billion cans for packaged beverages, with energy drink manufacturers leading innovations in sustainable packaging solutions. Companies are increasingly adopting recycled materials and implementing eco-friendly packaging designs, with several major brands transitioning to 100% recycled PET bottles or aluminum cans. The industry has also seen diversification in packaging formats, from traditional cans to resealable bottles and innovative portable solutions, catering to various consumption occasions and lifestyle needs.
Digital retail transformation has revolutionized energy drink distribution and consumer access. With 82% of UK consumers actively shopping online in 2022, manufacturers have adapted their distribution strategies to embrace e-commerce platforms and direct-to-consumer channels. This shift has been accompanied by innovative marketing techniques, including personalized recommendations, subscription services, and social media-driven campaigns. Recent market developments include the launch of exclusive online-only variants and digital-first brands, such as GÖNRGY's collaboration with German social media star MontanaBlack in 2023, demonstrating the industry's adaptation to changing consumer purchasing behaviors and preferences. The energy drink market size continues to expand, driven by these digital advancements and evolving consumer demands.
Europe Energy Drinks Market Trends
The growing need for instant boost and alertness, especially among youngsters fuels the demand for energy drink
- Consumption of energy drink is more common in males than in females, with consumption increasing with age. 19% of UK adolescents consume an energy drink 4-5 days per week or more.
- Consumers are concerned about sugar intake, and are opting for energy drinks with reduced sugar or those labeled as "sugar-free" or "low-sugar."
- Discounts and promotions, such as buy-one-get-one-free offers or multi-pack deals are impacting consumer behavior, especially when consumers perceive good value for money.
- The European soft drinks sector has reduced 17.7% of average added sugars in the last seven years based on the bolstered health and nutrition commitments set out by the Union of European Soft Drinks Associations (UNESDA).
Understand The Key Trends Shaping This Market
Download PDF
OTHER KEY INDUSTRY TRENDS COVERED IN THE REPORT
- Manufacturers are introducing drinks having targeted formulations tailored to mental focus, energy boost, or relaxation
- Red Bull's involvement in extreme sports sponsorship has been instrumental in shaping its brand image
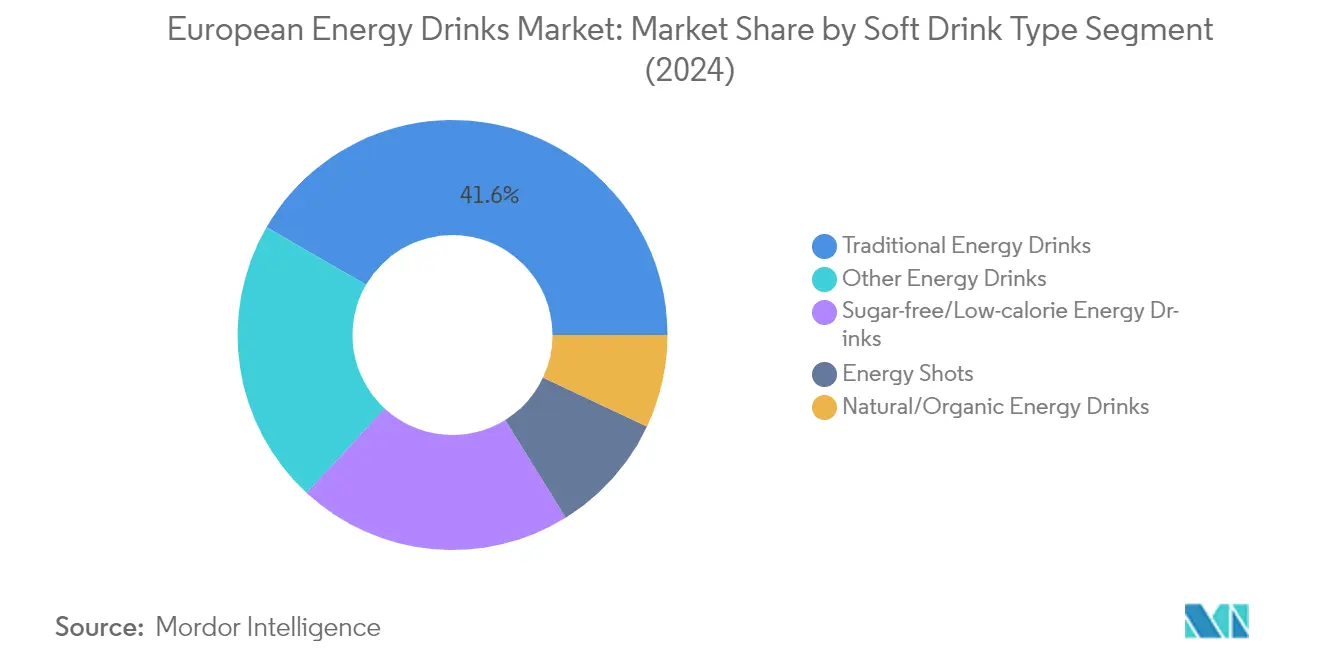
Segment Analysis: Soft Drink Type
Traditional Energy Drinks Segment in European Energy Drinks Market
Traditional energy drinks maintain their dominance in the European market, commanding approximately 42% energy drink market share in 2024. This segment's strong position is underpinned by established consumer preferences and brand loyalty to classic energy drink formulations. The segment's growth is driven by continuous product innovation, particularly in flavor varieties, with major brands introducing new options like watermelon and mango to cater to evolving consumer tastes. The segment's success is further bolstered by strategic marketing initiatives, including partnerships with sports clubs and digital presence enhancement across social media platforms. Leading brands in this segment have also expanded their distribution networks, ensuring widespread product availability across various retail channels.
Natural/Organic Energy Drinks Segment in European Energy Drinks Market
The natural/organic energy drinks segment is emerging as the most dynamic category in the European market, projected to grow at approximately 8% from 2024 to 2029. This remarkable growth is driven by increasing consumer awareness and preference for healthier alternatives. The segment's expansion is supported by innovative formulations incorporating organic fruit juices, botanical extracts, vitamins, and natural sweeteners like stevia. Manufacturers are responding to this trend by developing products that not only provide energy but also offer additional health benefits such as antioxidants, vitamins, and minerals. The segment's growth is particularly strong in markets where health consciousness is high, with consumers showing increased willingness to pay premium prices for products containing natural energy boosters.
Remaining Segments in Soft Drink Type
The energy drinks market is further diversified by sugar-free/low-calorie energy drinks, energy shots, and other specialized variants. Sugar-free and low-calorie options have gained significant traction among health-conscious consumers and athletes focusing on weight management. Energy shots have carved out a distinct niche, particularly appealing to consumers seeking concentrated energy boosts in convenient formats. The "other" category encompasses innovative formulations such as functional energy drinks, caffeine-free variants, and hybrid beverages, each addressing specific consumer needs and preferences. These segments collectively contribute to the market's diversity and cater to various consumer demographics and consumption occasions.
Segment Analysis: Packaging Type
Metal Can Segment in European Energy Drinks Market
Metal cans dominate the European energy drinks market, commanding approximately 54% market share energy drinks in 2024. This dominance can be attributed to several factors, including superior temperature insulation capabilities and enhanced portability that make them ideal for outdoor activities. The United Kingdom leads the beverage can market, with around 9.7 billion cans shipped in 2023. Manufacturers are strategically diversifying can sizes to cater to different demographics, with conventional 330 ml cans being the most popular. Countries like Turkey and Russia show a preference for smaller can sizes such as 200 ml and 250 ml, while major brands like Monster Energy and Red Bull have expanded their offerings to include sleek 355 ml cans and larger 473 ml and 591 ml formats.
Glass Bottles Segment in European Energy Drinks Market
The glass bottles segment is experiencing remarkable growth in the European energy drinks market, projected to grow at approximately 8% annually from 2024 to 2029. This growth is driven by increasing consumer preference for premium packaging options and rising environmental consciousness. Glass bottles are particularly favored for their superior oxygen and gas barrier properties, which help preserve the freshness and shelf life of energy drinks. The perception of glass as a mark of quality has led consumers to view beverages in glass bottles as premium offerings. Unlike PET bottles, glass ensures the integrity of energy drinks by preventing any chemical leaching, making it an increasingly popular choice among health-conscious consumers and premium brands looking to differentiate their products in the market.
Remaining Segments in Packaging Type
PET bottles represent a significant segment in the European energy drinks market, offering a balance between convenience and practicality. These bottles are particularly valued for their lightweight nature, resealability, and durability, making them ideal for on-the-go consumption. The transparent nature of PET bottles allows consumers to see the product, enhancing their appeal during purchase decisions. Additionally, manufacturers are increasingly focusing on sustainable PET packaging solutions, including the use of recycled materials and eco-friendly production processes, aligning with growing environmental concerns among European consumers.
Segment Analysis: Distribution Channel
Off-trade Segment in European Energy Drinks Market
The off-trade channel, particularly through supermarkets and hypermarkets, maintains its dominance in the European energy drinks market, commanding approximately 45% energy drink share in 2024. This substantial market presence is attributed to the extensive network of major retail chains including Aldi, Lidl, Tesco, Carrefour, and Sainsbury's, which showcase a comprehensive range of energy drinks from popular brands like Red Bull, Monster Energy, and Rockstar, alongside emerging natural and health-focused variants. These retail giants leverage their widespread presence and efficient supply chains to offer competitive pricing and frequent promotional activities. Supermarkets and hypermarkets also cater effectively to health-conscious consumers by providing an extensive selection of natural ingredient-based and reduced-sugar energy drinks. The success of this channel is further reinforced by the implementation of strategic product placement, loyalty programs, and the ability to offer bulk purchase options, making it a preferred choice for consumers seeking value and variety.
Online Retail Segment in European Energy Drinks Market
The online retail channel is experiencing remarkable growth in the European energy drinks market, projected to expand at approximately 11% through 2024-2029. This accelerated growth is driven by the increasing penetration of e-commerce platforms and evolving consumer preferences for convenient shopping solutions. The digital marketplace has become particularly attractive for consumers seeking sugar-free and low-calorie energy drinks, with online retailers offering extensive product information, user reviews, and competitive pricing. Energy drink brands are actively leveraging digital marketing and social media platforms to enhance their visibility and drive online sales. The convenience of home delivery, subscription services, and the ability to compare prices across different platforms has made online retail an increasingly popular choice among consumers. The channel's growth is further supported by the rising internet penetration across Europe, with countries like the Netherlands, Denmark, and Ireland showing particularly strong adoption of online shopping for beverages.
Remaining Segments in Distribution Channel
Beyond supermarkets/hypermarkets and online retail, the European energy drinks market is served through various other distribution channels including convenience stores, specialized beverage retailers, and on-trade establishments. Convenience stores play a crucial role in meeting immediate consumption needs, particularly in urban areas and travel locations. The on-trade channel, encompassing bars, restaurants, and entertainment venues, contributes significantly to market growth by offering energy drinks as standalone beverages and as mixing components for cocktails. These channels are particularly important for introducing new products and flavors to the market, as they often serve as testing grounds for innovative energy drink variants. Additionally, specialized beverage retailers provide expert knowledge and premium product selections, catering to discerning consumers seeking unique or craft energy drink options.
Europe Energy Drinks Market Geography Segment Analysis
Energy Drinks Market in Germany
Germany dominates the European energy drinks market in Germany landscape, commanding approximately 19% of the regional market value in 2024. The country's market leadership is driven by its robust retail infrastructure and evolving consumer preferences toward healthier energy drinks in Germany variants. The growing health consciousness among German consumers has led to increased demand for sugar-free and natural energy drinks, particularly among millennials and young professionals. Major supermarket chains like Edeka, Lidl, and Aldi have expanded their energy drink portfolios to include organic and functional varieties, catering to this health-conscious demographic. The market has also witnessed significant growth in online retail channels, supported by Germany's high internet penetration rate of 93% as of 2023. Energy drink manufacturers are increasingly focusing on product innovation, introducing variants with cognitive support ingredients and immune-boosting properties to meet diverse consumer needs.
Energy Drinks Market in Turkey
Turkey stands out as the most dynamic market in Europe's energy drinks sector, projected to achieve approximately 9% growth annually from 2024 to 2029. The market's robust expansion is largely attributed to the country's growing sports and fitness culture, with about 13.5 million people above age 19 actively engaged in sports activities as of 2022. The country's rising reputation in international sports, particularly in endurance events like running and wrestling, has created a strong foundation for energy drink consumption. Traditional energy drinks dominate the Turkish market, accounting for a significant portion of sales, with established brands like Red Bull, Monster Energy, and Coca-Cola Burn maintaining strong market positions. The market's growth is further supported by increasing sports sponsorships and partnerships, enhancing brand visibility and consumer engagement across various demographic segments.
Energy Drinks Market in United Kingdom
The United Kingdom's energy drinks market in the UK demonstrates strong growth potential, driven by the country's well-established fitness and wellness culture. With over 10 million people holding gym memberships and a significant portion of the population engaging in regular physical activities, the demand for energy-boosting beverages continues to rise. The market has witnessed a notable shift toward healthier alternatives, with consumers increasingly favoring natural and low-calorie options. Online retail has emerged as a crucial distribution channel, with 36% of the population purchasing beverages through digital platforms in 2022. The market's evolution is characterized by the emergence of innovative local brands like Tenzing and PerfectTed, which have secured investments to expand their product ranges with natural and plant-based formulations. These brands are becoming popular energy drinks in the UK.
Energy Drinks Market in Russia
Russia's energy drinks market is characterized by a growing fitness culture and increasing health awareness among consumers. The country's fitness enthusiasm is evident from the 238 million fitness club visits recorded in 2022, creating a substantial consumer base for energy drinks. The market shows a strong preference for traditional energy drinks, with consumers increasingly seeking products fortified with functional ingredients like vitamins, antioxidants, and botanical extracts. Local and international brands compete through product differentiation and innovative formulations, catering to diverse consumer preferences. The market has also witnessed a growing trend toward organic and natural energy drinks, reflecting the broader shift in consumer preferences toward healthier alternatives. Distribution channels have evolved to include modern retail formats and online platforms, enhancing product accessibility across urban and suburban areas.
Energy Drinks Market in Other Countries
The energy drinks market in other European countries, including energy drinks market in France, energy drinks market in Spain, Belgium, energy drinks market in Italy, and the Netherlands, exhibits diverse growth patterns influenced by local consumer preferences and retail structures. These markets are characterized by increasing health consciousness and a growing preference for natural and functional ingredients. The rise of fitness culture and active lifestyles across these nations has created new opportunities for energy drink manufacturers. Modern retail formats and e-commerce platforms play crucial roles in product distribution, while product innovation focuses on meeting specific regional tastes and preferences. These markets also show strong potential for premium and specialized energy drink segments, particularly those offering unique functional benefits or natural formulations. The competitive landscape varies by country, with both international brands and local players vying for market share through targeted marketing strategies and product differentiation.
Get Analysis on Important Geographic Markets
Download PDF
Europe Energy Drinks Industry Overview
Top Companies in Europe Energy Drinks Market
The European energy drinks market features prominent players like Red Bull GmbH, Monster Beverage Corporation, PepsiCo, and Suntory Holdings Limited leading the competitive landscape. Product innovation remains a key strategic focus, with companies continuously introducing new flavors, sugar-free variants, and functional ingredients to meet evolving consumer preferences. Operational agility is demonstrated through sophisticated manufacturing processes and efficient distribution networks, enabling rapid market responsiveness. Strategic partnerships, particularly with sports organizations and entertainment venues, have become instrumental in building brand visibility and market presence. Companies are actively expanding their geographical footprint through strategic alliances with local distributors and retailers, while simultaneously strengthening their digital presence through e-commerce platforms and social media engagement.
Market Structure Shows Dynamic Competitive Environment
The European energy drinks market exhibits a fragmented competitive landscape, characterized by a mix of global beverage conglomerates and specialized energy drink brands. Global players leverage their extensive distribution networks and marketing capabilities to maintain market dominance, while regional specialists carve out niches through targeted product offerings and local market expertise. The market demonstrates moderate consolidation, with larger companies actively pursuing strategic acquisitions of smaller, innovative brands to expand their product portfolios and capture emerging market segments.
The competitive dynamics are shaped by intense rivalry among established players and the continuous entry of new competitors, particularly in the premium and health-focused segments. Market leaders maintain their positions through substantial investments in research and development, brand building, and distribution infrastructure. The industry has witnessed several strategic partnerships and joint ventures, particularly in developing new product formulations and expanding distribution reach, rather than outright acquisitions, indicating a preference for collaborative growth strategies.
Innovation and Adaptability Drive Future Success
Success in the European energy drinks market increasingly depends on companies' ability to innovate while maintaining operational efficiency. Market leaders must focus on developing health-conscious product variants, implementing sustainable packaging solutions, and strengthening their digital presence to maintain their competitive edge. Building strong relationships with retailers and distributors remains crucial, while investing in direct-to-consumer channels can help capture emerging opportunities. Companies need to balance premium positioning with competitive pricing strategies while maintaining product quality and brand integrity.
For emerging players and market contenders, success lies in identifying and serving underserved market segments with innovative products and unique value propositions. This includes developing specialized formulations for specific consumer groups, leveraging local market knowledge, and building a strong online presence. Companies must also prepare for potential regulatory changes, particularly regarding ingredient composition and marketing restrictions. Building resilient supply chains and maintaining flexibility in production capabilities will be crucial for long-term success, while establishing strong relationships with key stakeholders across the value chain will help mitigate competitive pressures.
Europe Energy Drinks Market Leaders
-
Monster Beverage Corporation
-
PepsiCo, Inc.
-
Red Bull GmbH
-
Suntory Holdings Limited
-
Vitamin Well Limited
- *Disclaimer: Major Players sorted in no particular order

Need More Details on Market Players and Competitors?
Download PDF
Europe Energy Drinks Market News
- October 2023: Quality Pack International, a member of Hell Group and the Azerbijan company signed an agreement to establish a joint venture company the Quality Pack Capian LLC. QPC’s objective is to implement a vertically integrated aluminum beverage can manufacturing and non-alcoholic beverage filling factory in the Alat Free Economic Zone of Azerbaijan, which can serve as a regional production hub for local and regional beverage brands, either selling empty cans alone or also filling them.
- September 2023: Red Bull unveiled its first limited Winter Edition in the United Kingdom. Red Bull Winter Edition Spiced Pear offers a blend of pear accented with a dash of cinnamon.
- April 2023: Prime has launched a range of energy drinks containing 200mg of caffeine and zero sugar. The new drinks hold 300mg of electrolytes contain 10 calories, and are available in blue raspberry, tropical punch, lemon-lime, orange mango, and strawberry watermelon flavors.
Free With This Report
We provide a comprehensive and exhaustive set of data pointers for global, regional, and country-level metrics that illustrate the fundamentals of the soft drinks industry. With the help of 45+ free charts, clients can access in-depth market analysis based on price trend analysis of per capita spending on various soft drinks, through granular-level segmental information supported by a repository of market data, trends, and expert analysis. Data and analysis on soft drink category, packaging type, distribution channel insights into consumer preferences and purchasing patterns, an overview of key market players, etc., are available in the form of comprehensive reports as well as excel-based data worksheets.


Europe Energy Drinks Market Report - Table of Contents
1. EXECUTIVE SUMMARY & KEY FINDINGS
2. REPORT OFFERS
3. INTRODUCTION
- 3.1 Study Assumptions & Market Definition
- 3.2 Scope of the Study
- 3.3 Research Methodology
4. KEY INDUSTRY TRENDS
- 4.1 Consumer Buying Behaviour
- 4.2 Innovations
- 4.3 Brand Share Analysis
- 4.4 Regulatory Framework
5. MARKET SEGMENTATION (includes market size in Value in USD and Volume, Forecasts up to 2030 and analysis of growth prospects)
-
5.1 Soft Drink Type
- 5.1.1 Energy Shots
- 5.1.2 Natural/Organic Energy Drinks
- 5.1.3 Sugar-free or Low-calories Energy Drinks
- 5.1.4 Traditional Energy Drinks
- 5.1.5 Other Energy Drinks
-
5.2 Packaging Type
- 5.2.1 Glass Bottles
- 5.2.2 Metal Can
- 5.2.3 PET Bottles
-
5.3 Distribution Channel
- 5.3.1 Off-trade
- 5.3.1.1 Convenience Stores
- 5.3.1.2 Online Retail
- 5.3.1.3 Supermarket/Hypermarket
- 5.3.1.4 Others
- 5.3.2 On-trade
-
5.4 Country
- 5.4.1 Belgium
- 5.4.2 France
- 5.4.3 Germany
- 5.4.4 Italy
- 5.4.5 Netherlands
- 5.4.6 Russia
- 5.4.7 Spain
- 5.4.8 Turkey
- 5.4.9 United Kingdom
- 5.4.10 Rest of Europe
6. COMPETITIVE LANDSCAPE
- 6.1 Key Strategic Moves
- 6.2 Market Share Analysis
- 6.3 Company Landscape
-
6.4 Company Profiles
- 6.4.1 Beverage Brands Holding Limited
- 6.4.2 Congo Brands
- 6.4.3 Dark Dog Drink Co. (Asia) Pte Ltd
- 6.4.4 Hell Energy Magyarország Korlátolt Felelosségu Társaság
- 6.4.5 Monster Beverage Corporation
- 6.4.6 PepsiCo, Inc.
- 6.4.7 Primo Water Corporation
- 6.4.8 Red Bull GmbH
- 6.4.9 S. Spitz GmbH
- 6.4.10 Suntory Holdings Limited
- 6.4.11 The Coca-Cola Company
- 6.4.12 The Monarch Beverage Company Inc.
- 6.4.13 Vitamin Well Limited
- *List Not Exhaustive
7. KEY STRATEGIC QUESTIONS FOR SOFT DRINK CEOS
8. APPENDIX
-
8.1 Global Overview
- 8.1.1 Overview
- 8.1.2 Porter’s Five Forces Framework
- 8.1.3 Market Dynamics (DROs)
- 8.2 Sources & References
- 8.3 List of Tables & Figures
- 8.4 Primary Insights
- 8.5 Data Pack
- 8.6 Glossary of Terms
You Can Purchase Parts Of This Report. Check Out Prices For Specific Sections
Get Price Break-up Now
List of Tables & Figures
- Figure 1:
- CONSUMER BUYING BEHAVIOUR
- Figure 2:
- INNOVATIONS
- Figure 3:
- BRAND SHARE ANALYSIS
- Figure 4:
- VOLUME OF ENERGY DRINKS MARKET, LITRES, EUROPE, 2018 - 2030
- Figure 5:
- VALUE OF ENERGY DRINKS MARKET, USD, EUROPE, 2018 - 2030
- Figure 6:
- VOLUME OF ENERGY DRINKS MARKET BY SOFT DRINK TYPE, LITRES, EUROPE, 2018 - 2030
- Figure 7:
- VALUE OF ENERGY DRINKS MARKET BY SOFT DRINK TYPE, USD, EUROPE, 2018 - 2030
- Figure 8:
- VALUE SHARE OF ENERGY DRINKS MARKET SPLIT BY SOFT DRINK TYPE, %, EUROPE, 2018 VS 2024 VS 2030
- Figure 9:
- VOLUME SHARE OF ENERGY DRINKS MARKET SPLIT BY SOFT DRINK TYPE, %, EUROPE, 2018 VS 2024 VS 2030
- Figure 10:
- VOLUME OF ENERGY SHOTS MARKET, LITRES, EUROPE, 2018 - 2030
- Figure 11:
- VALUE OF ENERGY SHOTS MARKET, USD, EUROPE, 2018 - 2030
- Figure 12:
- VALUE SHARE OF ENERGY SHOTS MARKET SPLIT BY PACKAGING TYPE, %, EUROPE, 2023 VS 2030
- Figure 13:
- VOLUME OF NATURAL/ORGANIC ENERGY DRINKS MARKET, LITRES, EUROPE, 2018 - 2030
- Figure 14:
- VALUE OF NATURAL/ORGANIC ENERGY DRINKS MARKET, USD, EUROPE, 2018 - 2030
- Figure 15:
- VALUE SHARE OF NATURAL/ORGANIC ENERGY DRINKS MARKET SPLIT BY PACKAGING TYPE, %, EUROPE, 2023 VS 2030
- Figure 16:
- VOLUME OF SUGAR-FREE OR LOW-CALORIES ENERGY DRINKS MARKET, LITRES, EUROPE, 2018 - 2030
- Figure 17:
- VALUE OF SUGAR-FREE OR LOW-CALORIES ENERGY DRINKS MARKET, USD, EUROPE, 2018 - 2030
- Figure 18:
- VALUE SHARE OF SUGAR-FREE OR LOW-CALORIES ENERGY DRINKS MARKET SPLIT BY PACKAGING TYPE, %, EUROPE, 2023 VS 2030
- Figure 19:
- VOLUME OF TRADITIONAL ENERGY DRINKS MARKET, LITRES, EUROPE, 2018 - 2030
- Figure 20:
- VALUE OF TRADITIONAL ENERGY DRINKS MARKET, USD, EUROPE, 2018 - 2030
- Figure 21:
- VALUE SHARE OF TRADITIONAL ENERGY DRINKS MARKET SPLIT BY PACKAGING TYPE, %, EUROPE, 2023 VS 2030
- Figure 22:
- VOLUME OF OTHER ENERGY DRINKS MARKET, LITRES, EUROPE, 2018 - 2030
- Figure 23:
- VALUE OF OTHER ENERGY DRINKS MARKET, USD, EUROPE, 2018 - 2030
- Figure 24:
- VALUE SHARE OF OTHER ENERGY DRINKS MARKET SPLIT BY PACKAGING TYPE, %, EUROPE, 2023 VS 2030
- Figure 25:
- VOLUME OF ENERGY DRINKS MARKET BY PACKAGING TYPE, LITRES, EUROPE, 2018 - 2030
- Figure 26:
- VALUE OF ENERGY DRINKS MARKET BY PACKAGING TYPE, USD, EUROPE, 2018 - 2030
- Figure 27:
- VALUE SHARE OF ENERGY DRINKS MARKET SPLIT BY PACKAGING TYPE, %, EUROPE, 2018 VS 2024 VS 2030
- Figure 28:
- VOLUME SHARE OF ENERGY DRINKS MARKET SPLIT BY PACKAGING TYPE, %, EUROPE, 2018 VS 2024 VS 2030
- Figure 29:
- VOLUME OF ENERGY DRINKS MARKET SOLD VIA GLASS BOTTLES, LITRES, EUROPE, 2018 - 2030
- Figure 30:
- VALUE OF ENERGY DRINKS MARKET SOLD VIA GLASS BOTTLES, USD, EUROPE, 2018 - 2030
- Figure 31:
- VALUE SHARE OF ENERGY DRINKS MARKET SOLD VIA GLASS BOTTLES, SPLIT BY SOFT DRINK TYPE %, EUROPE, 2023 VS 2030
- Figure 32:
- VOLUME OF ENERGY DRINKS MARKET SOLD VIA METAL CAN, LITRES, EUROPE, 2018 - 2030
- Figure 33:
- VALUE OF ENERGY DRINKS MARKET SOLD VIA METAL CAN, USD, EUROPE, 2018 - 2030
- Figure 34:
- VALUE SHARE OF ENERGY DRINKS MARKET SOLD VIA METAL CAN, SPLIT BY SOFT DRINK TYPE %, EUROPE, 2023 VS 2030
- Figure 35:
- VOLUME OF ENERGY DRINKS MARKET SOLD VIA PET BOTTLES, LITRES, EUROPE, 2018 - 2030
- Figure 36:
- VALUE OF ENERGY DRINKS MARKET SOLD VIA PET BOTTLES, USD, EUROPE, 2018 - 2030
- Figure 37:
- VALUE SHARE OF ENERGY DRINKS MARKET SOLD VIA PET BOTTLES, SPLIT BY SOFT DRINK TYPE %, EUROPE, 2023 VS 2030
- Figure 38:
- VOLUME OF ENERGY DRINKS MARKET BY DISTRIBUTION CHANNEL, LITRES, EUROPE, 2018 - 2030
- Figure 39:
- VALUE OF ENERGY DRINKS MARKET BY DISTRIBUTION CHANNEL, USD, EUROPE, 2018 - 2030
- Figure 40:
- VALUE SHARE OF ENERGY DRINKS MARKET SPLIT BY DISTRIBUTION CHANNEL, %, EUROPE, 2018 VS 2024 VS 2030
- Figure 41:
- VOLUME SHARE OF ENERGY DRINKS MARKET SPLIT BY DISTRIBUTION CHANNEL, %, EUROPE, 2018 VS 2024 VS 2030
- Figure 42:
- VOLUME OF ENERGY DRINKS MARKET SOLD VIA OFF-TRADE CHANNELS, LITRES, EUROPE, 2018 - 2030
- Figure 43:
- VALUE OF ENERGY DRINKS MARKET SOLD VIA OFF-TRADE CHANNELS, USD, EUROPE, 2018 - 2030
- Figure 44:
- VALUE SHARE OF ENERGY DRINKS MARKET SOLD VIA OFF-TRADE CHANNELS, %, EUROPE, 2018 VS 2024 VS 2030
- Figure 45:
- VOLUME SHARE OF ENERGY DRINKS MARKET SOLD VIA OFF-TRADE CHANNELS, %, EUROPE, 2018 VS 2024 VS 2030
- Figure 46:
- VOLUME OF ENERGY DRINKS MARKET SOLD VIA CONVENIENCE STORES, LITRES, EUROPE, 2018 - 2030
- Figure 47:
- VALUE OF ENERGY DRINKS MARKET SOLD VIA CONVENIENCE STORES, USD, EUROPE, 2018 - 2030
- Figure 48:
- VALUE SHARE OF ENERGY DRINKS MARKET SOLD VIA CONVENIENCE STORES SPLIT BY SOFT DRINK TYPE, %, EUROPE, 2023 VS 2030
- Figure 49:
- VOLUME OF ENERGY DRINKS MARKET SOLD VIA ONLINE RETAIL, LITRES, EUROPE, 2018 - 2030
- Figure 50:
- VALUE OF ENERGY DRINKS MARKET SOLD VIA ONLINE RETAIL, USD, EUROPE, 2018 - 2030
- Figure 51:
- VALUE SHARE OF ENERGY DRINKS MARKET SOLD VIA ONLINE RETAIL SPLIT BY SOFT DRINK TYPE, %, EUROPE, 2023 VS 2030
- Figure 52:
- VOLUME OF ENERGY DRINKS MARKET SOLD VIA SUPERMARKET/HYPERMARKET, LITRES, EUROPE, 2018 - 2030
- Figure 53:
- VALUE OF ENERGY DRINKS MARKET SOLD VIA SUPERMARKET/HYPERMARKET, USD, EUROPE, 2018 - 2030
- Figure 54:
- VALUE SHARE OF ENERGY DRINKS MARKET SOLD VIA SUPERMARKET/HYPERMARKET SPLIT BY SOFT DRINK TYPE, %, EUROPE, 2023 VS 2030
- Figure 55:
- VOLUME OF ENERGY DRINKS MARKET SOLD VIA OTHER DISTRIBUTION CHANNEL, LITRES, EUROPE, 2018 - 2030
- Figure 56:
- VALUE OF ENERGY DRINKS MARKET SOLD VIA OTHER DISTRIBUTION CHANNEL, USD, EUROPE, 2018 - 2030
- Figure 57:
- VALUE SHARE OF ENERGY DRINKS MARKET SOLD VIA OTHERS SPLIT BY SOFT DRINK TYPE, %, EUROPE, 2023 VS 2030
- Figure 58:
- VOLUME OF ENERGY DRINKS MARKET SOLD VIA ON-TRADE CHANNEL, LITRES, EUROPE, 2018 - 2030
- Figure 59:
- VALUE OF ENERGY DRINKS MARKET SOLD VIA ON-TRADE CHANNEL, USD, EUROPE, 2018 - 2030
- Figure 60:
- VALUE SHARE OF ENERGY DRINKS MARKET SOLD VIA ON-TRADE CHANNEL, SPLIT BY SOFT DRINK TYPE, %, EUROPE, 2023 VS 2030
- Figure 61:
- VOLUME OF ENERGY DRINKS MARKET BY COUNTRY, LITRES, EUROPE, 2018 - 2030
- Figure 62:
- VALUE OF ENERGY DRINKS MARKET BY COUNTRY, USD, EUROPE, 2018 - 2030
- Figure 63:
- VALUE SHARE OF ENERGY DRINKS MARKET SPLIT BY COUNTRY, %, EUROPE, 2018 VS 2024 VS 2030
- Figure 64:
- VOLUME SHARE OF ENERGY DRINKS MARKET SPLIT BY COUNTRY, %, EUROPE, 2018 VS 2024 VS 2030
- Figure 65:
- VOLUME OF ENERGY DRINKS MARKET, LITRES, BELGIUM, 2018 - 2030
- Figure 66:
- VALUE OF ENERGY DRINKS MARKET, USD, BELGIUM, 2018 - 2030
- Figure 67:
- VALUE SHARE OF ENERGY DRINKS MARKET SPLIT BY SUB DISTRIBUTION CHANNEL, %, BELGIUM, 2023 VS 2030
- Figure 68:
- VOLUME OF ENERGY DRINKS MARKET, LITRES, FRANCE, 2018 - 2030
- Figure 69:
- VALUE OF ENERGY DRINKS MARKET, USD, FRANCE, 2018 - 2030
- Figure 70:
- VALUE SHARE OF ENERGY DRINKS MARKET SPLIT BY SUB DISTRIBUTION CHANNEL, %, FRANCE, 2023 VS 2030
- Figure 71:
- VOLUME OF ENERGY DRINKS MARKET, LITRES, GERMANY, 2018 - 2030
- Figure 72:
- VALUE OF ENERGY DRINKS MARKET, USD, GERMANY, 2018 - 2030
- Figure 73:
- VALUE SHARE OF ENERGY DRINKS MARKET SPLIT BY SUB DISTRIBUTION CHANNEL, %, GERMANY, 2023 VS 2030
- Figure 74:
- VOLUME OF ENERGY DRINKS MARKET, LITRES, ITALY, 2018 - 2030
- Figure 75:
- VALUE OF ENERGY DRINKS MARKET, USD, ITALY, 2018 - 2030
- Figure 76:
- VALUE SHARE OF ENERGY DRINKS MARKET SPLIT BY SUB DISTRIBUTION CHANNEL, %, ITALY, 2023 VS 2030
- Figure 77:
- VOLUME OF ENERGY DRINKS MARKET, LITRES, NETHERLANDS, 2018 - 2030
- Figure 78:
- VALUE OF ENERGY DRINKS MARKET, USD, NETHERLANDS, 2018 - 2030
- Figure 79:
- VALUE SHARE OF ENERGY DRINKS MARKET SPLIT BY SUB DISTRIBUTION CHANNEL, %, NETHERLANDS, 2023 VS 2030
- Figure 80:
- VOLUME OF ENERGY DRINKS MARKET, LITRES, RUSSIA, 2018 - 2030
- Figure 81:
- VALUE OF ENERGY DRINKS MARKET, USD, RUSSIA, 2018 - 2030
- Figure 82:
- VALUE SHARE OF ENERGY DRINKS MARKET SPLIT BY SUB DISTRIBUTION CHANNEL, %, RUSSIA, 2023 VS 2030
- Figure 83:
- VOLUME OF ENERGY DRINKS MARKET, LITRES, SPAIN, 2018 - 2030
- Figure 84:
- VALUE OF ENERGY DRINKS MARKET, USD, SPAIN, 2018 - 2030
- Figure 85:
- VALUE SHARE OF ENERGY DRINKS MARKET SPLIT BY SUB DISTRIBUTION CHANNEL, %, SPAIN, 2023 VS 2030
- Figure 86:
- VOLUME OF ENERGY DRINKS MARKET, LITRES, TURKEY, 2018 - 2030
- Figure 87:
- VALUE OF ENERGY DRINKS MARKET, USD, TURKEY, 2018 - 2030
- Figure 88:
- VALUE SHARE OF ENERGY DRINKS MARKET SPLIT BY SUB DISTRIBUTION CHANNEL, %, TURKEY, 2023 VS 2030
- Figure 89:
- VOLUME OF ENERGY DRINKS MARKET, LITRES, UNITED KINGDOM, 2018 - 2030
- Figure 90:
- VALUE OF ENERGY DRINKS MARKET, USD, UNITED KINGDOM, 2018 - 2030
- Figure 91:
- VALUE SHARE OF ENERGY DRINKS MARKET SPLIT BY SUB DISTRIBUTION CHANNEL, %, UNITED KINGDOM, 2023 VS 2030
- Figure 92:
- VOLUME OF ENERGY DRINKS MARKET, LITRES, REST OF EUROPE, 2018 - 2030
- Figure 93:
- VALUE OF ENERGY DRINKS MARKET, USD, REST OF EUROPE, 2018 - 2030
- Figure 94:
- VALUE SHARE OF ENERGY DRINKS MARKET SPLIT BY SUB DISTRIBUTION CHANNEL, %, REST OF EUROPE, 2023 VS 2030
- Figure 95:
- MOST ACTIVE COMPANIES BY NUMBER OF STRATEGIC MOVES, COUNT, EUROPE, 2020 - 2023
- Figure 96:
- MOST ADOPTED STRATEGIES, COUNT, EUROPE, 2020 - 2023
- Figure 97:
- VALUE SHARE OF MAJOR PLAYERS, %, EUROPE
Europe Energy Drinks Industry Segmentation
Energy Shots, Natural/Organic Energy Drinks, Sugar-free or Low-calories Energy Drinks, Traditional Energy Drinks are covered as segments by Soft Drink Type. Glass Bottles, Metal Can, PET Bottles are covered as segments by Packaging Type. Off-trade, On-trade are covered as segments by Distribution Channel. Belgium, France, Germany, Italy, Netherlands, Russia, Spain, Turkey, United Kingdom are covered as segments by Country.| Soft Drink Type | Energy Shots | ||
| Natural/Organic Energy Drinks | |||
| Sugar-free or Low-calories Energy Drinks | |||
| Traditional Energy Drinks | |||
| Other Energy Drinks | |||
| Packaging Type | Glass Bottles | ||
| Metal Can | |||
| PET Bottles | |||
| Distribution Channel | Off-trade | Convenience Stores | |
| Online Retail | |||
| Supermarket/Hypermarket | |||
| Others | |||
| On-trade | |||
| Country | Belgium | ||
| France | |||
| Germany | |||
| Italy | |||
| Netherlands | |||
| Russia | |||
| Spain | |||
| Turkey | |||
| United Kingdom | |||
| Rest of Europe | |||
Need A Different Region or Segment?
Customize Now
Market Definition
- Carbonated Soft Drinks (CSDs) - Carbonated soft drinks (CSDs) refer to non-alcoholic beverages that are carbonated and typically flavored, containing dissolved carbon dioxide to create effervescence. These beverages commonly include cola, lemon-lime, orange, and various fruit-flavored sodas. Marketed in cans, bottles, or fountain dispense.
- Juices - We have considered packaged juices which encompass non-alcoholic beverages derived from fruits, vegetables, or a combination thereof, processed and sealed in various packaging formats such as bottles, cartons, or pouches. Excluding fresh juices, this market segment involves commercially prepared and preserved juices, often with added preservatives and flavors.
- Ready-to-Drink (RTD) Tea and RTD Coffee - Ready-to-Drink (RTD) tea and RTD coffee are pre-packaged, non-alcoholic beverages that are brewed and prepared for consumption without further dilution. RTD tea typically includes various tea varieties, infused with flavors and sweeteners, and comes in bottles, cans, or cartons. Similarly, RTD coffee involves pre-brewed coffee formulations, often mixed with milk, sugar, or flavorings, and is conveniently packaged for on-the-go consumption.
- Energy Drinks - Energy drinks are non-alcoholic beverages formulated to provide a quick boost of energy and alertness. Whereas, sports drinks are beverages designed to hydrate and replenish electrolytes, particularly after physical exertion, exercise, or intense activity
| Keyword | Definition |
|---|---|
| Carbonated Soft Drinks | Carbonated soft drinks (CSDs) are a combination of carbonated water and flavouring, sweetened by sugar or a non-sugar sweeteners. |
| Standard Cola | Standard Cola is defined as the original flavor of cola soda. |
| Diet Cola | A cola-based soft drink containing no or low amounts of sugar |
| Fruit Flavored Carbonates | A carbonated beverage prepared from fruit juice/fruit flavor with carbonated water and containing sugar, dextrose, invert sugar or liquid glucose either singly or in combination. It may contain peel oil and fruit essences. |
| Juice | Juice is a drink made from the extraction or pressing of the natural liquid contained in fruit and vegetables. |
| 100% Juice | Fruit/vegetable juice made from fruit in the form of its juice with no water added to make up the volume. It is not permitted to add sugars, sweeteners, preservatives, flavourings or colourings to fruit juice. |
| Juice Drinks (up to 24% Juice) | Fruit/vegetable juice drinks with up to 24% fruits/vegetable extract. |
| Nectars (25-99% Juice) | Juices that can have between 25 and 99% of fruit, with the minimum legal limits defined depending on the type of fruit |
| Juice concentrates | Juice Concentrates are those form of juices when most of this liquid is removed resulting in a thick, syrupy product known as juice concentrate. |
| RTD Coffee | Packaged coffee beverages that are sold in a prepared form and are ready for consumption at the time of purchase. |
| Iced Coffee | An iced coffee is a cold version of coffee, usually a combination of hot espresso and milk with ice added to it. |
| Cold Brew Coffee | Cold brew also called cold water extraction or cold pressing is made by steeping ground coffee in room-temperature water for several hours. |
| RTD Tea | Ready-to-drink (RTD) tea is a packaged tea product ready for immediate consumption without brewing or preparation |
| Iced Tea | Ice tea or iced tea is a drink made from tea without milk but with sugar and sometimes fruit flavourings, drunk cold. |
| Green Tea | Green tea is a tea beverage which promotes mental alertness, relieving digestive symptoms and promoting weight loss. |
| Herbal Tea | Herbal tea beverages are made from the infusion or decoction of herbs, spices, or other plant material in hot water. |
| Energy Drink | A type of drink containing stimulant compounds, usually caffeine, which is marketed as providing mental and physical stimulation. They may or may not be carbonated and may also contain sugar, other sweeteners, or herbal extracts, among numerous possible ingredients. |
| Sugar-free or Low-calories Energy Drinks | Sugar-free or Low-calories Energy Drinks are sugar-free, artificially sweetened energy drinks with few or no calories. |
| Traditional Energy Drink | Traditional Energy Drinks are functional soft drinks containing ingredients designed to boost the consumer's energy. |
| Natural/Oraganic Energy Drinks | Natural/Organic energy drinks are energy drinks free of artificial sweeteners and synthetic colorings. Instead, they contain naturally derived ingredients such as green tea, yerba mate, and botanical extracts. |
| Energy Shots | A small but highly concentrated energy drink that contains large amounts of caffeine and/or other stimulants. The quantity is comparatively smaller compared to energy drinks. |
| Sports Drink | Sports drinks are beverages designed specifically for the rapid supply of fluid, carbohydrates, and electrolytes before, during or after exercise. |
| Isotonic | Isotonic drinks contain similar concentrations of salt and sugar as in the human body, and are designed to quickly replace fluids lost during exercise but with an increase of carbohydrate. |
| Hypertonic | Hypertonic drinks have a higher concentration of salt and sugar than the human body. They are best drunk after exercise as it is important to replace glycogen levels quickly after exercise. |
| Hypotonic | Hypotonic drinks are designed to quickly replace fluids lost during exercise. They have very low carbohydrate content and a lower concentration of salt and sugar than the human body. |
| Electrolyte-Enhanced Water | Electrolyte water is water infused with electrically-charged minerals, such as sodium, potassium, calcium, and magnesium. |
| Protein-based Sport Drinks | Protein-based sports drinks are those sports drinks which has added protein in it that will improve performance and reduce muscle protein breakdown. |
| On-Trade | The on-trade refers to places that sell beverages for immediate consumption on the premises like bars, restaurants, and pubs |
| Off-Trade | Off-trade usually means places like liquor stores, supermarkets and other places where you don't consume the beverage right away. |
| Convenience Store | A retail business that provides the public with a convenient location to quickly purchase a wide variety of consumable products and services, generally food and gasoline. |
| Specialty store | A specialty store is a shop/store that carries a deep assortment of brands, styles, or models within a relatively narrow category of goods |
| Online Retail | Online retail is a type of eCommerce whereby a business sells goods or services directly to consumers from a website. |
| Aseptic Packaging | Aseptic packaging refers to the filling of a cold, commercially sterile product under sterile conditions into a presterilized container and closure under sterile conditions to form a seal that effectively excludes microorganisms. These includes tetra packs, cartons, pouches etc. |
| PET Bottle | PET bottle means a bottle made of polyethylene terephthalate. |
| Metal Cans | Metal containers made of aluminum or tin- plated or zinc-plated steel, which are commonly used for packaging food, beverages or other products. |
| Disposable Cups | Disposable Cup means a cup or other container designed for single use to serve beverages, such as water, cold drinks, hot drinks and alcoholic beverages. |
| Gen Z | A way of referring to the group of people who were born in the late 1990s and early 2000s. |
| Millenial | Anyone born between 1981 and 1996 (ages 23 to 38 in 2019) is considered a Millennial |
| Taurine | Taurine is an amino acid that supports immune health and nervous system function. |
| Bars & Pubs | It is a drinking establishment licensed to serve alcoholic drinks for consumption on the premises. |
| Café | It is a foodservice establishment serving refreshments (mainly coffee) and light meals. |
| On the go | It means doing / dealing with while busily engaged with something and not diverting plans in order to accommodate. |
| Internet Penetration | The Internet Penetration Rate corresponds to the percentage of the total population of a given country or region that uses the Internet. |
| Vending Machine | A machine that dispenses small articles such as food, drinks, or cigarettes when a coin or token is inserted |
| Discount store | A discount store or discounter offers a retail format in which products are sold at prices that are in principle lower than an actual or supposed "full retail price". Discounters rely on bulk purchasing and efficient distribution to keep down costs. |
| Clean Label | Clean label on the beverage market are drinks that are made from few ingredients of natural origin and are not or only slightly processed. |
| Caffeine | An alkaloid compound which is a stimulant of the central nervous system. It is mainly used recreationally, as a mild cognitive enhancer to increase alertness and attentional performance. |
| Extreme sport | Action sports, adventure sports or extreme sports are activities perceived as involving a high degree of risk. |
| High-intensity interval training | It incorporates several rounds that alternate between several minutes of high intensity movements to significantly increase the heart rate to at least 80% of one's maximum heart rate, followed by short periods of lower intensity movements. |
| Shelf life | The length of time for which an item remains usable, fit for consumption, or saleable. |
| Cream Soda | Cream soda is a sweet soft drink. Generally flavored with vanilla and based on the taste of an ice cream float |
| Root Beer | Root beer is a sweet North American soft drink traditionally made using the root bark of the sassafras tree Sassafras albidum or the vine of Smilax ornata as the primary flavor. Root beer is typically, but not exclusively, non-alcoholic, caffeine-free, sweet, and carbonated. |
| Vanilla Soda | A carbonated soft drink flavoured with vanilla. |
| Dairy-Free | A product that does not contain any milk or milk products from cows, sheep or goats. |
| Caffeine-Free Energy Drinks | Caffeine-free energy drinks rely on other ingredients to boost the energy. Popular choices include amino acids, B vitamins, and electrolytes. |
Need More Details on Market Definition?
Ask a Question
Research Methodology
Mordor Intelligence follows a four-step methodology in all our reports.
- Step-1: IDENTIFY KEY VARIABLES: In order to build a robust forecasting methodology, the variables and factors identified in Step 1 are tested against available historical market numbers. Through an iterative process, the variables required for market forecast are set, and the model is built on the basis of these variables.
- Step-2: Build a Market Model: Market-size estimations for the forecast years are in nominal terms. Inflation is not a part of the pricing, and the average selling price (ASP) is kept constant throughout the forecast period for each country.
- Step-3: Validate and Finalize: In this important step, all market numbers, variables, and analyst calls are validated through an extensive network of primary research experts from the market studied. The respondents are selected across levels and functions to generate a holistic picture of the market studied.
- Step-4: Research Outputs: Syndicated reports, custom consulting assignments, databases & subscription platforms

Get More Details On Research Methodology
Download PDF


