
Market Overview
| Study Period | 2020 - 2031 |
|---|---|
| Forecast Data Period | 2026 - 2031 |
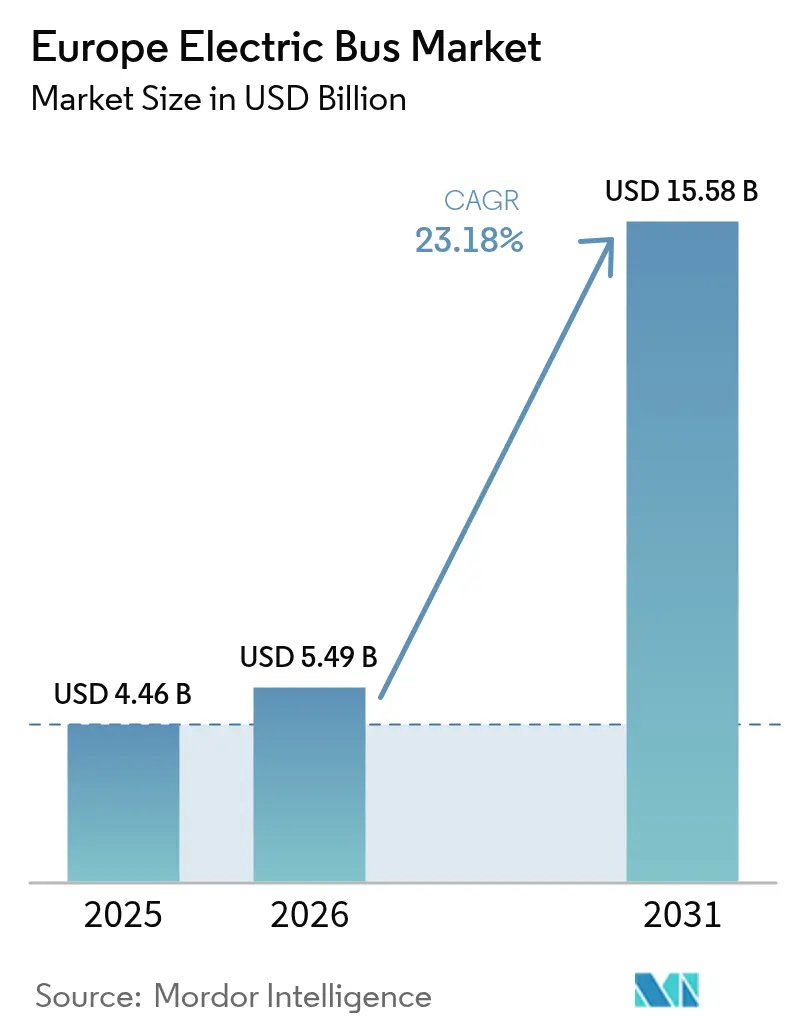
| Base Year Market Size (2025) | USD 4.46 Billion |
| Market Size (2026) | USD 5.49 Billion |
| Market Size (2031) | USD 15.58 Billion |
| Growth Rate (2026 - 2031) | 23.18% CAGR |
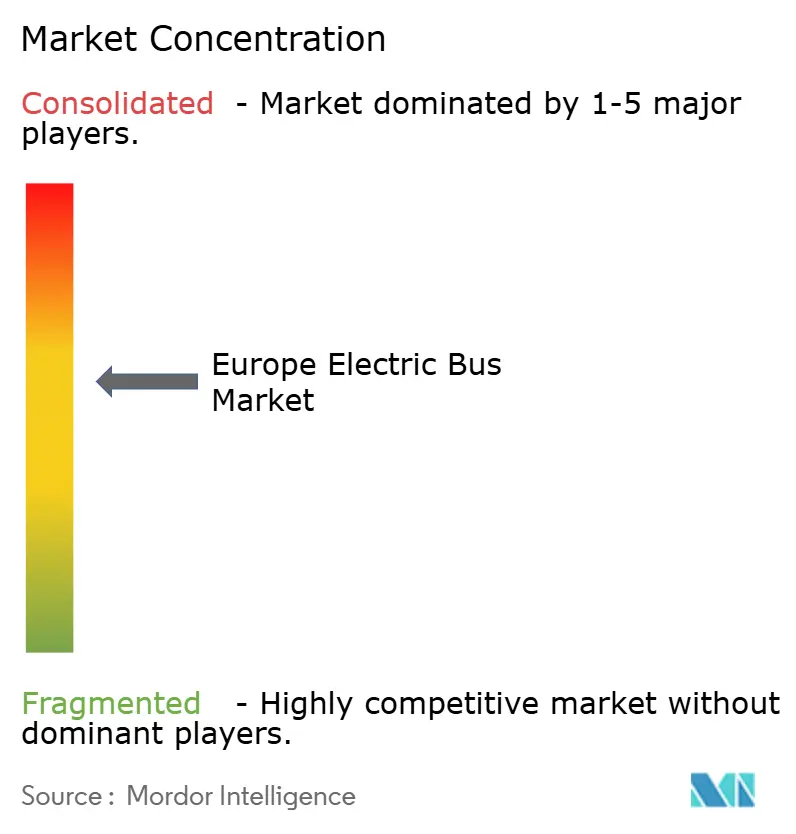
| Market Concentration | Medium |
Major Players *Disclaimer: Major Players sorted in no particular order Image © Mordor Intelligence. Reuse requires attribution under CC BY 4.0. | |
Europe Electric Bus Market Analysis by Mordor Intelligence
The Europe electric bus market size was valued at USD 4.46 billion in 2025 and estimated to grow from USD 5.49 billion in 2026 to reach USD 15.58 billion by 2031, at a CAGR of 23.18% during the forecast period (2026-2031). Aggressive EU-level CO₂ standards, expanding clean-vehicle procurement quotas, and widening gaps in total cost of ownership versus diesel have converged to make battery-electric buses the default option for municipal fleets. Operators increasingly favor electrification because battery prices continue to fall, charging infrastructure is backed by a EUR 1 billion EU funding stream, and ETS-2 carbon pricing is set to raise diesel fuel costs from 2027. The Europe electric bus market, therefore, combines regulatory certainty with improving economics and rising corporate appetite for sustainability branding, reinforcing the investment cycle.
Key Report Takeways
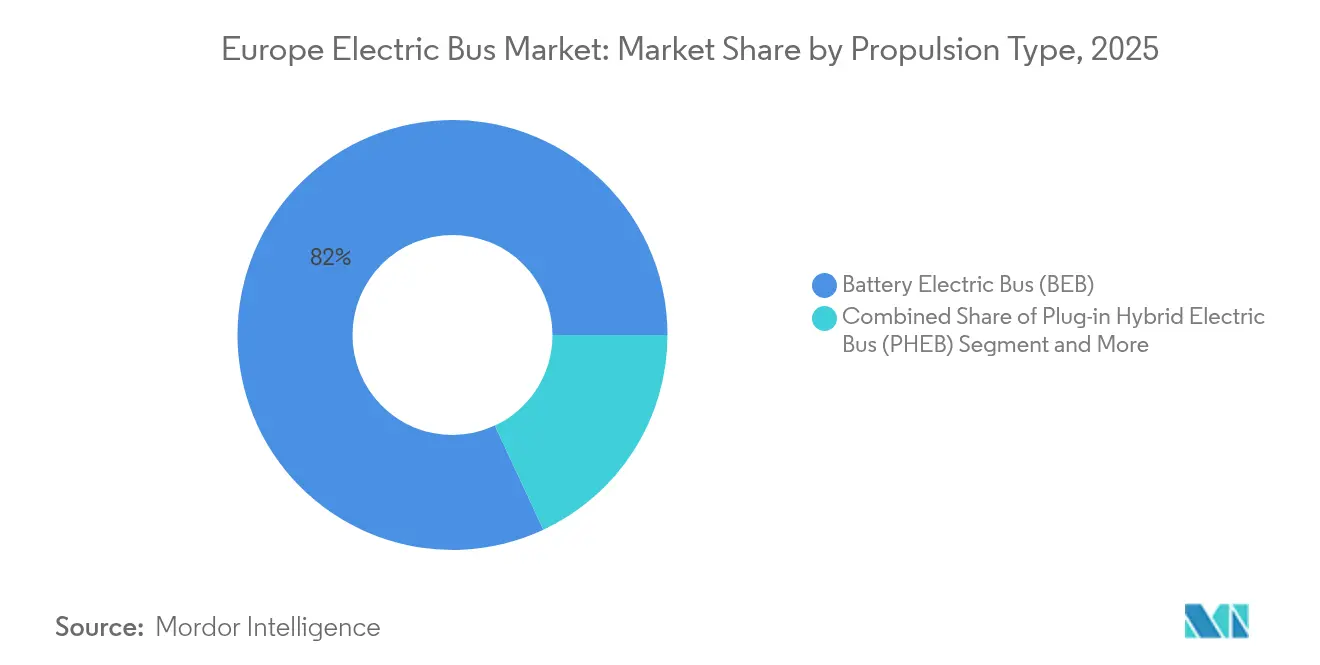
- By propulsion type, battery-electric buses led with 81.95% revenue share in 2025; the segment is also forecast to post the fastest growth at 24.10% CAGR through 2031.
- By battery chemistry, LFP captured 48.75% of the Europe electric bus market share in 2025 and is advancing at 24.60% CAGR through 2031.
- By bus length, 9-14 m standard models commanded 54.85% of the Europe electric bus market size in 2025; articulated and double-decker formats are advancing at 23.95% CAGR through 2031.
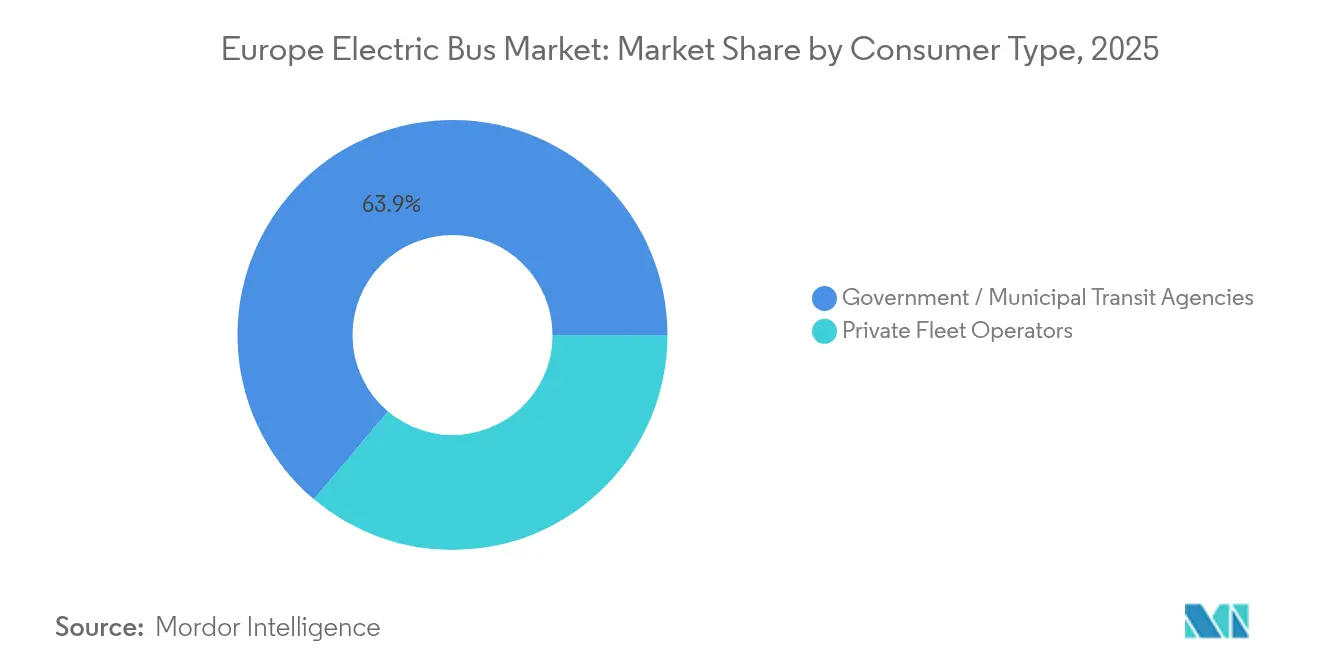
- By consumer type, government and municipal agencies held 63.85% share of the Europe electric bus market size in 2025, whereas private operators recorded the highest projected CAGR at 26.75% to 2031.
- By application, intra-city urban transit accounted for a 67.95% share of the Europe electric bus market size in 2025, while intercity and regional transit is expected to expand at 25.10%.
- By geography, Germany led with 18.35% Europe electric bus market share in 2025; Italy is the fastest-growing national market at 29.90% CAGR through 2031.
Note: Market size and forecast figures in this report are generated using Mordor Intelligence’s proprietary estimation framework, updated with the latest available data and insights as of 2026.
Europe Electric Bus Market Trends and Insights
Drivers Impact Analysis*
| Driver | (~) % Impact on CAGR Forecast | Geographic Relevance | Impact Timeline |
|---|---|---|---|
| Falling Total-Cost-of-Ownership Versus Diesel After 2026 | +6.8% | Led by Netherlands, Nordic countries | Medium term (2-4 years) |
| EU Clean-Vehicles Directive Compliance Deadlines | +4.2% | EU-wide, strongest in Germany, France | Medium term (2-4 years) |
| Battery-as-a-Service Contracts Lowering Capex Risk | +3.9% | Western Europe, expanding to Central Europe | Medium term (2-4 years) |
| National Zero-Emission Public-Procurement Quotas | +3.5% | EU core markets, emerging in Eastern Europe | Short term (≤ 2 years) |
| Escalating EU Carbon-Pricing Under ETS-2 Boosts Diesel Operating Costs | +2.8% | EU-wide implementation from 2027 | Long term (≥ 4 years) |
| On-Site Depot Battery-Storage Shaving Peak-Demand Charges | +2.1% | Germany, Netherlands, UK | Long term (≥ 4 years) |
| Source: Mordor Intelligence | |||
Falling Total Cost of Ownership Versus Diesel After 2026
Battery prices fell sharply in 2024 on wider LFP adoption, cutting pack costs by about 20% compared with NMC. When maintenance savings and ETS-2 carbon charges are added, an electric bus purchased in 2025 is projected to reach TCO parity with a diesel unit within four years of service. Early deployments of the Mercedes-Benz eCitaro in Berlin and Utrecht reveal annual maintenance savings exceeding 30% thanks to fewer drivetrain wear parts. Fleet operators are now standardizing three-shift duty cycles that push electric utilization above 96%, which accelerates payback. Such economics underpin private-sector confidence and explain why venture funding for specialized e-bus operators climbed 18% in 2025 [1]“eCitaro Total Cost Savings Data Sheet,” Daimler Truck AG, daimlertruck.com.
EU Clean-Vehicles Directive Deadlines
Binding procurement targets under the Clean-Vehicles Directive remove uncertainty for city transport agencies, prompting multi-year tenders that bundle vehicle supply and charging solutions. Germany’s Saubere-Fahrzeuge-Beschaffungs-Gesetz lifts required clean-vehicle purchases to 65% for 2026-2030, half of which must be zero-emission. Similar transpositions in France and Spain are clustering demand into large, predictable tranches that let manufacturers optimize production lines and reduce per-unit costs. National flexibility to pool targets across contracting authorities also raises purchasing power, helping smaller cities gain volume discounts. As a result, more than 49% of new EU city buses were already zero-emission in 2024, a share expected to exceed 70% by 2027 [2]“Half of EU City-Bus Sales Were Zero-Emission in 2024,” Transport & Environment, transportenvironment.org.
National Zero-Emission Public-Procurement Quotas
Member states surpassing EU minimums further concentrate demand. The United Kingdom earmarked GBP 500 million to place 1,200 zero-emission buses on the road by 2026, directly stimulating domestic plants in Scarborough and Falkirk. Sweden’s public tenders require operators to reach 95% electric fleets by 2027, compelling firms such as Nobina to secure multi-hundred-unit contracts in advance. Finland channels low-cost debt from the Nordic Investment Bank to bridge municipal funding gaps, accelerating uptake in mid-sized cities. These national quotas create regional hubs of operational knowledge, which then spill into neighboring markets through cross-border operator groups [3]“EUR 13.2 Million Loan for Finnish E-Bus Fleet,” Nordic Investment Bank, nib.int.
On-Site Depot Battery-Storage Shaving Peak-Demand Charges
Transit agencies increasingly treat depots as grid-interactive assets. In Hamburg and Rotterdam, co-located stationary batteries cut demand charges by up to 30% when electric buses fast-charge simultaneously during nightly pull-ins. Smart-charging software staggers plug-in cycles to coincide with renewable power peaks, easing utility strain and unlocking low-tariff windows. Partnerships such as Siemens-OMV provide turnkey energy-management packages that bundle solar PV, battery-storage containers, and megawatt-scale chargers into a single service contract. Revenue stacking through ancillary grid services adds another line item to project cash flow, improving bankability for private financiers.
Restraints Impact Analysis*
| Restraint | (~) % Impact on CAGR Forecast | Geographic Relevance | Impact Timeline |
|---|---|---|---|
| Grid-Connection Bottlenecks at Legacy Depots | -3.8% | Germany, Italy, dense EU urban nodes | Short term (≤ 2 years) |
| Shortage of Certified High-Voltage Technicians | -2.7% | Eastern Europe, emerging in West | Long term (≥ 4 years) |
| Residual-Value Uncertainty for First-Gen Buses | -2.4% | EU-wide leasing markets | Medium term (2-4 years) |
| Potential EU Tariffs on Chinese E-Buses | -1.9% | EU-wide trade policies | Short term (≤ 2 years) |
| Source: Mordor Intelligence | |||
Grid-Connection Bottlenecks at Legacy Depots
Upgrading substations and cabling at sites built for diesel fleets remains slow because utilities face long permitting backlogs. Operators in Milan and Munich report waits of 18 months or more for 2-MW connections, forcing interim reliance on mobile chargers that limit overnight energy intake. The European Commission’s Action Plan for Grids identifies a 60% increase in electricity demand by 2030, yet many city centers have little spare cabling capacity to handle clustered charging. Delays can push back contract start dates and inflate depot conversion budgets, cooling near-term delivery schedules despite healthy order books.
Residual-Value Uncertainty for First-Generation E-Buses
Buses delivered between 2020 and 2023 carry batteries whose capacity and chemistry may fall short of upcoming EU recycled-content rules. Lessors, therefore, struggle to estimate resale values, prompting shorter lease terms and higher residual guarantees that shift risk back to operators. Solaris and Volvo have responded with extended battery warranties, but a secondary-market pricing curve has yet to stabilise. Operators worry that residual-value gaps could widen when long-range, fast-charging second-generation buses dominate auctions after 2027, adding a financing premium to current procurements.
*Our forecasts treat driver/restraint impacts as directional, not additive. The impact forecasts reflect baseline growth, mix effects, and variable interactions.
Segment Analysis
By Propulsion Type: Battery-Electric Becomes the Standard
Battery-electric technology controlled 81.95% of the Europe electric bus market in 2025, driven by regulatory mandates and the maturing supply chain that reduce purchase price gaps. Strong policy backing, simpler drivetrains, and falling battery costs support a 24.10% CAGR for the segment through 2031. Fuel-cell buses remain a strategic hedge for routes exceeding 400 km daily, but scarce hydrogen refueling sites restrict widespread adoption. Plug-in hybrids now serve mostly in transitional contracts where depot upgrades are incomplete.
Manufacturers are standardizing power electronics and thermal-management systems across their electric and hydrogen lines, which lowers development expense. Solaris is executing a 130-unit hydrogen order for Bologna while maintaining battery-electric production at volume, ensuring flexibility if policy signals shift. Because heavy municipal subsidies target zero tailpipe emissions rather than a specific technology, fleet managers continue to pick battery-electric options for near-term compliance and cost reliability, cementing segment leadership for the next five years.


By Battery Chemistry: LFP Extends Lead on Safety and Cost
Lithium-iron-phosphate packs captured 48.75% Europe electric bus market share in 2025 and lead the category with the fastest projected expansion of 24.60% CAGR through 2031, driven by cost advantages and superior thermal stability that resonate with operator safety and economic priorities. The chemistry’s cycle life of 4,000+ charge events helps operators plan for 12-year asset lives without mid-life battery swaps, cutting lifetime capex. Renault’s decision to source LFP modules from CATL’s Hungarian plant illustrates OEM confidence in European supply security. Lithium nickel manganese cobalt oxide remains the chemistry of choice for articulated buses that need high energy density, but rising cobalt prices and ESG scrutiny create headwinds.
Europe electric bus market size gains tied to LFP are reinforced by EU Battery Regulation recycled-content quotas that are easier to meet with iron-based cathodes. Operators in Helsinki and Vienna report battery warranty claims trending lower than early NMC fleets, signaling reduced technical risk. Over the forecast horizon, sodium-ion research may add yet another low-cost chemistry, but commercial scale is unlikely before 2030, leaving LFP dominant.
By Bus Length: Standard Models Anchor Urban Networks
Standard 9-14 m buses held 54.85% of Europe electric bus market size in 2025, reflecting efficient maneuverability in historic city layouts and capacity for 70-90 passengers. Operators appreciate that these vehicles fit existing depot bays and charge within night-shift windows without expensive infrastructure upgrades.
Articulated and double-decker models post the quickest growth, 23.95% CAGR, because they serve dense corridors in London, Copenhagen, and Barcelona. Higher upfront price is offset by greater passenger-kilometers per driver, supporting favourable labor economics. Mini-bus formats under 9 m continue to fill niche airport or rural feeder roles where demand is thin, yet fleet numbers remain modest relative to core city trunks.
By Consumer Type: Private Operators Close the Gap
Government agencies still dominate with a 63.85% share because their procurement cycles align with political climate commitments and grant programs. However, private fleet operators show the strongest momentum, logging 26.75% CAGR to 2031. This trend reflects franchising models in countries such as Sweden, where public authorities set service standards but outsource operations under long-term contracts that reward low emissions.
Large private groups like Arriva and Keolis benefit from multi-country scale and can amortise training and telematics investment over thousands of vehicles. Venture-funded newcomers are also entering premium intercity coach segments, attracted by falling battery costs and route profitability. As financing houses grow comfortable with Battery-as-a-Service structures, private ownership of electric buses is expected to overtake municipal ownership on new registrations after 2029, further diversifying the competitive field.
By Application: Inter-City Services Unlock New Range Potential
Although intra-city urban operations accounted for 67.95% of usage in 2025, while improvements in battery energy density are unlocking inter-city and regional services at a 25.10% CAGR. Daimler’s eIntouro prototype posts a 500 km range, eliminating one mid-route charge stop on many regional lines. National coach operators in Austria and Portugal have begun pilot runs that report 90% lifetime CO₂ savings compared with Euro VI diesels, strengthening investor narratives.
Airport shuttle operators also transition rapidly because predictable timetables simplify charging logistics. Meanwhile, tourism-focused services in southern Italy and the Greek islands evaluate rooftop solar-assisted charging to mitigate grid constraints. By 2030, the share of Europe's electric bus market deployments on inter-city routes is projected to double, indicating significant upside for long-range models.
Geography Analysis
Germany maintained 18.35% of the Europe electric bus market share in 2025, thanks to a federal subsidy that reimburses up to 80% of the cost difference between electric and diesel models. The domestic footprint of Daimler, MAN, and Solaris subsidiaries accelerates local content compliance, encouraging cities such as Hamburg and Berlin to place bulk orders extending to 2030. Public-private partnerships also fund charging depots with surplus capacity that neighboring municipalities can access, spreading infrastructure costs.
Italy is poised for the fastest growth, 29.90% CAGR, under a EUR 50 million incentive scheme backed by EU recovery plans. Fleet expansions in Rome, Milan, and Naples aim to meet looming air-quality deadlines while stimulating domestic body assemblers. Italian transit agencies often select joint procurement frameworks that aggregate demand across provinces, enhancing tender volumes and lowering per-vehicle prices.
The United Kingdom continues to deploy large fleets under its GBP 500 million Zero-Emission Bus Regional Areas program, recording 40% year-on-year growth in 2024. Scotland achieves especially high penetration because island and rural councils value noise reduction and stable electricity pricing. France leverages domestic producers such as Iveco Bus to maintain competitive pricing and secure export contracts in francophone Africa, indirectly strengthening the local supply chain. Nordic countries already run near-saturated electric penetration, yet they continue to pilot emerging technologies such as inductive road charging, ensuring that lessons from extreme-climate operations feed back into continental best practices.
Regulatory Landscape
EU regulation is tightening on both the demand and supply sides. Regulation (EU) 2024/1610, adopted in May 2024, amends the heavy-duty vehicle CO2 standards framework and sets a clear zero-emission trajectory for new urban buses, 90% of new urban buses to be zero-emission by 2030 and 100% by 2035, with manufacturer compliance assessed on fleet-wide average CO2 emissions per reporting year (July 1 to June 30). In parallel, the EU Clean Vehicles Directive (Directive 2009/33/EC as amended by 2019/1161) mandates minimum national procurement targets for clean and zero-emission buses by public authorities and operators.
The Clean Vehicles Directive second reference period runs from January 1, 2026 to December 31, 2030 and raises the minimum procurement thresholds versus the 2021-2025 period, with at least 50% of the required clean-bus target to be met with zero-emission buses. Member States retain flexibility to allocate targets across contracting authorities, which shifts tender timing and volumes by country and city while keeping the national aggregate obligation intact.
Value Chain Analysis
The value chain starts with battery raw materials and cell manufacturing (with LFP supply still heavily Asia-linked) and moves through pack integration, e-axles/inverters, chassis and body manufacturing, and final assembly by OEMs such as Mercedes-Benz, MAN, Volvo, Solaris, BYD, VDL, and Iveco Bus. Projects such as GR4FITE3 illustrate efforts to deepen European inputs, in this case by building a more sustainable lithium-ion battery anode supply chain using natural crystalline flake graphite. Downstream, public transport authorities and large private operators procure buses largely through multi-year tenders, increasingly bundling vehicle supply with depot and opportunity-charging systems and long-term service agreements.
Charging hardware and systems integration (for example, partnerships with ABB, Heliox, Siemens, and similar infrastructure providers) have become core value-capture points alongside financing and lifecycle services, including Battery-as-a-Service structures. Key bottlenecks sit at grid connection and depot conversion, where congestion, permitting timelines, and interoperability issues between buses and chargers can delay fleet rollouts and force interim operating workarounds, shifting attention toward turnkey, performance-backed charging packages and stronger aftersales networks.
Competitive Landscape
The Europe electric bus market displays moderate concentration. Top suppliers include Mercedes-Benz, MAN, Volvo, Solaris, and BYD. Traditional OEMs leverage decades-old dealer networks, which reassure operators about parts availability and residual-value support. Solaris differentiates through early hydrogen expertise, winning mixed-technology tenders that hedge future policy swings.
Chinese entrant BYD continues to build presence through joint ventures that localize assembly, softening potential tariff exposure. Its alliance with Alexander Dennis in the United Kingdom produces double-deckers tailored to tight London clearances, undercutting European rivals on price while meeting local-content rules. Meanwhile, Scania strengthened vertical integration in 2025 by deepening battery cell collaboration with Northvolt, seeking cost and supply security.
Across the European electric bus industry, competitive advantage is shifting from hardware margins to lifecycle services. Mercedes-Benz’s OMNIplus five-year battery warranties bundle telematics, driver training, and energy-management software, thus locking in long-term revenue streams. Volvo and VDL now offer depot-electrification engineering alongside vehicle deliveries, capturing infrastructure spending that may exceed bus cost over a ten-year horizon. Digital fleet-optimization platforms further wedge into value capture, with telematics providers partnering directly with financiers to underwrite performance guarantees.
Europe Electric Bus Industry Leaders
MAN Truck & Bus
Solaris Bus & Coach sp. z o.o.
Volvo Buses
Mercedes-Benz Group AG
BYD Auto Co., Ltd
- *Disclaimer: Major Players sorted in no particular order

Market Opportunities and Future Outlook
A major opportunity sits in the 2026-2030 tender cycle driven by the Clean Vehicles Directive second reference period (January 1, 2026 to December 31, 2030), which raises the minimum national procurement requirements and forces a higher share of zero-emission bus purchases within public contracts. Market activity in 2026 shows this compliance wave translating into operational and procurement actions: Copenhagen completed its transition to an all-electric city bus fleet on March 29, 2026, while MAN reported a 112-unit Lion's City E order for Vilnius public transport operator VVT in May 2026, the largest e-bus procurement recorded in Lithuania.
A second whitespace area is the shift from buses-only procurement to packaged electrification, covering charging infrastructure, maintenance, and financing, which expands the addressable spend beyond the vehicle. This is visible in operator and financier moves such as the up to EUR 120 million framework agreement between Zenobe and Vectalia in Spain (June 2026) for financing/leasing electric buses and charging, and in large-scale operational deployments like the start of a ten-year contract in Vestfold, Norway on July 1, 2026 featuring 235 battery-electric buses. These programs favor OEMs and partners that can deliver integrated depot engineering, interoperability-tested charging ecosystems, and multi-year uptime guarantees in addition to the bus platform.
Recent Industry Developments
- May 2026: MAN Truck & Bus received an order for 112 Lion's City E buses from Vilniaus viešasis transportas (VVT) in Vilnius. The deal is a step-change for Lithuania's zero-emission fleet scale and adds volume to MAN's European backlog, supporting higher utilization across its e-bus industrial footprint.
- February 2026: Volvo Buses secured orders for 15 BZR Electric-CD electric coaches from six customers in Norway, including Jenssen Mobility and Schaus Buss. The orders broaden electrification beyond urban transit into airport shuttle, tourism, and charter duty cycles, reinforcing demand for higher-range coach platforms and related charging solutions.
- May 2025: MAN Truck & Bus premiered the Lion's Coach E with up to 650 km range and 375 kW CCS charging as a series-production electric coach program. The launch expanded the addressable market into intercity and coach applications and increased competitive pressure on OEMs to pair vehicles with high-power charging and uptime-focused service packages.


Research Methodology Framework and Report Scope
Market Definition and Coverage
For this study, the Europe electric bus market is the revenue generated from selling electric buses used for public or private passenger transport across European countries, counted when the bus is delivered and recorded as an electric configuration.
Scope exclusions: We exclude trolleybuses that rely primarily on overhead lines and we do not count depot chargers or grid upgrades as part of this market value.
Segmentation Overview
- By Propulsion Type
- Battery Electric Bus (BEB)
- Plug-in Hybrid Electric Bus (PHEB)
- Fuel-Cell Electric Bus (FCEB)
- By Battery Chemistry
- Lithium-Iron-Phosphate (LFP)
- Lithium Nickel Manganese Cobalt Oxide (NMC)
- Nickel-Metal Hydride (NiMH)
- Others (Sodium-ion, Solid-state)
- By Bus Length
- Less than 9 m
- 9-14 m (Standard)
- Above 14 m (Articulated/Double-decker)
- By Consumer Type
- Government / Municipal Transit Agencies
- Private Fleet Operators
- By Application
- Intra-city Urban Transit
- Inter-city & Regional
- Airport & Shuttle Services
- By Country
- Germany
- United Kingdom
- France
- Italy
- Spain
- Netherlands
- Norway
- Poland
- Sweden
- Finland
- Belgium
- Switzerland
- Rest of Europe
Data Sources, Market Sizing, and Validation
Desk Research
We start by building the market map for Europe and aligning basic terms used in registrations, subsidies, and procurement so the data can be compared country by country. Public sources such as Eurostat, the European Commission mobility and transport updates (including the Clean Vehicles Directive material), national transport ministry releases, and city tender portals are used to understand purchase cycles and funded volumes.
To connect policy and units to dollars, we also review bus registration statistics and fleet updates from sources such as ICCT publications, IEA transport notes, and customs and trade databases where applicable for parts and battery shipments. Company annual reports, investor presentations, and reputable press interviews help validate product mix and typical pricing ranges, while a paid subscription for company financials and news is used selectively to cross-check revenue exposure and delivery timing. The sources listed here are illustrative only, and many other public documents were also referred to for data collection, validation, and research clarification.
Primary Interviews and Surveys
Primary work is used to pressure-test the desk assumptions that move the model, especially ASP ranges, delivery cadence, and what is counted as a qualifying electric bus in large tenders. We speak with stakeholders across OEM and supply chain roles, public transport authorities, and fleet operators across APAC, EMEA, and the Americas to sense-check technology mix (battery-electric, plug-in hybrid, and fuel cell) and to confirm how contracts translate into recognized market value.
Distribution of primary research fieldwork respondents
| Company type | Respondent position | Region |
|---|---|---|
| Top tier: 31% | CXOs: 15% | |
| Mid tier: 53% | Functional/Unit leaders: 38% | |
| Smaller Players: 16% | Managers: 47% |
Market-Sizing & Forecasting
Sizing is built using a top-down approach where country-level demand is reconstructed from electric bus registrations, public procurement awards, and fleet replacement cycles, and then converted into revenue using modeled ASP ranges by propulsion type. Once the first pass total is ready, we corroborate it with selective bottom-up checks, such as sampling delivered unit counts from large tenders and cross-checking implied revenue against supplier exposure and announced delivery schedules.
A few inputs carry most of the weight in this market, so we keep them explicit and reviewable. These include annual electric bus deliveries by country, the share split across battery-electric, plug-in hybrid, and fuel cell buses, typical contract ASP bands (which differ by bus length and battery size), subsidy intensity and timing, and depot readiness constraints that can shift deliveries across quarters. Where direct price points are missing, gaps are handled by using a bounded ASP range informed by interviews and then tested against procurement documents and import price signals.
For forecasting, scenario analysis is used so the model can reflect the reality of stop start tender cycles and policy shifts. The scenarios are anchored on expected tender pipelines, battery cost direction, and municipal zero-emission targets, and then adjusted using expert views on whether deliveries pull forward or slip due to supply chain or charging readiness.
Data Validation & Update Cycle
We validate the outputs by comparing them against independent signals, such as tender award totals, registration time series, and known fleet conversion programs, and then the biggest variances are reworked until the driver is clearly understood. Outliers at the country level are flagged, checked for one-off bulk orders or accounting timing, and then reviewed again during internal analyst sign-off.
The report is refreshed annually, and interim updates are made when a material policy change, large tender wave, or supply disruption is likely to shift the demand curve. Before delivery, an analyst performs a fresh pass on key inputs so clients receive the latest updated view, rather than a number that is correct only for an older cut of the market.
Mordor Intelligence's Europe Electric Bus Market Size Measured Against Other Published Estimates
Published market values for electric buses in Europe can look far apart because the scope is not consistent, even before assumptions like pricing and timing are considered. Some sources focus only on city buses above a weight threshold, while others add adjacent electrified types or use different rules for when revenue is counted.
The biggest drivers are what propulsion types are included, how hybrid configurations are treated, and whether Russia and the UK are inside the geography. The main gap comes from counting plug-in hybrid buses as part of the electric bus pool, where Mordor Intelligence includes Plug-in Hybrid Electric Bus values alongside battery-electric and fuel cell buses, which can push totals above studies that restrict the scope to zero-emission only.
Benchmark comparison
| Source | Market Size | Gaps in Research Methodology |
|---|---|---|
| Mordor Intelligence | USD 4.46 B (2025) | |
| Regional Consultancy A | USD 1.49 B (2021) | Uses an earlier base year and a different adoption stage, and the value can be built from a narrower procurement pipeline and older ASP bands that do not reflect recent inflation in battery packs and bus pricing. |
| Industry Publisher B | USD 5.88 B (2028) | Leans heavily on forward projections to 2028, and results can shift based on aggressive tender conversion assumptions and how hybrid electric buses are mixed into the revenue pool versus being separated. |
Taken together, the spread in published figures is mostly explained by the year chosen and what is counted as an electric bus, followed by the ASP and delivery timing logic. Our approach keeps the steps traceable to registrations, tender awards, and propulsion mix, which makes the final number easier to reproduce and update when new procurement data arrives.


Key Questions Answered in the Report
What is the current Europe electric bus market size?
The Europe electric bus market size stands at USD 5.49 billion in 2026 and is projected to grow to USD 15.58 billion by 2031.
How fast is the Europe electric bus market expected to grow?
The market is forecast to expand at a 23.18% CAGR between 2026 and 2031, underpinned by strict EU clean-transport mandates and falling battery costs.
Which propulsion technology dominates European deployments?
Battery-electric buses dominate 81.95% of new registrations, thanks to mature charging networks and superior total cost of ownership.
Which country is the largest market for electric buses in Europe?
Germany leads with an 18.35% share due to generous federal subsidies and strong domestic manufacturing capacity.
Page last updated on:


