Europe Electric Bus Battery Pack Market Size and Share
Market Overview
| Study Period | 2019 - 2030 |
|---|---|
| Base Year For Estimation | 2024 |
| Forecast Data Period | 2025 - 2030 |
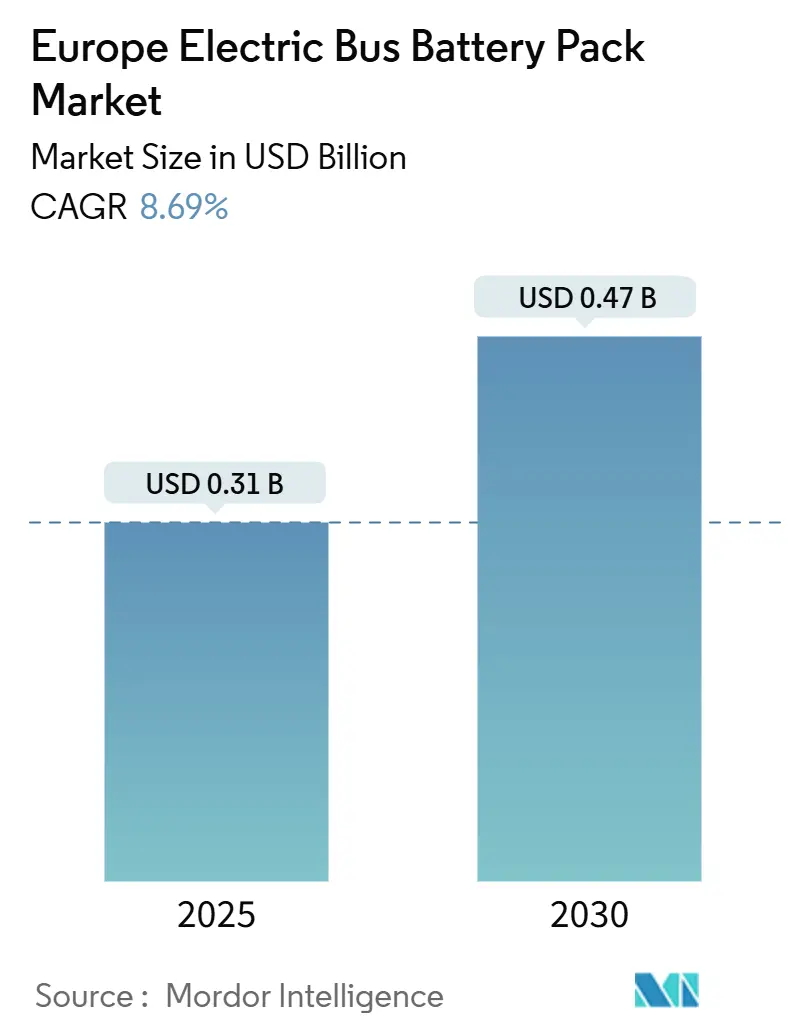
| Market Size (2025) | USD 0.31 Billion |
| Market Size (2030) | USD 0.47 Billion |
| Growth Rate (2025 - 2030) | 8.69% CAGR |
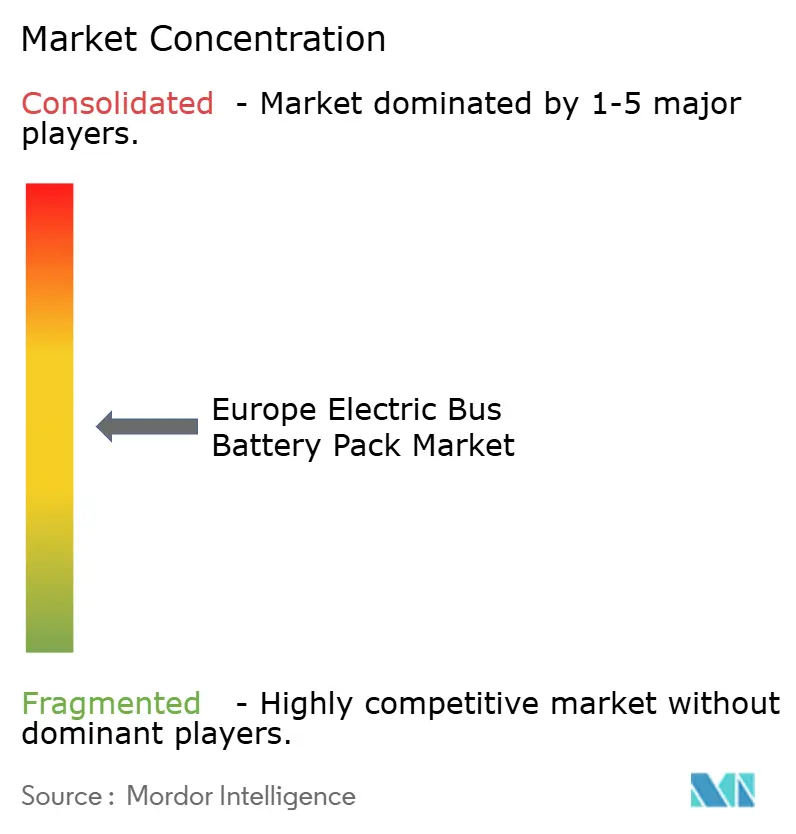
| Market Concentration | Medium |
Major Players
*Disclaimer: Major Players sorted in no particular order Image © Mordor Intelligence. Reuse requires attribution under CC BY 4.0. |
|
Europe Electric Bus Battery Pack Market Analysis by Mordor Intelligence
The Europe electric bus battery pack market size stands at USD 0.31 billion in 2025 and is forecast to reach USD 0.47 billion by 2030, translating into an 8.69% CAGR over the period. The Europe electric bus battery pack market is expanding because EU regulations force a rapid pivot from diesel fleets to zero-emission public transport, battery costs are falling at significant rates, and depot charging networks deliver higher power levels. Battery-electric buses surpassed diesel for the first time in 2023 by capturing 36% of new city bus sales, confirming clear demand momentum [1]“Record year for e-buses,” Transport & Environment, transportenvironment.org. Poland dominates the Europe electric bus battery pack market, while Hungary posts the fastest growth at a notable CAGR on the back of notable battery investments. Suppliers compete on chemistry breakthroughs such as LMFP, on Cell-to-Pack architecture, and on localized production that satisfies rising local-content tender rules.
Key Report Takeaways
- By type, standard (12-meter) buses led with 48.15% of the Europe electric bus battery pack market share in 2024, while articulated (18-meter) buses are projected to expand at an 11.26% CAGR to 2030.
- By propulsion type, BEV accounted for 99.97% share in 2024, while PHEV segment is projected to expand at an 16.55% CAGR to 2030.
- By battery chemistry, LFP accounted for 49.13% share of the Europe electric bus battery pack market size in 2024 and LMFP is advancing at a 12.04% CAGR through 2030.
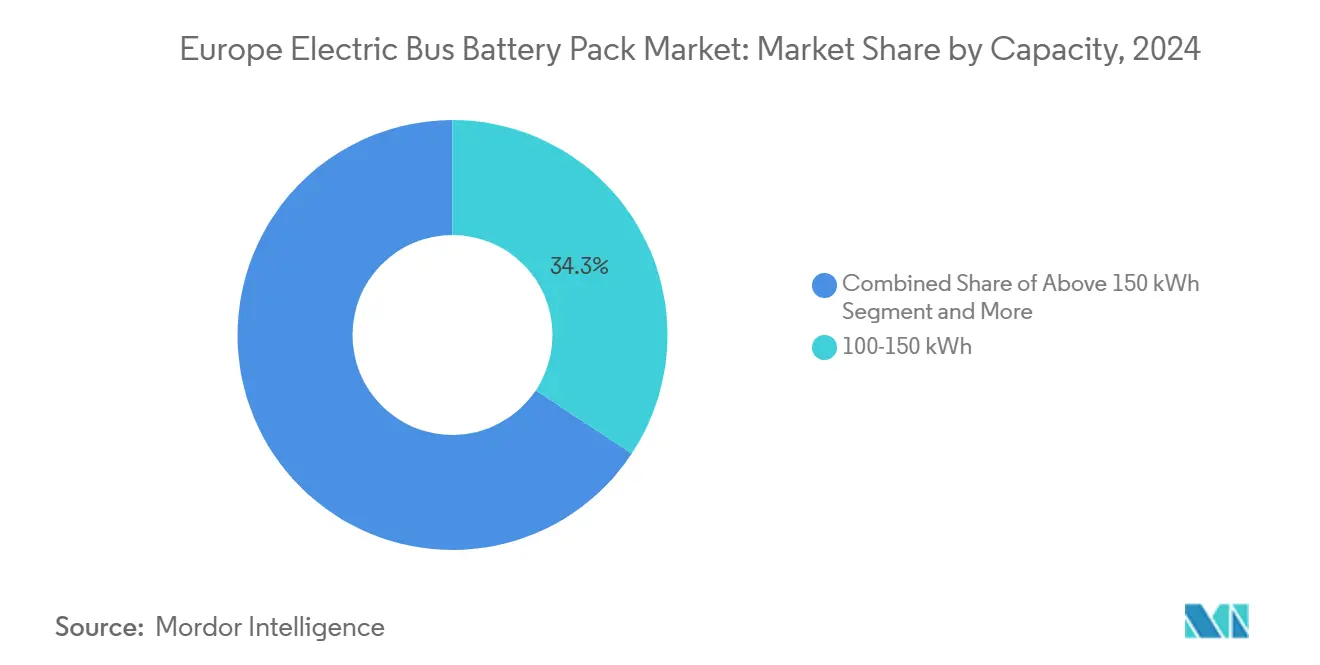
- By capacity, 100-150 kWh accounted for 34.26% share in 2024, while above 150 kWh models will witness fastest CAGR of 10.46% by 2030.
- By battery form, pouch models held 56.28% share in 2024, whereas cylindrical packs will expand at a 13.28% CAGR through 2030.
- By voltage class, 400-600 V rated battery packs accounted for 58.05% share in 2024, while the above 800 V segment is set to expand at a 9.58% CAGR by 2030.
- By module architecture, cell-to-pack captured 53.18% of the Europe electric bus battery pack market size in 2024 and continues to lead with a 10.13% CAGR forecast to 2030.
- By component, cathode accounted for 69.05% share in 2024, while separators are set to expand at a 9.16% CAGR through 2030.
- By country, Poland held 59.40% of the Europe electric bus battery pack market share in 2024, whereas Hungary records the highest projected CAGR at 42.37% through 2030.
Europe Electric Bus Battery Pack Market Trends and Insights
Drivers Impact Analysis
| Driver | (~) % Impact on CAGR Forecast | Geographic Relevance | Impact Timeline |
|---|---|---|---|
| EU Zero-emission Targets | +2.1% | EU-wide, strongest in Germany, France, Netherlands | Medium term (2-4 years) |
| LFP and NMC Decline | +1.8% | Cost-sensitive Eastern Europe | Short term (≤ 2 years) |
| Ultra-fast Depot Charging Expansion | +1.5% | Urban centers across EU | Medium term (2-4 years) |
| Low-emission-zone Bus Demand | +1.2% | Major Western European cities | Short term (≤ 2 years) |
| Commercialization of LMFP Chemistry | +0.9% | Hungary, Poland, Germany | Long term (≥ 4 years) |
| Local Content Tendering Scores | +0.7% | Member states with domestic capacity | Medium term (2-4 years) |
| Source: Mordor Intelligence | |||
Strict EU Zero-Emission Public-Transport Targets
The Clean Vehicles Directive obliges member states to ensure that a significant share of new bus procurements are zero-emission by 2030, creating a significant order pipeline and cementing the Europe electric bus battery pack market as a critical supplier base. Germany has a significant number of electric buses in operation, while France is making substantial annual investments to support their adoption through 2027. Euro 7 engine limits take effect in 2027 and remove the diesel fallback option, so operators accelerate tenders to comply with the hard deadline. The directive’s biannual compliance audits pressure cities to publish progress reports, generating visibility that guides supplier production schedules. Heavy-Duty Vehicle CO2 rules deepen the policy signal by requiring significant emission cuts, locking diesel out of long-term fleet plans.
Rapid Decline in LFP and NMC Pack USD/kWh
In 2024, battery pack costs significantly declined, with LFP and NMC prices decreasing due to the substantial increase in China's annual production capacity. By late 2024, lithium carbonate prices experienced a significant decline compared to early 2023, substantially reducing raw material costs. A 7-year payback versus diesel is now typical, down from 12 years, supported by operating savings. Pack prices are projected to fall further by 2027 as next-generation LFP hits 200 Wh/kg. Eastern European operators, who previously delayed adoption, now schedule full-electric renewals because the capital premium narrows sharply.
Expansion of Ultra-Fast Depot Charging Infrastructure
Depot charging above 350 kW spreads quickly, enabling 15-minute turnaround that supports 300 km daily duty cycles without mid-route stops. Madrid’s Valdebebas depot runs 64 chargers at 450 kW and sustains 200 buses with 95% uptime. AFIR commits to place high-power chargers every 60 km along TEN-T corridors by 2026.Germany has established numerous charging points across several depots, while Sweden is testing advanced pantographs capable of rapid charging within minutes. The result is smaller average pack sizes without range anxiety, which cuts vehicle weight and reduces pack demand per bus but boosts sales volume as fleets electrify faster.
Low-Emission-Zone Policies Boosting Mini/Midi Bus Demand
Low-emission zones cover several cities and restrict entry for non-zero-emission vehicles. Italy leads significantly in the number of zones, followed by Germany, making short 8-10.5 m buses more attractive for narrow medieval streets. These vehicles enjoy higher utilization than 12 m models because they can run flexible routes. Battery packs sized 40-80 kWh suit frequent stop-and-go trips where regenerative braking can recover significant energy. Mini and midi categories are growing rapidly, therefore expanding the customer base for right-sized packs.
Restraints Impact Analysis
| Restraint | (~) % Impact on CAGR Forecast | Geographic Relevance | Impact Timeline |
|---|---|---|---|
| High CAPEX Vs Diesel | -1.4% | Cost-sensitive Eastern Europe | Short term (≤ 2 years) |
| Scarcity of 600V+ Drivetrain | -0.8% | High-capacity urban routes | Medium term (2-4 years) |
| Nickel and Lithium Price Volatility | -0.6% | All European markets | Short term (≤ 2 years) |
| Fire-safety Norms for Second-life Packs | -0.4% | EU-wide | Long term (≥ 4 years) |
| Source: Mordor Intelligence | |||
High Upfront CAPEX vs. Diesel Alternatives
Electric buses are significantly more expensive than their diesel counterparts, primarily due to the high cost of the battery pack, which constitutes a substantial portion of the total cost. While the potential for lifetime savings is appealing, smaller cities with limited procurement budgets find it difficult to manage the higher upfront costs. In Poland, EU cohesion funds cover a significant portion of the deals, yet operators in Eastern Europe often wait for grants before committing to purchases. Although the cost gap has narrowed due to decreasing battery prices, the high initial investment remains a challenge, particularly for smaller fleets.
Scarcity of 600 V+ Drivetrain for Articulated Buses
Several European suppliers provide the high-voltage systems required for an 18 m bus to deliver continuous power. Lead times for these systems are significantly longer compared to smaller models. Additionally, bespoke engineering has resulted in notable cost premiums. Cities such as Berlin and Paris rely heavily on articulated fleets, so the shortage delays their electrification targets.
Segment Analysis
By Type: Articulated Growth Drives Infrastructure Optimization
The Europe electric bus battery pack market size for standard 12-m buses remains the largest, backed by a 48.15% 2024 share. However, articulated 18-m models grow fastest at an 11.26% CAGR because one long vehicle can move more passengers while using extra depot space. CATL’s modular 50 kWh units simplify pack scaling to 200 kWh without new tooling. Depot planners prefer overnight charging for articulated fleets, which avoids peak-tariff daytime electricity.
Fleet operators also rely on articulated buses to meet EU zero-emission targets, measured in passenger-kilometers rather than vehicle counts. Cities can therefore retire two diesel buses and buy one large BEV to meet the quota. The European electric bus battery pack market gains volume as bigger packs lift kWh demand per vehicle, even if unit counts rise modestly. Mini and midi buses fill tight historic centers, where 8-10.5m lengths navigate narrow lanes.

Note: Segment shares of all individual segments available upon report purchase
By Propulsion Type: BEV Dominance with PHEV Niche Growth
Battery Electric Vehicles held 99.97% share in 2024 as urban duty cycles match depot charging rhythms. The tiny PHEV niche posts a 16.55% CAGR to 2030 for rural Nordic routes that need heaters and 400 km range in harsh winters. Volvo and Scania lead with 80 km electric-only hybrids that flip to diesel on remote stretches.
Pure BEVs capture total cost advantages from regenerative energy recovery and simpler drivetrains. The Europe electric bus battery pack market benefits because every fully-electric bus demands a pack whereas PHEVs need smaller batteries. Nonetheless, PHEVs open incremental sales in geographies without charging corridors.
By Battery Chemistry: LMFP Emerges as Performance Leader
LFP secured 49.13% Europe electric bus battery pack market share in 2024, thanks to thermal stability and low cost. LMFP now climbs at 12.04% CAGR, raising energy density while keeping stable iron-phosphate safety. CATL Qilin 3.0 at 230 Wh/kg gives a 400 km city-bus range without added pack weight and passes stringent thermal-runaway tests.
LMFP adoption accelerates as manganese prices remain stable, while nickel prices continue to fluctuate. Municipal buyers favor chemistry that delivers predictable tender budgets. NMC and NCA linger in premium long-range or winter-duty use cases but face margin squeeze as LMFP scales.
By Capacity: High-Capacity Packs Drive Range Optimization
The 100-150 kWh bracket dominates with a 34.26% share in 2024, supplying 12-m buses with a daily range of 250-300 km. Packs above 150 kWh grow at 10.46% CAGR as articulated fleets and intercity services adopt overnight depot charging. The Europe electric bus battery pack market size for high-capacity systems rises because depot upgrades now accommodate 800 kW pantographs that refill 200 kWh packs in 15 minutes.
Lower capacity 40-80 kWh modules fit mini and midi buses operating short loops inside low-emission zones. Operators tailor pack size to avoid carrying unused weight, an approach facilitated by modular designs.
Note: Segment shares of all individual segments available upon report purchase
By Battery Form: Pouch Cells Lead with Cylindrical Growth
Pouch cells held a 56.28% share in 2024 since they maximize volumetric energy density within a bus chassis. Cylinder formats grow at a 13.28% CAGR, driven by the spread of 4680 dimensions that improve thermal paths and simplify cooling. Prismatic cells serve niche ruggedization needs [2]“Pouch and Cylindrical Cell Roadmap,” Samsung SDI, samsungsdi.com.
Pouch leadership persists because European OEMs value the flexibility of flat-pack design, which preserves low interior floor height. However, the Europe electric bus battery pack market sees rising cylinder demand as standardized lines cut costs and increase supply chain resilience.
By Voltage Class: High-Voltage Architecture Gains Momentum
Systems rated 400-600 V command a 58.05% share in 2024. Above-800 V setups expand 9.58% CAGR by enabling 350 kW-plus charging with lighter cabling. Berlin and Stockholm order articulated fleets with high-voltage battery capacity, which reduces cable cross-section and cuts curb weight.
Component shortages remain, though. Only premium inverter and DC-DC suppliers offer complete 800 V portfolios today, so costs remain higher than those of 400 V kits. As volumes grow, the Europe electric bus battery pack industry expects parity in the coming years.
By Module Architecture: Cell-to-Pack Dominates Innovation
Cell-to-Pack (CTP) accounted for a 53.18% share in 2024 and rose at a 10.13% CAGR by removing module housings, trimming weight, and boosting energy density. Pack builders report fewer parts and significant cost savings.
Cell-to-Module (CTM) persists for legacy lines needing module-level servicing or mixed-chemistry formats. Module-to-Pack (MTP) bridges the transition. CTP gains traction because structural batteries can be integrated as floor beams, freeing up interior space for passengers.

Note: Segment shares of all individual segments available upon report purchase
By Component: Cathode Materials Drive Performance Evolution
The cathode active material captured 69.05% of the component value in 2024, as chemistry choices set both cost and safety. Separators grew at the fastest rate of 9.16% CAGR due to ceramic coatings that tolerate higher voltages and improve shutdown response. Anodes transition gradually from graphite to silicon blends, increasing capacity with minimal process adjustments.
Suppliers co-locate cathode and cell plants to maintain the transport of hazardous powders within a single customs regime, aligning with local-content rules and shortening supply chains.
Geography Analysis
Poland led the Europe electric bus battery pack market with a 59.40% 2024 share. Solaris pairs local bus assembly with LG Energy Solution packs and secures EU cohesion funding that covers project costs, thereby lowering delivered prices compared to imports. Domestic battery lines feed both Polish tenders and exports to Czechia and Slovakia, deepening economies of scale.
Hungary is the fastest-growing geography at a 42.37% CAGR through 2030. CATL’s 100 GWh project anchors a burgeoning cluster that enjoys a significant corporate tax cut for investments. Tender rules give bonuses to packs built in the country, guaranteeing offtake for new capacity. Hungary’s central location shortens logistics routes to German OEMs, which in turn further boosts demand.
Germany, France, Italy, the United Kingdom, and Sweden form a mature band of adopters. Germany has a well-established network of electric buses and high-power depot chargers in operation. France is allocating considerable funding over the coming years to advance zero-emission buses. Italy is expanding low-emission zones that force fleets to accelerate their purchases, and Sweden is piloting 800 kW charging that reduces pack size needs. The Rest of Europe, mainly Romania, Czechia, and Slovenia, taps structural funds to co-finance purchases, injecting steady incremental volume into the Europe electric bus battery pack market.
Competitive Landscape
The Europe electric bus battery pack market shows moderate concentration. CATL and BYD still hold technological leadership with LMFP chemistry and Cell-to-Pack, yet European rivals are gaining ground through local plants that meet Buy European scoring. LG Energy Solution and Samsung SDI assemble modules in Poland and Hungary, partnering with Solaris and Mercedes-Benz to lock multi-year contracts.
Strategic moves center on localization and vertical integration. CATL’s Debrecen facility commits to 100 GWh of output and collaborates with neighboring OEMs on R&D to tailor pack layouts. BYD opened a United Kingdom service center that handles pack diagnostics and warranty claims locally, removing a key operator concern over downtime [3]“UK Battery Service Center,” BYD, byd.com. Northvolt advances closed-loop recycling and battery-as-a-service offerings that incorporate residual values into lease payments, enhancing affordability for mid-sized cities.
White-space opportunities include 800 V+ drivetrains for articulated buses, ceramic-coated separators that unlock higher voltage, and second-life pack safety certification. Suppliers that bundle finance, charging, and residual-value guarantees differentiate themselves in tenders that score the total project cost rather than the sticker price. The EU Battery Regulation’s local-content rule raises barriers for import-only models and intensifies regional build-up of supply chains.
Europe Electric Bus Battery Pack Industry Leaders
-
Contemporary Amperex Technology Co., Limited (CATL)
-
LG Energy Solution, Ltd.
-
BYD Company Ltd.
-
SK Innovation Co., Ltd. (SK On)
-
BMZ Holding GmbH
- *Disclaimer: Major Players sorted in no particular order
Recent Industry Developments
- October 2025: VinFast unveiled EB 8 and EB 12 electric buses at Busworld Europe with 422 kWh LFP packs and real-world 400 km range. With fast charging at 140 kW, these batteries enable full turnaround in three hours.
- October 2025: BYD opened an OEM-operated battery service center in the United Kingdom to deliver localized after-sales support and reassure operators of quick pack maintenance.
Europe Electric Bus Battery Pack Market Report Scope
BEV, PHEV are covered as segments by Propulsion Type. LFP, NCA, NCM, NMC, Others are covered as segments by Battery Chemistry. 15 kWh to 40 kWh, 40 kWh to 80 kWh, Above 80 kWh, Less than 15 kWh are covered as segments by Capacity. Cylindrical, Pouch, Prismatic are covered as segments by Battery Form. Laser, Wire are covered as segments by Method. Anode, Cathode, Electrolyte, Separator are covered as segments by Component. Cobalt, Lithium, Manganese, Natural Graphite, Nickel are covered as segments by Material Type. France, Germany, Hungary, Italy, Poland, Sweden, UK, Rest-of-Europe are covered as segments by Country.| Mini / Microbus (Below 8 m) |
| Midi (8-10.5 m) |
| Standard (12 m) |
| Articulated (18 m) |
| Battery Electric Vehicle (BEV) |
| Plug-in Electric Vehicle (PHEV) |
| LFP (Lithium Iron Phosphate) |
| LMFP (Lithium Manganese Iron Phosphate) |
| NMC (Lithium Nickel Manganese Cobalt Oxide) |
| NCA (Lithium Nickel Cobalt Aluminum Oxide) |
| LTO (Lithium-Titanium-Oxide) |
| Others (LCO, LMO, NMX, Emerging Battery Technologies, etc.) |
| Below 15 kWh |
| 15-40 kWh |
| 40-60 kWh |
| 60-80 kWh |
| 80-100 kWh |
| 100-150 kWh |
| Above 150 kWh |
| Cylindrical |
| Pouch |
| Prismatic |
| Below 400 V |
| 400-600 V |
| 600-800 V |
| Above 800 V |
| Cell-to-Module (CTM) |
| Cell-to-Pack (CTP) |
| Module-to-Pack (MTP) |
| Anode |
| Cathode |
| Electrolyte |
| Separator |
| France |
| Germany |
| Hungary |
| Italy |
| Poland |
| Sweden |
| United Kingdom |
| Rest of Europe |
| By Type | Mini / Microbus (Below 8 m) |
| Midi (8-10.5 m) | |
| Standard (12 m) | |
| Articulated (18 m) | |
| By Propulsion Type | Battery Electric Vehicle (BEV) |
| Plug-in Electric Vehicle (PHEV) | |
| By Battery Chemistry | LFP (Lithium Iron Phosphate) |
| LMFP (Lithium Manganese Iron Phosphate) | |
| NMC (Lithium Nickel Manganese Cobalt Oxide) | |
| NCA (Lithium Nickel Cobalt Aluminum Oxide) | |
| LTO (Lithium-Titanium-Oxide) | |
| Others (LCO, LMO, NMX, Emerging Battery Technologies, etc.) | |
| By Capacity | Below 15 kWh |
| 15-40 kWh | |
| 40-60 kWh | |
| 60-80 kWh | |
| 80-100 kWh | |
| 100-150 kWh | |
| Above 150 kWh | |
| By Battery Form | Cylindrical |
| Pouch | |
| Prismatic | |
| By Voltage Class | Below 400 V |
| 400-600 V | |
| 600-800 V | |
| Above 800 V | |
| By Module Architecture | Cell-to-Module (CTM) |
| Cell-to-Pack (CTP) | |
| Module-to-Pack (MTP) | |
| By Component | Anode |
| Cathode | |
| Electrolyte | |
| Separator | |
| By Country | France |
| Germany | |
| Hungary | |
| Italy | |
| Poland | |
| Sweden | |
| United Kingdom | |
| Rest of Europe |
Market Definition
- Battery Chemistry - Various types of battery chemistry considred under this segment include LFP, NCA, NCM, NMC, Others.
- Battery Form - The types of battery forms offered under this segment include Cylindrical, Pouch and Prismatic.
- Body Type - Body types considered under this segment include is variety of buses.
- Capacity - Various types of battery capacities inldude under theis segment are 15 kWH to 40 kWH, 40 kWh to 80 kWh, Above 80 kWh and Less than 15 kWh.
- Component - Various components covered under this segment include anode, cathode, electrolyte, separator.
- Material Type - Various material covered under this segment include cobalt, lithium, manganese, natural graphite, nickel, other material.
- Method - The types of method covered under this segment include laser and wire.
- Propulsion Type - Propulsion types considered under this segment include BEV (Battery electric vehicles), PHEV (plug-in hybrid electric vehicle).
- ToC Type - ToC 3
- Vehicle Type - Vehicle type considered under this segment include commercial vehicles with various EV powertrains.
| Keyword | Definition |
|---|---|
| Electric vehicle (EV) | A vehicle which uses one or more electric motors for propulsion. Includes cars, buses, and trucks. This term includes all-electric vehicles or battery electric vehicles and plug-in hybrid electric vehicles. |
| PEV | A plug-in electric vehicle is an electric vehicle that can be externally charged and generally includes all electric vehicles as well as plug-electric vehicles as well as plug-in hybrids. |
| Battery-as-a-Service | A business model in which the battery of an EV can be rented from a service provider or swapped with another battery when it runs out of charge |
| Battery Cell | The basic unit of an electric vehicle's battery pack, typically a lithium-ion cell, that stores electrical energy. |
| Module | A subsection of an EV battery pack, consisting of several cells grouped together, often used to facilitate manufacturing and maintenance. |
| Battery Management System (BMS) | An electronic system that manages a rechargeable battery by protecting the battery from operating outside its safe operating area, monitoring its state, calculating secondary data, reporting data, controlling its environment, and balancing it. |
| Energy Density | A measure of how much energy a battery cell can store in a given volume, usually expressed in watt-hours per liter (Wh/L). |
| Power Density | The rate at which energy can be delivered by the battery, often measured in watts per kilogram (W/kg). |
| Cycle Life | The number of complete charge-discharge cycles a battery can perform before its capacity falls under a specified percentage of its original capacity. |
| State of Charge (SOC) | A measurement, expressed as a percentage, that represents the current level of charge in a battery compared to its capacity. |
| State of Health (SOH) | An indicator of the overall condition of a battery, reflecting its current performance compared to when it was new. |
| Thermal Management System | A system designed to maintain optimal operating temperatures for an EV's battery pack, often using cooling or heating methods. |
| Fast Charging | A method of charging an EV battery at a much faster rate than standard charging, typically requiring specialized charging equipment. |
| Regenerative Braking | A system in electric and hybrid vehicles that recovers energy normally lost during braking and stores it in the battery. |
Research Methodology
Mordor Intelligence follows a four-step methodology in all its reports.
- Step-1: Identify Key Variables: To build a robust forecasting methodology, the variables and factors identified in Step-1 are tested against available historical market numbers. Through an iterative process, the variables required for market forecast are set and the model is built based on these variables.
- Step-2: Build a Market Model: Market-size estimations for the historical and forecast years have been provided in revenue and volume terms. Market revenue is calculated by multiplying the volume demand with volume-weighted average battery pack price (per kWh). Battery pack price estimation and forecast takes into account various factors affecting ASP, such as inflation rates, market demand shifts, production costs, technological developments, and consumer preferences, providing estimations for both historical data and future trends.
- Step-3: Validate and Finalize: In this important step, all market numbers, variables, and analyst calls are validated through an extensive network of primary research experts from the market studied. The respondents are selected across levels and functions to generate a holistic picture of the market studied.
- Step-4: Research Outputs: Syndicated Reports, Custom Consulting Assignments, Databases & Subscription Platforms


