
Market Overview
| Study Period | 2020 - 2031 |
|---|---|
| Forecast Data Period | 2026 - 2031 |
| Base Year Market Size (2025) | USD 62.11 Billion |
| Market Size (2026) | USD 65.73 Billion |
| Market Size (2031) | USD 87.26 Billion |
| Growth Rate (2026 - 2031) | 5.83 % |
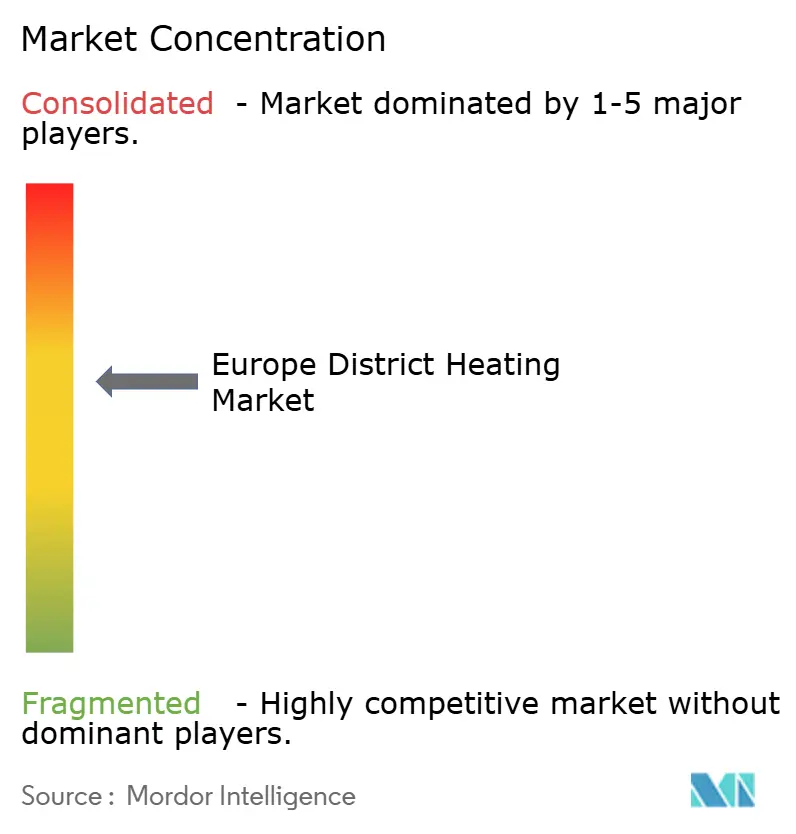
| Market Concentration | Medium |
Major Players *Disclaimer: Major Players sorted in no particular order Image © Mordor Intelligence. Reuse requires attribution under CC BY 4.0. | |
Europe District Heating Market Analysis by Mordor Intelligence
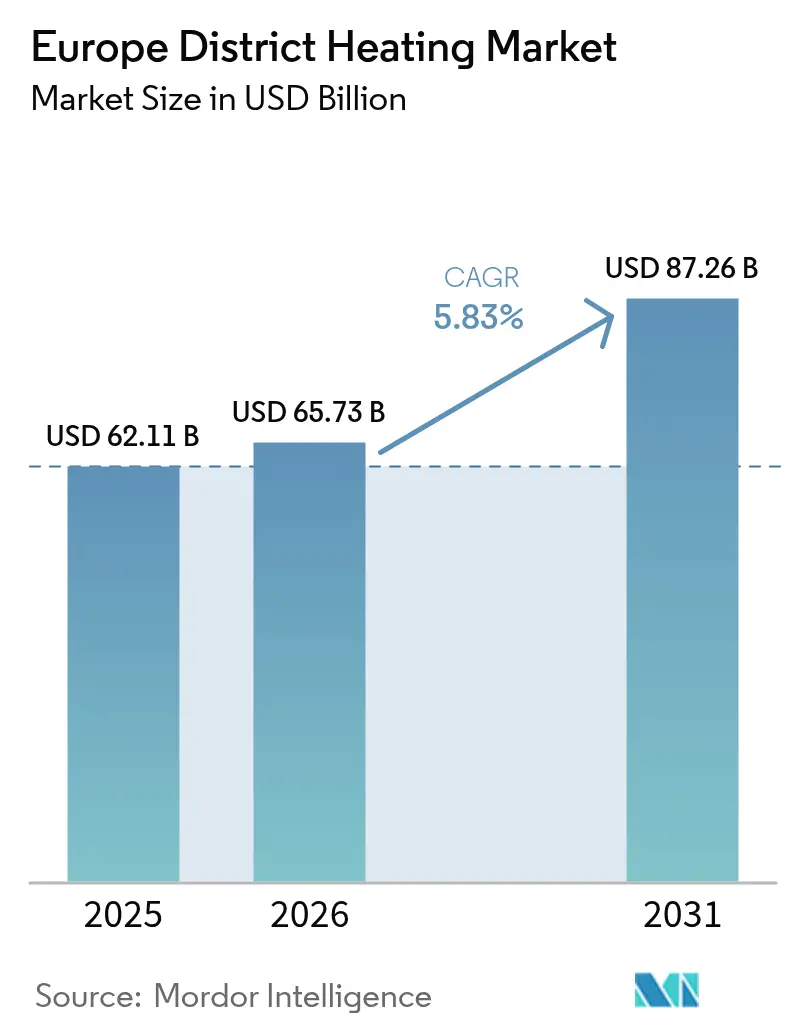
European district heating market size in 2026 is estimated at USD 65.73 billion, growing from 2025 value of USD 62.11 billion with 2031 projections showing USD 87.26 billion, growing at 5.83% CAGR over 2026-2031. The expansion reflects regulatory mandates that prioritize rapid decarbonization of building‐level heat, rising energy prices that sharpen the competitiveness of network solutions, and the accelerating integration of renewables into legacy distribution grids. Mandatory boiler phase-outs in Germany and the Netherlands, green bond–backed municipal financing, and the growing monetization of data-center waste heat are set to redefine supply-side economics across most urban hubs. Simultaneously, large-scale heat-pump deployment, improved pipe materials, and digital optimization platforms are reducing lifecycle costs, enabling utilities to scale while maintaining stable tariffs. Competitive intensity is rising in Nordic markets, where next-generation low-temperature schemes are gaining dominance, and it is expanding to Central and Southern Europe as new concession tenders are announced.
Key Report Takeaways
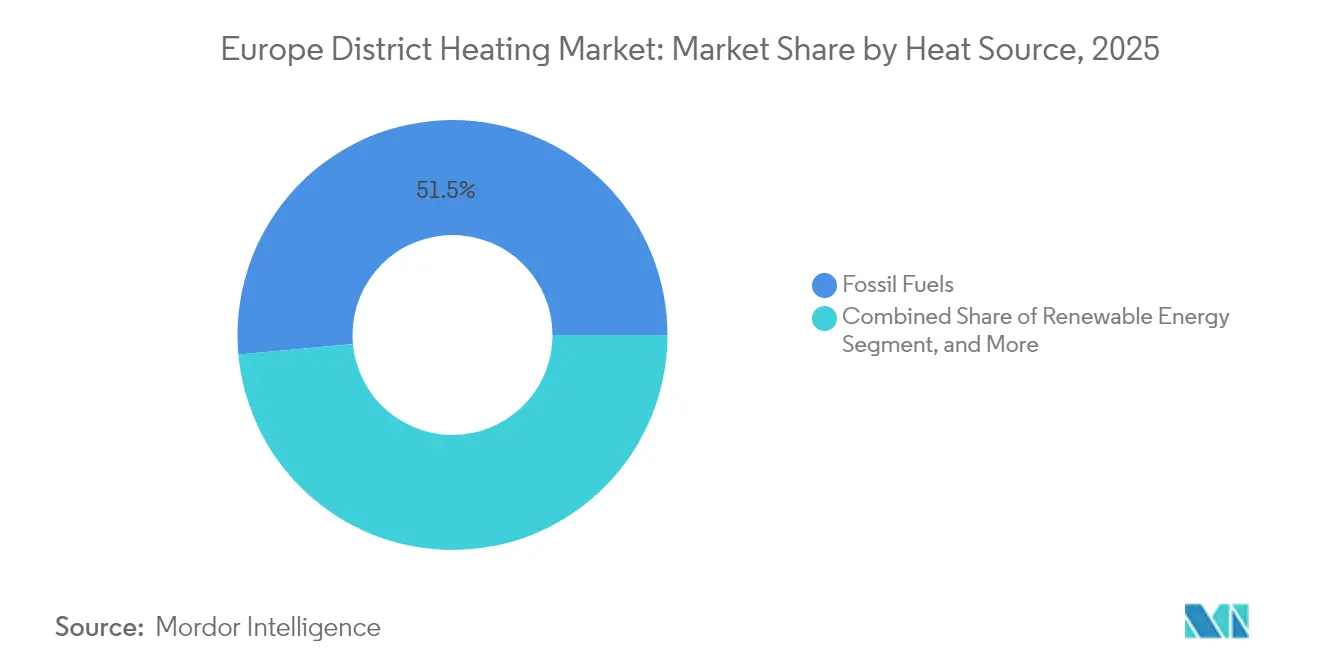
- By heat source, fossil fuels led with a 51.45% share of Europe's district heating market in 2025, while renewables recorded the fastest growth rate of 10.8% CAGR through 2031.
- By plant type, combined heat and power held a 56.75% share of the European district heating market size in 2025; large-scale heat pumps are forecast to grow at a 14.05% CAGR to 2031.
- By network temperature, 3rd-generation systems captured a 60.35% share of the European district heating market in 2025, whereas 5th-generation networks are expected to expand at a 16.9% CAGR through 2031.
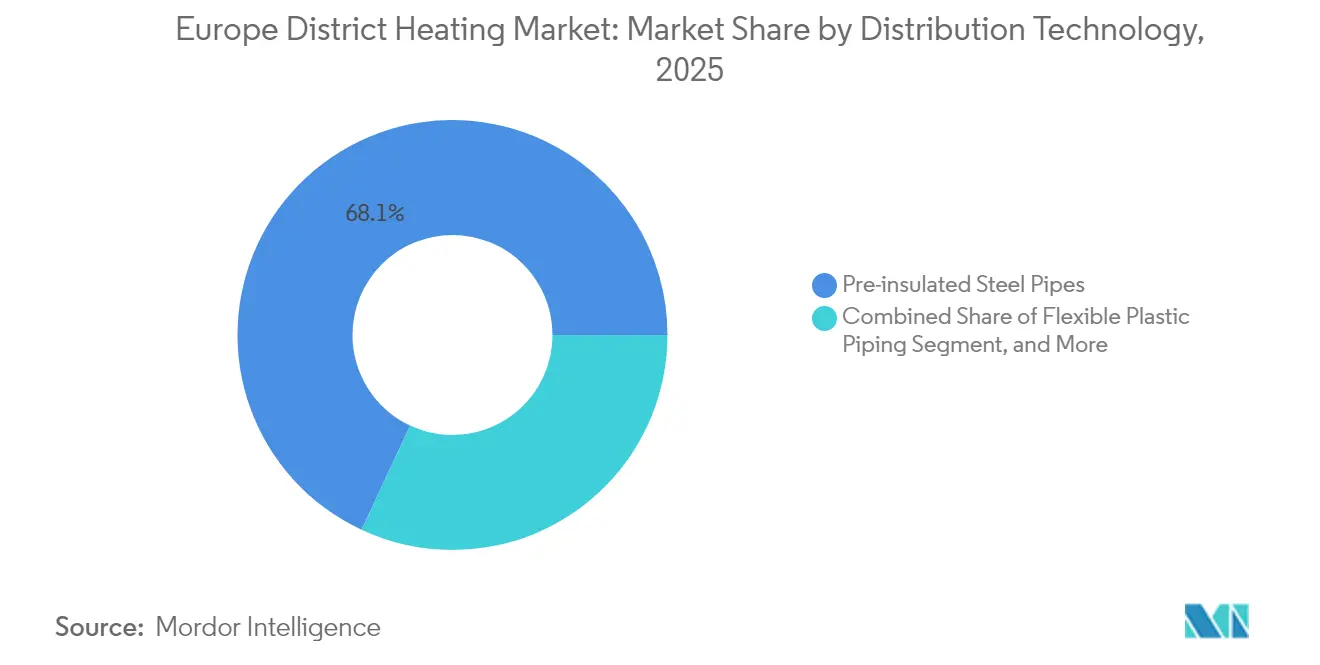
- By distribution technology, pre-insulated steel pipes commanded 68.05% share of the European district heating market in 2025; flexible plastic piping advances most rapidly at 11.85% CAGR.
- By end user, the residential sector accounted for a 46.05% share of the European district heating market in 2025; public and institutional users posted the highest 8.75% CAGR from 2025 to 2031.
- By country, Germany accounted for 23.55% of the European district heating market in 2025, with Nordic states displaying penetration rates above 50% in residential heating.
Note: Market size and forecast figures in this report are generated using Mordor Intelligence’s proprietary estimation framework, updated with the latest available data and insights as of 2026.
Market Trends and Insights
Drivers Impact Analysis of Europe District Heating Market*
| Driver | (~) % Impact on CAGR Forecast | Geographic Relevance | Impact Timeline |
|---|---|---|---|
| Rapid build-out of 4th-generation low-temperature networks in Scandinavia | +1.20% | Nordic countries, spill-over to Central Europe | Medium term (2-4 years) |
| Mandatory phase-out of individual gas boilers in Germany and Netherlands | +1.80% | Germany, Netherlands, expanding EU-wide | Short term (≤ 2 years) |
| EU Carbon Border Adjustment Mechanism accelerating industrial switching | +0.90% | EU-wide, strongest in industrial clusters | Medium term (2-4 years) |
| Surging data-center waste-heat recovery contracts in Northern Europe | +0.70% | Nordic countries, extending to Western Europe | Long term (≥ 4 years) |
| District cooling synergies in Southern Europe’s urban redevelopments | +0.60% | Southern Europe, Mediterranean cities | Long term (≥ 4 years) |
| Green-bond financing windows driving municipal network expansions | +0.50% | EU-wide, high-credit municipalities | Medium term (2-4 years) |
| Source: Mordor Intelligence | |||
Rapid Build-out of 4th-Gen Low-Temperature Networks in Scandinavia
Scandinavian utilities are standardizing 4th-generation networks that operate 20–45 °C below legacy systems, reducing distribution losses by up to 30% and enabling the cost-effective use of ambient and waste-heat resources. Projects such as Lund’s Cool DH and Sweden’s SEK 18 billion EcoDataCenter 2 combine large-scale heat pumps (COP > 4.0) with recycled industrial heat, slashing fuel costs while creating anchor loads for future grid extensions. Nordic design codes now form the basis of EU technical specifications, accelerating technology transfer into Central Europe.
Mandatory Phase-out of Individual Gas Boilers in Germany and Netherlands
Germany's Building Energy Act obliges new heating systems to source 65% renewable energy from 2024, effectively eliminating new fossil boilers and triggering a surge in district heating connections in land-constrained urban cores. [1] The Netherlands follows with a fully electric mandate for new builds by 2025 and hybrid heat-pump requirements for retrofits by 2026, reinforcing network economics in dense municipalities. Federal and local grants of up to EUR 21,000 (about USD 24,700) for renewable heating support payback periods under eight years.
EU Carbon Border Adjustment Mechanism Accelerating Industrial Switching
CBAM’s phased introduction places an explicit carbon cost on imports of cement, steel, and aluminum, prompting energy-intensive plants to seek low-carbon district heating to remain competitive in EU markets. [2] Early adopters secure long-term concessions, locking in heat offtake while de-risking municipal investment in grid extensions.
Surging Data-Centre Waste-Heat Recovery Contracts in Northern Europe
EU efficiency rules require data centers above 1 MW to valorize waste heat, catalyzing roughly 60 recovery projects across Northern Europe. Google’s Hamina facility and at North’s 250 MW campus in Denmark illustrate how hyperscale operators trade free cooling for district-heating revenue streams, while cities capture high-grade heat for residential zones.
Restraints Impact Analysis of Europe District Heating Market*
| Restraint | (~) % Impact on CAGR Forecast | Geographic Relevance | Impact Timeline |
|---|---|---|---|
| High retrofit costs for legacy 3rd-generation networks | -1.40% | EU-wide, especially Central and Eastern Europe | Long term (≥ 4 years) |
| Lengthy concession-award cycles and municipal tender delays | -0.80% | EU-wide, intense in smaller cities | Medium term (2-4 years) |
| Skills shortage in large-diameter pre-insulated pipe welding | -0.60% | EU-wide, acute in Germany and Nordics | Short term (≤ 2 years) |
| Competing on-site heat-pump economics in mild-climate zones | -0.90% | Southern Europe, Western coasts | Medium term (2-4 years) |
| Source: Mordor Intelligence | |||
High Retrofit Costs for Legacy 3rd-Gen Networks
Central- and Eastern-European grids require EUR 500-800 per meter to re-pipe and decouple outdated boilers, stretching municipal debt envelopes and causing multi-year postponements of planned conversions. [3]
Lengthy Concession-Award Cycles and Municipal Tender Delays
Smaller municipalities often spend 24–48 months navigating stakeholder consultations, environmental studies, and EU procurement rules, delaying revenue generation and discouraging private bidders. [4]
*Our forecasts treat driver/restraint impacts as directional, not additive. The impact forecasts reflect baseline growth, mix effects, and variable interactions.
Europe District Heating Market Segment Analysis
By Heat Source:
Renewable Integration Accelerates Despite Fossil DominanceFossil fuels retained 51.45% of the European district heating market share in 2025, primarily due to the continued use of entrenched gas and coal boilers, which remain economical when carbon prices are low. However, renewables post the fastest 10.8% CAGR to 2031, driven by the compatibility of biomass co-firing with existing furnaces, the abundance of geothermal energy in the Pannonian Basin, and growing industrial-waste heat offtake contracts. Nordic grids already surpass 42.6% renewable penetration, setting a precedent for the rest of the bloc. Solar-thermal fields, now costing EUR 20-50/MWh, scale quickly in Spain and France, smoothing summer demand dips through seasonal storage. Hybrid setups combine biomass baseloads with high-temperature heat pumps, enabling fossil-free, dispatchable heat that meets new emission reduction targets.
Geographically, geothermal pilot wells in Hungary and Croatia gain EU modernization grants, while Italy and Germany test deep-drilling rigs for 200 °C aquifers. Data-center waste heat joins the renewable basket, supplying stable 65–80 °C streams into 4GDH circuits. Seasonal intermittency drives the buildup of water-pit storage tanks with a capacity exceeding 100,000 m³ in Denmark, resulting in a 5–7 EUR/MWh reduction in marginal supply costs.

By Plant Type:
Heat Pumps Challenge CHP DominanceCombined heat and power units retained a 56.75% share of the European district heating market size in 2025, valued for dual energy streams and grid-balancing flexibility. Yet large heat pumps expand at 14.05% CAGR, spurred by cheaper renewable electricity and refrigerant advances that lift COPs above 5. Berlin’s 75 MW wastewater heat pump underscores a shift toward centralized electrified heat. Hybrid plants blend CHP turbines for winter peaks with variable-speed heat pumps for shoulder seasons, optimizing network return temperatures below 55 °C.
Nordic OEMs are ramping up production capacity; Sweden’s new 500,000-unit factory signals economies of scale that will push capital costs below EUR 500/kW by 2027. CO₂-based systems from Danish research institutes target dense urban neighborhoods, where flammability limits the use of synthetic refrigerants. Utilities retrofit existing CHPs with post-combustion carbon capture to protect sunk assets while reducing emission factors.
By Distribution Technology:
Flexible Solutions Gain Market SharePre-insulated steel still dominates at 68.05% share for trunk lines, but flexible plastic pipes grow 11.85% CAGR as cities choose no-dig installation and tight bend radii to minimize road closures. Polymer innovations halve weight, reducing on-site crane hours and cutting installed costs 15–20%. Bio-based PEX and fully circular recycled pipes cut cradle-to-gate emissions by up to 90%, meeting new EU product environmental footprint rules. District cooling variants with vapor diffusion barriers now handle chilled brine at 0 °C without insulation freeze-up, opening revenue in Mediterranean retrofit projects.
Advanced substations incorporate smart valves and ultrasonic meters that relay return-temperature data in real time. Utilities deploy AI software that continuously minimizes ∆T, avoiding peak boil-offs and extending plant maintenance intervals.
By End User:
Public Sector Leads Decarbonization EffortsResidential applications remained the largest at 46.05% market share in 2025, reflecting decades of apartment-block connections in former Soviet and Nordic nations. Yet public and institutional customers register the highest 8.75% CAGR as governments enforce green-public-procurement rules that favor network solutions. Municipalities bundle schools, hospitals, and administrative offices into anchor loads, guaranteeing bankability for new concessions. Commercial developers integrate network connections in building permits to satisfy nearly zero-energy requirements under Directive 2024/1275.
Large industrial parks pivot to district heating to hedge CBAM-related exposure. Notably, breweries and food processors adopt heat networks to valorize low-grade process heat, securing ISO 50001 certification.
Geography Analysis
Germany District Heating Market
Germany constitutes 23.55% of European demand, propelled by building codes that outlaw fossil boilers in new dwellings and enforce municipal heat-planning by 2026 for major cities. More than one-third of Berlin, Hamburg, and Munich dwellings already connect to grids, and federal subsidies cover 30% of eligible connection costs. Digital twin pilots in Flensburg lower annual CO₂ emissions by 15% through dynamic temperature control, showcasing future operating models.
Europe District Heating Market
The Nordic cluster remains Europe’s technology frontier. Finland channels data-center waste heat into urban grids, with Google’s Hamina site alone offsetting natural-gas use for 20,000 households. Sweden invests SEK 10 billion in network upgrades through 2029, focusing on integrating biochar and high-temperature heat pumps. Denmark maintains price caps on recovered excess heat, prompting ongoing regulatory fine-tuning to preserve investor margins. Norway explores small modular reactors dedicated to district heating, signaling interest in nuclear-heat baseloads. Southern Europe emerges as a cooling-forward opportunity. Barcelona’s LNG cold-recovery plant yields 131 GWh annually, avoiding 32,000 tCO₂ and acting as a blueprint for other Mediterranean ports. France’s MaPrimeRénov program has awarded 500,000 renewable-heat grants, scaling ground-source heat pump uptake that dovetails with emerging 5GDHC grids. Italy’s Brescia waste-heat initiative proves viability in mixed-use redevelopments. The United Kingdom, still at 2% penetration, accelerates pilot concessions such as East London’s 6,500-home network, positioning for catch-up growth post-2026.
Regulatory Landscape
EU-wide regulation is tightening around decarbonization and performance thresholds for district heating and cooling (DHC). The Energy Efficiency Directive (EU) 2023/1791 reinforces the definition and promotion of efficient DHC and frames a transition pathway to full decarbonization by 2050; from 1 January 2026, an emissions threshold of 150 g GHG/kWh of delivered heat/cold applies for efficient systems, raising the importance of continuous measurement and operational control. The same directive also increases pressure on metering and billing modernization, with remote readability requirements for heat meters and heat cost allocators by January 2027, directly impacting utilities, substation suppliers, and software providers.
On the buildings side, the recast Energy Performance of Buildings Directive, Directive (EU) 2024/1275, strengthens the role of efficient DHC in renovation and heating-system transitions and requires member states to bring into force national measures by 29 May 2026. Together with requirements to promote local heating and cooling planning (including municipalities above 45,000 population), these frameworks push cities toward structured heat planning, procurement, and technology choices that favor renewables, waste heat, and low-temperature network upgrades while constraining new stand-alone fossil heating support after 2025 except for limited grandfathered funding routes.
Value Chain Analysis
The value chain spans heat-source development and fuel supply (biomass, geothermal, solar-thermal, industrial and data-center waste heat), heat generation assets (CHP, boilers, large-scale heat pumps and electric boilers), network infrastructure (pre-insulated steel and flexible plastic piping, valves, insulation, civil works), customer interface equipment (substations/heat exchangers and building-level controls), and digital layers (SCADA upgrades, AI optimization, digital twins, and metering and billing systems). Developers and aggregators such as Newheat structure renewable heat supply, OEMs and component suppliers such as ISOPLUS and Enerpipe supply piping systems, and utilities and concession holders such as Veolia and ENGIE operate networks and manage customer connections.
Regulation and decarbonization targets are shifting value toward system integration and automation. The move toward efficient DHC definitions (renewables/waste heat/cogenerated heat share requirements) and the January 2027 remote-readable metering obligation under the Energy Efficiency Directive increase demand for smart meters, data platforms, and optimization software to manage multi-source inputs and lower return temperatures. Bottlenecks remain concentrated in skilled labor (including large-diameter pre-insulated pipe welding) and specialized materials, while newer offers such as Veolia's Ecothermal Grid (announced November 2025) illustrate the bundling trend across generation technologies, waste heat recovery, and AI-driven digital tools for smaller urban networks.
Competitive Landscape
Europe’s district heating arena reveals moderate fragmentation: regional utilities dominate local franchises while technology vendors jostle for plant and pipe retrofits. Vattenfall, ENGIE, and Veolia spearhead green-capex programs exceeding EUR 20 billion (USD 23.55 billion) through 2029, capitalizing on integration know-how and municipal partnerships. Carrier’s EUR 12 billion (USD 14.13 billion) purchase of Viessmann Climate Solutions signals convergence between appliance majors and utility operations, broadening turnkey capabilities in heat pumps and network substations.
Digital competencies become decisive. Gradyent’s AI engine helps Stadtwerke Flensburg cut peak supply temperatures by 15 °C, reducing gas use and opening export prospects for software layers atop legacy SCADA. Danfoss collaborates with Google and Hewlett Packard Enterprise on waste-heat-reuse frameworks that bundle drives, valves, and cloud analytics into single contracts. Engineering houses such as Ramboll launch white-label platforms to capture feasibility and EPC contracts in municipalities lacking in-house expertise.
New entrants target niche gaps: Steady Energy prototypes 50 MW thermal SMRs tailored for urban networks, promising sub-EUR 45/MWh baseload heat without combustion. Kamstrup’s ultrasonic meters with embedded edge-AI detect fraud and optimize billing cycles, raising switching costs for utilities once deployed at scale.
Europe District Heating Industry Leaders
-
Vattenfall AB
-
Danfoss A/S
-
Energie SA
-
Statkraft AS
-
Logstor A/S
- *Disclaimer: Major Players sorted in no particular order
Europe District Heating Market Companies Covered in this Report
- Vattenfall AB
- Engie SA
- Danfoss A/S
- Veolia Environnement SA
- Fortum Oyj
- Statkraft AS
- E.ON SE
- Logstor A/S
- Vital Energi Ltd
- Göteborg Energi
- Alfa Laval AB
- Ramboll Group A/S
- Kelvion Holding GmbH
- Savosolar Oyj
- Isoplus Piping Systems
- Uponor Infra Oy
- Thermaflex International
- REHAU AG
- Cory Group
- Cetetherm AB
- NIBE Industrier AB
Market Opportunities and Future Outlook
The fastest whitespace is forming around digital compliance and operational optimization as networks integrate more variable renewable and waste-heat inputs while meeting tighter EU definitions of efficient DHC. The Energy Efficiency Directive (EU) 2023/1791 requirement for remotely readable heat meters and heat cost allocators by January 2027 creates a near-term upgrade cycle across metering, communications, cybersecurity, and analytics, and it raises the value of vendors that can deliver end-to-end digital rollouts (meters, gateways, billing, and temperature optimization). Utility software and controls providers benefit as cities translate heat-planning mandates into technically enforceable network performance targets, particularly where emissions thresholds apply from 1 January 2026 for efficient DHC classifications.
New supply-side integration opportunities are emerging from waste heat recovery and electrified heat, supported by active public programs and utility deployments. The European Commission's April 2026 AccelerateEU Plan explicitly prioritizes district heating expansion and waste-heat recovery as tools to address energy price volatility and reduce fossil import exposure, reinforcing project pipelines tied to municipal planning and procurement. On the delivery side, named utility implementations such as Valmet's May 2026 optimization system deployment for Okun Energia Oy, designed to integrate data-center waste heat and bioenergy into district heating operations, highlights demand for optimization platforms that can orchestrate multiple heat sources and stabilize tariffs through efficiency gains.
Recent Industry Developments in Europe District Heating Market
- June 2026: Vattenfall completed the divestment of its stake in VB Energi (Vasterbergslagens Energi AB) to the municipalities of Ludvika and Fagersta for around SEK 1.4 billion. The transaction shifts ownership of local district heating and grid assets to municipal control, influencing future concession strategy, investment prioritization, and procurement patterns in the affected Swedish service areas.
- September 2025: Statkraft signed an agreement to sell its district heating business, Statkraft Varme, to a consortium owned by Patrizia SE and Nordic Infrastructure AG for NOK 3.6 billion. The deal underscores portfolio rotation by large energy players and creates a scaled platform owner with incentives to drive network modernization, asset efficiency, and potential bolt-on acquisitions.
- December 2024: HOFOR (Greater Copenhagen Utility) partnered with Danfoss to implement Danfoss Leanheat software to optimize temperatures across Copenhagen's district heating network. The deployment reinforces the shift toward data-driven operations, with software becoming a core lever for reducing distribution losses and managing lower-temperature network transitions.
Europe District Heating Market Report Scope and Research Methodology
Market Definition and Coverage
For this study, the Europe district heating market is defined as the revenue generated from producing and distributing heat through centralized networks to multiple buildings, using heat plants, pipes, substations, and connected control systems across European countries.
Scope exclusions: We exclude building-level standalone boilers and room heating equipment that do not deliver heat through a district network.
Segments Covered in This Report
- By Heat Source
- Fossil Fuels
- Renewable Energy (Biomass, Geothermal, Solar-Thermal)
- Industrial and Data-Centre Waste Heat
- By Plant Type
- Combined Heat and Power (CHP)
- Boiler-Based Plants
- Large-Scale Heat Pumps
- By Distribution Technology
- Pre-insulated Steel Pipes
- Flexible Plastic Piping
- Substations and Heat Exchangers
- Control and Monitoring Systems
- By End User
- Residential
- Commercial
- Industrial
- Public and Institutional
- By Country
- Germany
- France
- Austria
- Sweden
- United Kingdom
- Italy
- Rest of Europe
Data Sources, Market Sizing, and Validation
Desk Research
Desk research was used to set the boundaries of what counts as district heating revenue in Europe, and to anchor the model with publicly traceable energy and infrastructure signals. We reviewed sources such as Eurostat energy balances, the European Commission and related EU energy-policy publications, the International Energy Agency (IEA) datasets, and national statistics offices that report heat supply, fuel use, and energy prices. We also used materials from industry bodies such as Euroheat and Power, alongside utility annual reports, regulatory filings, and audited financial statements where they are available.
To reduce gaps in company-level visibility, we cross-checked operator footprints, project announcements, and capacity additions using general business press and investor presentations, and we also referenced paid subscriptions for company financials and news intelligence, plus patent databases for technology direction and adoption cues. These sources helped us sanity-check timelines for network expansions, heat-source changes, and control system upgrades that affect revenue progression. The desk research sources listed here are only illustrative, and many other public documents and datasets were also used for data collection, validation, and clarifications.
Primary Interviews and Surveys
Primary work focused on validating how district heating revenues are formed, and what network operators are actually seeing in heat demand, pricing, and fuel switching. We spoke with a mix of network owners and operators, equipment and solution providers, engineering partners, and large heat customers, then used follow-up questions to confirm country differences across major European markets and the Rest of Europe.
Distribution of primary research fieldwork respondents
| Company type | Respondent position |
|---|---|
| Top tier: 37% | CXOs: 18% |
| Mid tier: 45% | Functional/Unit leaders: 40% |
| Smaller Players: 18% | Managers: 42% |
Market-Sizing & Forecasting
Sizing starts from a top-down view where heat supplied through district networks is reconstructed using country energy balances, typical district heating penetration levels in served cities, and observed tariff and fuel cost movement. That demand pool is translated into revenue using a consistent price logic, then adjusted for known structural shifts such as lower-temperature networks and higher renewable and waste-heat integration.
To keep totals realistic, we corroborated the outputs with selective bottom-up approximations based on sampled operator revenue disclosures, project-by-project network additions, and checks on heat generation capacity roll-ups in countries where public reporting is stronger. Inputs used in the model include, in an illustrative way, connected heat load and delivered heat volumes, fuel mix (fossil, renewables such as biomass and geothermal, and industrial or data center waste heat), plant type shifts (CHP, boiler-based, large-scale heat pumps), and distribution investment pace (pipes, substations, and monitoring systems). When country data series had breaks or missing years, we filled gaps using short-run interpolation tied to fuel price indices and weather-normalized heating demand indicators, and then rechecked those assumptions in interviews.
Forecasting was mainly done using scenario analysis so policy-driven changes, fuel price uncertainty, and project commissioning slippage can be reflected without forcing one straight-line trend. We built a base case aligned with how operators plan capex and heat-source transitions, then tested upside and downside cases around connection rates, tariff pass-through speed, and retrofit pace.
Data Validation & Update Cycle
Validation is done in several steps so the final number does not depend on one dataset or one assumption. We compare the modeled revenue trend against independent signals such as heat supply volumes, reported network expansions, and fuel mix shifts at the country level, then review outliers for data issues or real market events. When a variance cannot be explained cleanly, the team rechecks source documents and, if needed, reconnects with respondents to confirm what changed and why.
Before sign-off, the model and the written conclusions go through an internal analyst review so scope boundaries, unit conversions, and currency handling stay consistent across countries. The report is refreshed annually, and interim updates are triggered when material events occur, such as major policy changes, large acquisitions, or notable commissioning delays. Right before delivery, we run a final update pass so the latest view available at that time is reflected in the output.
Mordor Intelligence's Europe District Heating Market Estimate Compared With Other Published Estimates
Published market sizes for Europe district heating can differ even when they use the same market name, because underlying inclusions and measurement points are not always consistent. In practice, differences usually come from whether the estimate is built from delivered-heat revenue versus equipment sales, how CHP-related value is treated, and how prices are converted and normalized across countries.
Eurostat heat and energy-balance signals, together with operator revenue disclosures and country tariff benchmarks, are the checks that keep Mordor Intelligence aligned to network-delivered district heating revenue rather than adjacent boiler, piping-only, or general heating equipment spend. Other estimates can move higher when they fold in broader heating infrastructure categories, or move lower when they apply conservative pass-through assumptions for fuel cost changes and delay the impact of new connections or heat pump projects.
Benchmark comparison
| Source | Market Size | Gaps in Research Methodology |
|---|---|---|
| Mordor Intelligence | USD 62.11 B (2025) | |
| Industry Bulletin A | USD 136.66 B (2025) | This figure likely uses a broader boundary that blends district heating with wider heating equipment and infrastructure spend, which can double count parts of the value chain that our model keeps separate. |
| Trade Journal B | USD 82.73 B (2030) | This estimate is published for a later year and often reflects a straight-line growth assumption, with less visible detail on how connection growth, tariff pass-through timing, and country mix effects are validated. |
Taken together, the spread is mainly explained by scope and timing, not by a single disputed input. Our approach stays traceable because the same demand signals, price logic, and country-level checks are applied consistently, and then the totals are cross-verified with real network and operator indicators before forecasting assumptions are finalized.
Key Questions Answered in the Report
What is the current size of the European district heating and cooling market?
The market stands at USD 65.73 billion in 2026 and is projected to grow to USD 87.26 billion by 2031.
Which segment is growing fastest within the district heating and cooling market?
Large-scale heat pumps lead with a 14.05% CAGR thanks to falling electricity prices and high system efficiency.
Why are 5th-generation networks important?
They operate at ambient temperatures, cutting distribution losses and enabling simultaneous heating and cooling with low-grade heat sources.
How will EU policies affect industrial users?
The Carbon Border Adjustment Mechanism adds a carbon cost to imports, incentivizing factories to connect to low-carbon district heating to stay competitive.
What financing models support new network construction?
Municipalities increasingly issue green bonds, directing at least one-third of raised capital to district heating and cooling projects at lower interest rates.
Which countries are leading in data-center waste-heat recovery?
Finland, Denmark, and Sweden host the majority of Europe’s 60-plus recovery projects, leveraging stringent energy-efficiency regulations and cold climates.