| Study Period | 2017 - 2030 |
| Base Year For Estimation | 2024 |
| Forecast Data Period | 2025 - 2030 |
| Market Size (2025) | USD 204.9 Billion |
| Market Size (2030) | USD 254.3 Billion |
| CAGR (2025 - 2030) | 4.42 % |
| Market Concentration | Low |
Major Players*Disclaimer: Major Players sorted in no particular order |

Europe Dairy Market Analysis
The Europe Dairy Market size is estimated at 204.9 billion USD in 2025, and is expected to reach 254.3 billion USD by 2030, growing at a CAGR of 4.42% during the forecast period (2025-2030).
The European dairy industry is experiencing significant transformation in its dairy distribution landscape, with retail channels evolving to meet changing consumer demands. Supermarkets and hypermarkets continue to dominate the sector, accounting for 58.45% of overall sales in 2022, leveraging their ability to influence consumer purchasing decisions through strategic product placement and extensive variety. The convenience store segment has shown remarkable resilience, recording a 2.9% increase in dairy product sales value in 2022 compared to the previous year. This growth is attributed to extended operating hours and strategic locations that cater to spontaneous purchasing behavior and immediate consumption needs.
The digital transformation of dairy retail has accelerated, with online channels emerging as the fastest-growing segment in the off-trade category. Major e-commerce platforms like Amazon, Sainsbury's, Asda, and Tesco have established sophisticated dairy product distribution networks, with cheese emerging as a particularly strong performer in the online space, representing 66.3% of the online retail value share in 2022. The integration of advanced cold chain logistics and last-mile delivery solutions has enabled retailers to maintain product quality while meeting the growing demand for convenient shopping options.
Sustainability and organic practices have become central to the industry's development, with major producers implementing comprehensive environmental initiatives. A notable example is Biolait, which represented 30% of organic milk collection in France in 2022, demonstrating the industry's shift toward sustainable production methods. The company's Belin farm exemplifies this commitment, with 97% of heifer feed and 73% of cow feed sourced from grass, highlighting the industry's focus on natural and sustainable farming practices.
The industry is witnessing a significant shift in product innovation, driven by evolving consumer preferences for healthier dairy variants. Manufacturers are responding by developing products with reduced sugar content, lower fat percentages, and grass-fed certifications. The foodservice sector is also adapting to these trends, with the on-trade channel expected to grow substantially, driven by the increasing incorporation of premium and health-focused dairy products in restaurant menus and food service offerings. This evolution reflects a broader industry trend toward premium, health-conscious products that align with modern dietary preferences.
Europe Dairy Market Trends
The increase in dairy food consumption is attributed to the growing interest in organic and natural dairy products and rising demand for butter-based snacks
- In 2022, the per capita consumption of dairy in Europe grew by 2.9% compared to 2021. Domestic milk consumption increased due to the COVID-19 outbreak in 2020, which was substantially sustained in 2022. EU consumers have gradually become more interested in consuming milk and other dairy foods produced organically or using other natural techniques as they believe it to be more natural and healthier, such as the "hay milk" produced in Austria and Germany. However, this trend came to a standstill in 2022 due to rising manufacturing costs. By 2025, the per capita consumption of dairy products in Europe is expected to rise by 5.0% from 2023.
- European consumers are moving toward butter-based snack products like cookies and crunchies. As a result, the import volume of butter has increased. EU27 butter imports recovered in 2022 from a decrease in 2020 and 2021 due to Brexit. Butter imports are projected to level off in 2023 by 1.45%. EU butter imports are practically limited to imports from the United Kingdom. In contrast, EU27 butter imports into the GATT WTO tariff rate quota (TRQ) from New Zealand have been limited after Brexit.
- With the rising demand for baked foods, including pizza, baked macaroni with mortadella, and other cheese-based products, the demand for cheese is also rising in the region. Cheese imports into EU27 are limited to Switzerland and the United Kingdom. Imports from the United Kingdom decreased in 2021 as UK exporters faced new customs checks after Brexit. EU cheese imports slightly decreased in 2022 due to decreasing imports from Switzerland. They are projected to remain stable in 2023.

Understand The Key Trends Shaping This Market
Download PDF
OTHER KEY INDUSTRY TRENDS COVERED IN THE REPORT
- The production increase in Europe can be attributed to improved self-sufficiency in butter production in countries like the United Kingdom and the projected increase in butter exports driven by increasing global demand for European butter
- The advancements taking place in dairy technologies and bad weather conditions emerged as the major factors impacting milk production in Europe
- The cheese production in Europe is influenced by milk production and deliveries, farm gate milk prices, domestic consumption trends, input prices, and global demand for cheese
Segment Analysis: Category
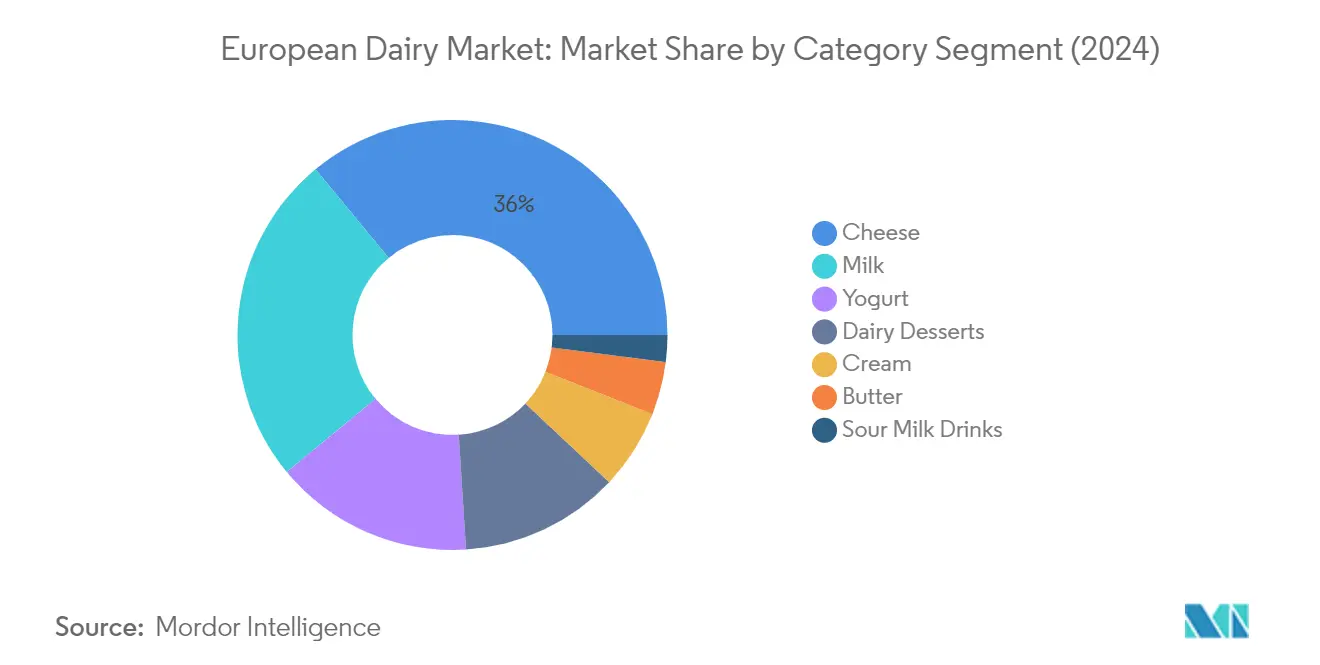
Cheese Segment in European Dairy Market
Cheese continues to dominate the European dairy market, holding approximately 36% market share in 2024. The segment's strong position is attributed to cheese being an integral part of European cuisine, combining major culinary traditions from Italian, British, German, Greek, and French cooking styles. More than 400 types of cheeses are produced in Italy alone, with mozzarella, parmesan, and pecorino being commonly used in regional cuisines. The segment's growth is further supported by the presence of Protected Designation of Origin (PDO) and Protected Geographical Indication (PGI) labels, which cover over 200 regional cheese varieties across Europe, ensuring the quality and authenticity of traditional cheese products.
Yogurt Segment in European Dairy Market
The yogurt segment is experiencing remarkable growth in the European dairy market, projected to expand at approximately 5% CAGR from 2024 to 2029. This growth is primarily driven by increasing consumer awareness of the health benefits associated with probiotics consumption and the availability of numerous flavors catering to evolving consumer preferences. Manufacturers are actively responding to health-conscious consumer demands by introducing low-sugar variants and fortifying products with additional nutrients. The segment's expansion is further supported by the rising popularity of Greek yogurt and plant-based alternatives, along with innovative product launches featuring unique flavor combinations and functional ingredients.
Remaining Segments in European Dairy Market
The European dairy market encompasses several other significant segments, including milk, dairy desserts, cream, butter, and sour milk drinks. The milk segment maintains its position as a fundamental dairy product, with various formats including fresh, UHT, and flavored variants meeting diverse consumer needs. Dairy desserts, particularly ice cream and frozen products, contribute significantly to the market's premium segment. The cream segment serves both retail and foodservice channels, while butter maintains its importance in traditional European baking and cooking. Sour milk drinks, though smaller in market share, play a crucial role in meeting specific consumer preferences for fermented dairy products.
Segment Analysis: Distribution Channel
Off-trade Segment in Europe Dairy Market
The off-trade distribution channel dominates the European dairy market, accounting for approximately 85% of the total market value in 2024. This substantial market share is primarily driven by the extensive network of supermarkets and hypermarkets across the region, which alone contributes to around 56% of off-trade sales. The segment's strong performance is supported by the increasing consumer preference for consolidated shopping experiences and the wide variety of dairy products available through retail outlets. Major retail chains like Metro Group, Ahold Delhaize, Tesco, REWE Group, and Aldi have established comprehensive distribution networks throughout Europe, offering both branded and private label dairy products to meet diverse consumer preferences.
Online Retail in Off-trade Segment in Europe Dairy Market
The online retail channel within the off-trade segment is projected to experience the most rapid growth during the forecast period 2024-2029, with an expected growth rate of approximately 4% annually. This growth is primarily driven by the increasing penetration of internet users across European countries, with about 93% of households having internet access. The expansion is further supported by the rising popularity of e-commerce platforms and the convenience of home delivery services. Major online retailers like Amazon, Sainsbury's, Asda, and Tesco have strengthened their digital presence, offering an extensive range of dairy products through their online platforms. The segment's growth is particularly notable in countries like Germany, France, and the United Kingdom, where digital infrastructure and consumer acceptance of online grocery shopping are well-established.
Remaining Segments in Distribution Channel
The on-trade distribution channel, while smaller in market share, plays a crucial role in the European dairy market through foodservice establishments, restaurants, cafes, and institutional buyers. This segment is particularly significant in countries with strong café and restaurant cultures, such as France, Italy, and Germany. The channel is characterized by bulk purchases and specialized dairy product requirements for professional food preparation. The segment's performance is closely tied to the foodservice industry's dynamics, tourism patterns, and changing consumer dining preferences. The presence of international quick-service restaurant chains, coffee shops, and traditional European cafes continues to support the steady demand for dairy products through this channel.
Europe Dairy Market Geography Segment Analysis
Dairy Market in France
France maintains its position as the leading dairy market in Europe, commanding approximately 16% of the total market value in 2024. The country's dominant position is underpinned by its robust dairy farming infrastructure, with France being Europe's second-largest milk producer after Germany. The country's dairy sector is characterized by a strong emphasis on quality and tradition, with a significant portion of production running through farm companies. French dairy organizations are actively setting up various enterprises to meet demand while maintaining stringent quality control systems. The market is particularly driven by the widespread consumption of cheese, yogurt, and milk products, which are deeply embedded in French culinary culture. The country's dairy industry is also witnessing a significant shift toward sustainable and organic production methods, with organizations like Biolait leading the organic milk collection. Innovation in product development and a growing focus on health-conscious consumers have led to the introduction of various low-fat, organic, and specialized dairy products. The strong presence of globally recognized brands and advanced distribution networks further strengthens France's position in the European dairy market.
Dairy Market in Belgium
Belgium emerges as the most dynamic market in the European dairy market, projected to grow at approximately 5% CAGR from 2024 to 2029. The country's dairy industry is experiencing remarkable transformation driven by significant investments in processing capacity and infrastructure development. Belgian dairy farms operate under strict environmental standards, implementing innovative measures such as methane digestion and rainwater harvesting to ensure sustainable production practices. The market's growth is supported by the country's strategic location and advanced logistics infrastructure, facilitating efficient distribution across Europe. Belgian dairy producers are increasingly focusing on value-added products and premium offerings, particularly in cheese and specialized dairy products. The country's dairy sector benefits from strong research and development initiatives, leading to innovative product launches that cater to evolving consumer preferences. The industry's commitment to quality is evident through comprehensive quality assurance programs and strict adherence to European Union regulations. Furthermore, Belgian dairy companies are actively expanding their dairy export capabilities, contributing to the sector's robust growth trajectory.
Dairy Market in Germany
Germany's dairy market continues to demonstrate strong performance, supported by its advanced dairy farming infrastructure and technological innovation. The country's dairy sector is characterized by its comprehensive approach to quality control and sustainability, with initiatives like Qualitätsmanagement Milch (QM Milch) ensuring high production standards. German consumers show a strong preference for dairy products, with milk, cheese, and yogurt being integral parts of daily consumption patterns. The market benefits from a well-established network of quick-service restaurants and cafes, contributing significantly to on-trade consumption. German dairy producers are increasingly focusing on organic and sustainable production methods, responding to growing consumer awareness of environmental issues. The country's dairy industry is also witnessing significant technological advancements in processing and packaging, enhancing product quality and shelf life. The market's strength is further reinforced by robust distribution networks and strong export capabilities, particularly in cheese production.
Dairy Market in Russia
Russia's dairy market demonstrates significant potential despite facing various challenges in recent years. The country's dairy sector is undergoing substantial modernization, with an increasing focus on improving production efficiency and product quality. The government's implementation of the Mercury system for National Electronic Veterinary Certification has enhanced product traceability and quality control throughout the supply chain. Russian dairy producers are investing in modern equipment and technologies to improve production capabilities and meet growing consumer demand. The market is witnessing a shift toward more sophisticated dairy products, with increasing consumer preference for premium and value-added offerings. Local dairy companies are expanding their product portfolios to include innovative dairy products that cater to changing consumer preferences. The industry is also seeing increased investment in cold chain infrastructure and distribution networks, crucial for maintaining product quality. Additionally, the sector benefits from government initiatives aimed at supporting domestic dairy production and ensuring food security.
Dairy Market in Other Countries
The dairy markets in other European countries, including Italy, the Netherlands, Spain, Turkey, and the United Kingdom, each demonstrate unique characteristics and growth patterns. These markets are characterized by diverse consumer preferences and varying levels of market maturity. Southern European countries typically show strong preferences for traditional dairy products, particularly cheese and yogurt, while Northern European markets demonstrate higher consumption of liquid milk and modern dairy products. These markets benefit from strong distribution networks and established retail channels, facilitating efficient product delivery to consumers. The dairy sectors in these countries are increasingly focusing on innovation and product differentiation to maintain competitiveness. Sustainability initiatives and organic production methods are gaining prominence across these markets, reflecting growing consumer awareness of environmental issues. The markets are also witnessing increased investment in research and development, leading to the introduction of new products that cater to evolving consumer preferences and dietary requirements.
Get Analysis on Important Geographic Markets
Download PDF
Europe Dairy Industry Overview
Top Companies in European Dairy Market
The European dairy companies market is led by established players including Groupe Lactalis, Danone SA, Unilever PLC, Arla Foods, and Nestlé SA. These companies are actively pursuing product innovation strategies, particularly in developing health-conscious and clean-label dairy products to meet evolving consumer preferences. Operational agility is demonstrated through investments in modern dairy manufacturing facilities and enhanced distribution networks, with companies expanding their production capacities across multiple European countries. Strategic moves include strengthening direct-to-consumer channels and developing sustainable supply chains, while expansion efforts focus on both organic growth and strategic acquisitions to penetrate new markets and consolidate existing positions. Companies are also emphasizing research and development activities through partnerships with academic institutions and investing in innovative packaging solutions to extend product shelf life and improve sustainability credentials.
Market Dominated by Diversified Global Players
The European dairy market exhibits a complex competitive structure characterized by the presence of both global conglomerates and regional specialists. Global players like Nestlé and Unilever leverage their extensive distribution networks and diverse product portfolios to maintain market leadership, while regional specialists such as Hochwald Milch and Savencia Fromage & Dairy compete through specialized product offerings and strong local market knowledge. The market demonstrates moderate fragmentation, with larger players continuously seeking consolidation opportunities through mergers and acquisitions to strengthen their market positions and expand their geographical presence.
The competitive landscape is further shaped by vertical integration strategies, with many leading companies maintaining control over the entire value chain from milk collection to distribution. Merger and acquisition activities are particularly concentrated in high-growth segments such as organic dairy products and specialized nutrition, with companies seeking to acquire innovative brands and technologies. The market also sees significant collaboration between dairy cooperatives and major processors, creating a complex network of partnerships that influence competitive dynamics.
Innovation and Sustainability Drive Future Success
Success in the European dairy market increasingly depends on companies' ability to innovate while maintaining sustainable practices. Incumbent players must focus on developing premium and functional dairy products, investing in advanced dairy processing technologies, and strengthening their sustainability credentials through responsible sourcing and reduced environmental impact. Market leaders are also expanding their plant-based dairy alternatives portfolio to address changing consumer preferences while maintaining their traditional dairy business. The ability to maintain strong relationships with farmers and ensure supply chain transparency has become crucial for maintaining market position.
For contenders looking to gain market share, differentiation through specialized product offerings and focus on underserved market segments presents significant opportunities. Success factors include developing strong regional distribution networks, investing in digital capabilities for direct-to-consumer sales, and creating innovative packaging solutions. Companies must also navigate increasing regulatory pressures regarding environmental sustainability and animal welfare, while addressing potential substitution risks from plant-based alternatives. Building strong brands with clear sustainability messaging and health benefits will be crucial for future success, particularly as consumer awareness about environmental and health issues continues to grow.
Europe Dairy Market Leaders
-
Arla Foods Amba
-
Danone SA
-
Groupe Lactalis
-
Nestlé SA
-
Unilever PLC
- *Disclaimer: Major Players sorted in no particular order

Need More Details on Market Players and Competitors?
Download PDF
Europe Dairy Market News
- June 2022: Hochwald Milch eG invested EUR 200 million to expand its business by opening a new dairy manufacturing facility in Germany. The new plant is located on a 21.5-hectare property and has 60,000 sq. m floor space.
- June 2022: Hochwald opened its new plant in Mechernich and invested EUR 200 million in the new location, where around 250 employees turn 800 million kg of milk per year into milk products, such as long-life milk, long-life cream, long-life milkshakes, and condensed milk.
- March 2022: Lactalis Group and Bayerische Milchindustrie eG (BMI) signed a contract for the sale of BMI’s Fresh division with the product groups: Fresh Milk, Yoghurt, and other products. Through this acquisition, Lactalis intends to build a close and long-term partnership with the southern German milk producers to further develop the market for regional products in food retail, national foodservice, and ethnic trade.
Free With This Report
We provide a comprehensive and exhaustive set of data pointers for global, regional, and country-level metrics that illustrate the fundamentals of the dairy industry. With the help of 45+ free charts, clients can access in-depth market analysis based on per capita consumption numbers and production data of raw materials for dairy, through granular-level segmental information supported by a repository of market data, trends, and expert analysis. Data and analysis on dairy, categories of dairy products, product types, etc., are available in the form of comprehensive reports as well as excel based data worksheets.


Europe Dairy Market Report - Table of Contents
1. EXECUTIVE SUMMARY & KEY FINDINGS
2. REPORT OFFERS
3. INTRODUCTION
- 3.1 Study Assumptions & Market Definition
- 3.2 Scope of the Study
- 3.3 Research Methodology
4. KEY INDUSTRY TRENDS
- 4.1 Per Capita Consumption
-
4.2 Raw Material/commodity Production
- 4.2.1 Butter
- 4.2.2 Cheese
- 4.2.3 Milk
-
4.3 Regulatory Framework
- 4.3.1 France
- 4.3.2 Germany
- 4.3.3 Italy
- 4.3.4 United Kingdom
- 4.4 Value Chain & Distribution Channel Analysis
5. MARKET SEGMENTATION (includes market size in Value in USD and Volume, Forecasts up to 2030 and analysis of growth prospects)
-
5.1 Category
- 5.1.1 Butter
- 5.1.1.1 By Product Type
- 5.1.1.1.1 Cultured Butter
- 5.1.1.1.2 Uncultured Butter
- 5.1.2 Cheese
- 5.1.2.1 By Product Type
- 5.1.2.1.1 Natural Cheese
- 5.1.2.1.2 Processed Cheese
- 5.1.3 Cream
- 5.1.3.1 By Product Type
- 5.1.3.1.1 Double Cream
- 5.1.3.1.2 Single Cream
- 5.1.3.1.3 Whipping Cream
- 5.1.3.1.4 Others
- 5.1.4 Dairy Desserts
- 5.1.4.1 By Product Type
- 5.1.4.1.1 Cheesecakes
- 5.1.4.1.2 Frozen Desserts
- 5.1.4.1.3 Ice Cream
- 5.1.4.1.4 Mousses
- 5.1.4.1.5 Others
- 5.1.5 Milk
- 5.1.5.1 By Product Type
- 5.1.5.1.1 Condensed milk
- 5.1.5.1.2 Flavored Milk
- 5.1.5.1.3 Fresh Milk
- 5.1.5.1.4 Powdered Milk
- 5.1.5.1.5 UHT Milk
- 5.1.6 Sour Milk Drinks
- 5.1.7 Yogurt
- 5.1.7.1 By Product Type
- 5.1.7.1.1 Flavored Yogurt
- 5.1.7.1.2 Unflavored Yogurt
-
5.2 Distribution Channel
- 5.2.1 Off-Trade
- 5.2.1.1 Convenience Stores
- 5.2.1.2 Online Retail
- 5.2.1.3 Specialist Retailers
- 5.2.1.4 Supermarkets and Hypermarkets
- 5.2.1.5 Others (Warehouse clubs, gas stations, etc.)
- 5.2.2 On-Trade
-
5.3 Country
- 5.3.1 Belgium
- 5.3.2 France
- 5.3.3 Germany
- 5.3.4 Italy
- 5.3.5 Netherlands
- 5.3.6 Russia
- 5.3.7 Spain
- 5.3.8 Turkey
- 5.3.9 United Kingdom
- 5.3.10 Rest of Europe
6. COMPETITIVE LANDSCAPE
- 6.1 Key Strategic Moves
- 6.2 Market Share Analysis
- 6.3 Company Landscape
-
6.4 Company Profiles (includes Global Level Overview, Market Level Overview, Core Business Segments, Financials, Headcount, Key Information, Market Rank, Market Share, Products and Services, and Analysis of Recent Developments).
- 6.4.1 Arla Foods Amba
- 6.4.2 Danone SA
- 6.4.3 DMK Deutsches Milchkontor GmbH
- 6.4.4 Glanbia PLC
- 6.4.5 Groupe Lactalis
- 6.4.6 Groupe Sodiaal
- 6.4.7 Hochland Holding GmbH & Co. KG
- 6.4.8 Hochwald Milch eG
- 6.4.9 Müller Group
- 6.4.10 Nestlé SA
- 6.4.11 Savencia Fromage & Dairy
- 6.4.12 Unilever PLC
7. KEY STRATEGIC QUESTIONS FOR DAIRY AND DAIRY ALTERNATIVE CEOS
8. APPENDIX
-
8.1 Global Overview
- 8.1.1 Overview
- 8.1.2 Porter’s Five Forces Framework
- 8.1.3 Global Value Chain Analysis
- 8.1.4 Market Dynamics (DROs)
- 8.2 Sources & References
- 8.3 List of Tables & Figures
- 8.4 Primary Insights
- 8.5 Data Pack
- 8.6 Glossary of Terms
You Can Purchase Parts Of This Report. Check Out Prices For Specific Sections
Get Price Break-up Now
List of Tables & Figures
- Figure 1:
- PER CAPITA CONSUMPTION OF MILK, BUTTER, CHEESE, KG, EUROPE, 2017 - 2030
- Figure 2:
- PRODUCTION OF BUTTER, METRIC TONNES, EUROPE, 2017 - 2024
- Figure 3:
- PRODUCTION OF CHEESE, METRIC TONNES, EUROPE, 2017 - 2024
- Figure 4:
- PRODUCTION OF MILK, METRIC TONNES, EUROPE, 2017 - 2024
- Figure 5:
- VOLUME OF DAIRY, METRIC TONNES, BY EUROPE, 2017 - 2030
- Figure 6:
- VALUE OF DAIRY, USD, BY EUROPE, 2017 - 2030
- Figure 7:
- VOLUME OF DAIRY MARKET BY CATEGORY, METRIC TONNES, EUROPE, 2017 - 2030
- Figure 8:
- VALUE OF DAIRY MARKET BY CATEGORY, USD, EUROPE, 2017 - 2030
- Figure 9:
- VOLUME SHARE OF DAIRY MARKET, BY CATEGORY , %, EUROPE, 2017 VS 2023 VS 2029
- Figure 10:
- VALUE SHARE OF DAIRY MARKET, BY CATEGORY , %, EUROPE, 2017 VS 2023 VS 2029
- Figure 11:
- VOLUME OF BUTTER MARKET BY PRODUCT TYPE, METRIC TONNES, EUROPE, 2017 - 2030
- Figure 12:
- VALUE OF BUTTER MARKET BY PRODUCT TYPE, USD, EUROPE, 2017 - 2030
- Figure 13:
- VOLUME SHARE OF BUTTER MARKET BY PRODUCT TYPE, %, EUROPE, 2017 VS 2023 VS 2029
- Figure 14:
- VALUE SHARE OF BUTTER MARKET BY PRODUCT TYPE, %, EUROPE, 2017 VS 2023 VS 2029
- Figure 15:
- VOLUME OF CULTURED BUTTER MARKET, METRIC TONNES, EUROPE, 2017 - 2030
- Figure 16:
- VALUE OF CULTURED BUTTER MARKET, USD, EUROPE, 2017 - 2030
- Figure 17:
- VALUE SHARE OF CULTURED BUTTER MARKET, BY DISTRIBUTION CHANNEL , %, EUROPE, 2022 VS 2029
- Figure 18:
- VOLUME OF UNCULTURED BUTTER MARKET, METRIC TONNES, EUROPE, 2017 - 2030
- Figure 19:
- VALUE OF UNCULTURED BUTTER MARKET, USD, EUROPE, 2017 - 2030
- Figure 20:
- VALUE SHARE OF UNCULTURED BUTTER MARKET, BY DISTRIBUTION CHANNEL , %, EUROPE, 2022 VS 2029
- Figure 21:
- VOLUME OF CHEESE MARKET BY PRODUCT TYPE, METRIC TONNES, EUROPE, 2017 - 2030
- Figure 22:
- VALUE OF CHEESE MARKET BY PRODUCT TYPE, USD, EUROPE, 2017 - 2030
- Figure 23:
- VOLUME SHARE OF CHEESE MARKET BY PRODUCT TYPE, %, EUROPE, 2017 VS 2023 VS 2029
- Figure 24:
- VALUE SHARE OF CHEESE MARKET BY PRODUCT TYPE, %, EUROPE, 2017 VS 2023 VS 2029
- Figure 25:
- VOLUME OF NATURAL CHEESE MARKET, METRIC TONNES, EUROPE, 2017 - 2030
- Figure 26:
- VALUE OF NATURAL CHEESE MARKET, USD, EUROPE, 2017 - 2030
- Figure 27:
- VALUE SHARE OF NATURAL CHEESE MARKET, BY DISTRIBUTION CHANNEL , %, EUROPE, 2022 VS 2029
- Figure 28:
- VOLUME OF PROCESSED CHEESE MARKET, METRIC TONNES, EUROPE, 2017 - 2030
- Figure 29:
- VALUE OF PROCESSED CHEESE MARKET, USD, EUROPE, 2017 - 2030
- Figure 30:
- VALUE SHARE OF PROCESSED CHEESE MARKET, BY DISTRIBUTION CHANNEL , %, EUROPE, 2022 VS 2029
- Figure 31:
- VOLUME OF CREAM MARKET BY PRODUCT TYPE, METRIC TONNES, EUROPE, 2017 - 2030
- Figure 32:
- VALUE OF CREAM MARKET BY PRODUCT TYPE, USD, EUROPE, 2017 - 2030
- Figure 33:
- VOLUME SHARE OF CREAM MARKET BY PRODUCT TYPE, %, EUROPE, 2017 VS 2023 VS 2029
- Figure 34:
- VALUE SHARE OF CREAM MARKET BY PRODUCT TYPE, %, EUROPE, 2017 VS 2023 VS 2029
- Figure 35:
- VOLUME OF DOUBLE CREAM MARKET, METRIC TONNES, EUROPE, 2017 - 2030
- Figure 36:
- VALUE OF DOUBLE CREAM MARKET, USD, EUROPE, 2017 - 2030
- Figure 37:
- VALUE SHARE OF DOUBLE CREAM MARKET, BY DISTRIBUTION CHANNEL , %, EUROPE, 2022 VS 2029
- Figure 38:
- VOLUME OF SINGLE CREAM MARKET, METRIC TONNES, EUROPE, 2017 - 2030
- Figure 39:
- VALUE OF SINGLE CREAM MARKET, USD, EUROPE, 2017 - 2030
- Figure 40:
- VALUE SHARE OF SINGLE CREAM MARKET, BY DISTRIBUTION CHANNEL , %, EUROPE, 2022 VS 2029
- Figure 41:
- VOLUME OF WHIPPING CREAM MARKET, METRIC TONNES, EUROPE, 2017 - 2030
- Figure 42:
- VALUE OF WHIPPING CREAM MARKET, USD, EUROPE, 2017 - 2030
- Figure 43:
- VALUE SHARE OF WHIPPING CREAM MARKET, BY DISTRIBUTION CHANNEL , %, EUROPE, 2022 VS 2029
- Figure 44:
- VOLUME OF OTHERS MARKET, METRIC TONNES, EUROPE, 2017 - 2030
- Figure 45:
- VALUE OF OTHERS MARKET, USD, EUROPE, 2017 - 2030
- Figure 46:
- VALUE SHARE OF OTHERS MARKET, BY DISTRIBUTION CHANNEL , %, EUROPE, 2022 VS 2029
- Figure 47:
- VOLUME OF DAIRY DESSERTS MARKET BY PRODUCT TYPE, METRIC TONNES, EUROPE, 2017 - 2030
- Figure 48:
- VALUE OF DAIRY DESSERTS MARKET BY PRODUCT TYPE, USD, EUROPE, 2017 - 2030
- Figure 49:
- VOLUME SHARE OF DAIRY DESSERTS MARKET BY PRODUCT TYPE, %, EUROPE, 2017 VS 2023 VS 2029
- Figure 50:
- VALUE SHARE OF DAIRY DESSERTS MARKET BY PRODUCT TYPE, %, EUROPE, 2017 VS 2023 VS 2029
- Figure 51:
- VOLUME OF CHEESECAKES MARKET, METRIC TONNES, EUROPE, 2017 - 2030
- Figure 52:
- VALUE OF CHEESECAKES MARKET, USD, EUROPE, 2017 - 2030
- Figure 53:
- VALUE SHARE OF CHEESECAKES MARKET, BY DISTRIBUTION CHANNEL , %, EUROPE, 2022 VS 2029
- Figure 54:
- VOLUME OF FROZEN DESSERTS MARKET, METRIC TONNES, EUROPE, 2017 - 2030
- Figure 55:
- VALUE OF FROZEN DESSERTS MARKET, USD, EUROPE, 2017 - 2030
- Figure 56:
- VALUE SHARE OF FROZEN DESSERTS MARKET, BY DISTRIBUTION CHANNEL , %, EUROPE, 2022 VS 2029
- Figure 57:
- VOLUME OF ICE CREAM MARKET, METRIC TONNES, EUROPE, 2017 - 2030
- Figure 58:
- VALUE OF ICE CREAM MARKET, USD, EUROPE, 2017 - 2030
- Figure 59:
- VALUE SHARE OF ICE CREAM MARKET, BY DISTRIBUTION CHANNEL , %, EUROPE, 2022 VS 2029
- Figure 60:
- VOLUME OF MOUSSES MARKET, METRIC TONNES, EUROPE, 2017 - 2030
- Figure 61:
- VALUE OF MOUSSES MARKET, USD, EUROPE, 2017 - 2030
- Figure 62:
- VALUE SHARE OF MOUSSES MARKET, BY DISTRIBUTION CHANNEL , %, EUROPE, 2022 VS 2029
- Figure 63:
- VOLUME OF OTHERS MARKET, METRIC TONNES, EUROPE, 2017 - 2030
- Figure 64:
- VALUE OF OTHERS MARKET, USD, EUROPE, 2017 - 2030
- Figure 65:
- VALUE SHARE OF OTHERS MARKET, BY DISTRIBUTION CHANNEL , %, EUROPE, 2022 VS 2029
- Figure 66:
- VOLUME OF MILK MARKET BY PRODUCT TYPE, METRIC TONNES, EUROPE, 2017 - 2030
- Figure 67:
- VALUE OF MILK MARKET BY PRODUCT TYPE, USD, EUROPE, 2017 - 2030
- Figure 68:
- VOLUME SHARE OF MILK MARKET BY PRODUCT TYPE, %, EUROPE, 2017 VS 2023 VS 2029
- Figure 69:
- VALUE SHARE OF MILK MARKET BY PRODUCT TYPE, %, EUROPE, 2017 VS 2023 VS 2029
- Figure 70:
- VOLUME OF CONDENSED MILK MARKET, METRIC TONNES, EUROPE, 2017 - 2030
- Figure 71:
- VALUE OF CONDENSED MILK MARKET, USD, EUROPE, 2017 - 2030
- Figure 72:
- VALUE SHARE OF CONDENSED MILK MARKET, BY DISTRIBUTION CHANNEL , %, EUROPE, 2022 VS 2029
- Figure 73:
- VOLUME OF FLAVORED MILK MARKET, METRIC TONNES, EUROPE, 2017 - 2030
- Figure 74:
- VALUE OF FLAVORED MILK MARKET, USD, EUROPE, 2017 - 2030
- Figure 75:
- VALUE SHARE OF FLAVORED MILK MARKET, BY DISTRIBUTION CHANNEL , %, EUROPE, 2022 VS 2029
- Figure 76:
- VOLUME OF FRESH MILK MARKET, METRIC TONNES, EUROPE, 2017 - 2030
- Figure 77:
- VALUE OF FRESH MILK MARKET, USD, EUROPE, 2017 - 2030
- Figure 78:
- VALUE SHARE OF FRESH MILK MARKET, BY DISTRIBUTION CHANNEL , %, EUROPE, 2022 VS 2029
- Figure 79:
- VOLUME OF POWDERED MILK MARKET, METRIC TONNES, EUROPE, 2017 - 2030
- Figure 80:
- VALUE OF POWDERED MILK MARKET, USD, EUROPE, 2017 - 2030
- Figure 81:
- VALUE SHARE OF POWDERED MILK MARKET, BY DISTRIBUTION CHANNEL , %, EUROPE, 2022 VS 2029
- Figure 82:
- VOLUME OF UHT MILK MARKET, METRIC TONNES, EUROPE, 2017 - 2030
- Figure 83:
- VALUE OF UHT MILK MARKET, USD, EUROPE, 2017 - 2030
- Figure 84:
- VALUE SHARE OF UHT MILK MARKET, BY DISTRIBUTION CHANNEL , %, EUROPE, 2022 VS 2029
- Figure 85:
- VOLUME OF SOUR MILK DRINKS MARKET, METRIC TONNES, EUROPE, 2017 - 2030
- Figure 86:
- VALUE OF SOUR MILK DRINKS MARKET, USD, EUROPE, 2017 - 2030
- Figure 87:
- VALUE SHARE OF SOUR MILK DRINKS MARKET, BY DISTRIBUTION CHANNEL , %, EUROPE, 2022 VS 2029
- Figure 88:
- VOLUME OF YOGURT MARKET BY PRODUCT TYPE, METRIC TONNES, EUROPE, 2017 - 2030
- Figure 89:
- VALUE OF YOGURT MARKET BY PRODUCT TYPE, USD, EUROPE, 2017 - 2030
- Figure 90:
- VOLUME SHARE OF YOGURT MARKET BY PRODUCT TYPE, %, EUROPE, 2017 VS 2023 VS 2029
- Figure 91:
- VALUE SHARE OF YOGURT MARKET BY PRODUCT TYPE, %, EUROPE, 2017 VS 2023 VS 2029
- Figure 92:
- VOLUME OF FLAVORED YOGURT MARKET, METRIC TONNES, EUROPE, 2017 - 2030
- Figure 93:
- VALUE OF FLAVORED YOGURT MARKET, USD, EUROPE, 2017 - 2030
- Figure 94:
- VALUE SHARE OF FLAVORED YOGURT MARKET, BY DISTRIBUTION CHANNEL , %, EUROPE, 2022 VS 2029
- Figure 95:
- VOLUME OF UNFLAVORED YOGURT MARKET, METRIC TONNES, EUROPE, 2017 - 2030
- Figure 96:
- VALUE OF UNFLAVORED YOGURT MARKET, USD, EUROPE, 2017 - 2030
- Figure 97:
- VALUE SHARE OF UNFLAVORED YOGURT MARKET, BY DISTRIBUTION CHANNEL , %, EUROPE, 2022 VS 2029
- Figure 98:
- VOLUME OF DAIRY MARKET BY DISTRIBUTION CHANNEL, METRIC TONNES, EUROPE, 2017 - 2030
- Figure 99:
- VALUE OF DAIRY MARKET BY DISTRIBUTION CHANNEL, USD, EUROPE, 2017 - 2030
- Figure 100:
- VOLUME SHARE OF DAIRY MARKET, BY DISTRIBUTION CHANNEL , %, EUROPE, 2017 VS 2023 VS 2029
- Figure 101:
- VALUE SHARE OF DAIRY MARKET, BY DISTRIBUTION CHANNEL , %, EUROPE, 2017 VS 2023 VS 2029
- Figure 102:
- VOLUME OF DAIRY MARKET BY SUB DISTRIBUTION CHANNELS, METRIC TONNES, EUROPE, 2017 - 2030
- Figure 103:
- VALUE OF DAIRY MARKET BY SUB DISTRIBUTION CHANNELS, USD, EUROPE, 2017 - 2030
- Figure 104:
- VOLUME SHARE OF DAIRY MARKET, BY SUB DISTRIBUTION CHANNELS , %, EUROPE, 2017 VS 2023 VS 2029
- Figure 105:
- VALUE SHARE OF DAIRY MARKET, BY SUB DISTRIBUTION CHANNELS , %, EUROPE, 2017 VS 2023 VS 2029
- Figure 106:
- VOLUME OF DAIRY MARKET SOLD VIA CONVENIENCE STORES, METRIC TONNES, EUROPE, 2017 - 2030
- Figure 107:
- VALUE OF DAIRY MARKET SOLD VIA CONVENIENCE STORES, USD, EUROPE, 2017 - 2030
- Figure 108:
- VALUE SHARE OF DAIRY MARKET, SOLD VIA CONVENIENCE STORES, BY CATEGORY , %, EUROPE, 2022 VS 2029
- Figure 109:
- VOLUME OF DAIRY MARKET SOLD VIA ONLINE RETAIL, METRIC TONNES, EUROPE, 2017 - 2029
- Figure 110:
- VALUE OF DAIRY MARKET SOLD VIA ONLINE RETAIL, USD, EUROPE, 2017 - 2029
- Figure 111:
- VALUE SHARE OF DAIRY MARKET, SOLD VIA ONLINE RETAIL, BY CATEGORY , %, EUROPE, 2022 VS 2029
- Figure 112:
- VOLUME OF DAIRY MARKET SOLD VIA SPECIALIST RETAILERS, METRIC TONNES, EUROPE, 2017 - 2030
- Figure 113:
- VALUE OF DAIRY MARKET SOLD VIA SPECIALIST RETAILERS, USD, EUROPE, 2017 - 2030
- Figure 114:
- VALUE SHARE OF DAIRY MARKET, SOLD VIA SPECIALIST RETAILERS, BY CATEGORY , %, EUROPE, 2022 VS 2029
- Figure 115:
- VOLUME OF DAIRY MARKET SOLD VIA SUPERMARKETS AND HYPERMARKETS, METRIC TONNES, EUROPE, 2017 - 2030
- Figure 116:
- VALUE OF DAIRY MARKET SOLD VIA SUPERMARKETS AND HYPERMARKETS, USD, EUROPE, 2017 - 2030
- Figure 117:
- VALUE SHARE OF DAIRY MARKET, SOLD VIA SUPERMARKETS AND HYPERMARKETS, BY CATEGORY , %, EUROPE, 2022 VS 2029
- Figure 118:
- VOLUME OF DAIRY MARKET SOLD VIA OTHERS (WAREHOUSE CLUBS, GAS STATIONS, ETC.), METRIC TONNES, EUROPE, 2017 - 2030
- Figure 119:
- VALUE OF DAIRY MARKET SOLD VIA OTHERS (WAREHOUSE CLUBS, GAS STATIONS, ETC.), USD, EUROPE, 2017 - 2030
- Figure 120:
- VALUE SHARE OF DAIRY MARKET, SOLD VIA OTHERS (WAREHOUSE CLUBS, GAS STATIONS, ETC.), BY CATEGORY , %, EUROPE, 2022 VS 2029
- Figure 121:
- VOLUME OF DAIRY MARKET SOLD VIA ON-TRADE, METRIC TONNES, EUROPE, 2017 - 2030
- Figure 122:
- VALUE OF DAIRY MARKET SOLD VIA ON-TRADE, USD, EUROPE, 2017 - 2030
- Figure 123:
- VALUE SHARE OF DAIRY MARKET, SOLD VIA ON-TRADE, BY CATEGORY , %, EUROPE, 2022 VS 2029
- Figure 124:
- VOLUME OF DAIRY MARKET BY COUNTRY, METRIC TONNES, EUROPE, 2017 - 2030
- Figure 125:
- VALUE OF DAIRY MARKET BY COUNTRY, USD, EUROPE, 2017 - 2030
- Figure 126:
- VOLUME SHARE OF DAIRY MARKET, BY COUNTRY , %, EUROPE, 2017 VS 2023 VS 2029
- Figure 127:
- VALUE SHARE OF DAIRY MARKET, BY COUNTRY , %, EUROPE, 2017 VS 2023 VS 2029
- Figure 128:
- VOLUME OF DAIRY MARKET, METRIC TONNES, BELGIUM, 2017 - 2030
- Figure 129:
- VALUE OF DAIRY MARKET, USD, BELGIUM, 2017 - 2030
- Figure 130:
- VALUE SHARE OF DAIRY MARKET, BY CATEGORY , %, BELGIUM, EUROPE, 2022 VS 2029
- Figure 131:
- VOLUME OF DAIRY MARKET, METRIC TONNES, FRANCE, 2017 - 2030
- Figure 132:
- VALUE OF DAIRY MARKET, USD, FRANCE, 2017 - 2030
- Figure 133:
- VALUE SHARE OF DAIRY MARKET, BY CATEGORY , %, FRANCE, EUROPE, 2022 VS 2029
- Figure 134:
- VOLUME OF DAIRY MARKET, METRIC TONNES, GERMANY, 2017 - 2030
- Figure 135:
- VALUE OF DAIRY MARKET, USD, GERMANY, 2017 - 2030
- Figure 136:
- VALUE SHARE OF DAIRY MARKET, BY CATEGORY , %, GERMANY, EUROPE, 2022 VS 2029
- Figure 137:
- VOLUME OF DAIRY MARKET, METRIC TONNES, ITALY, 2017 - 2030
- Figure 138:
- VALUE OF DAIRY MARKET, USD, ITALY, 2017 - 2030
- Figure 139:
- VALUE SHARE OF DAIRY MARKET, BY CATEGORY , %, ITALY, EUROPE, 2022 VS 2029
- Figure 140:
- VOLUME OF DAIRY MARKET, METRIC TONNES, NETHERLANDS, 2017 - 2030
- Figure 141:
- VALUE OF DAIRY MARKET, USD, NETHERLANDS, 2017 - 2030
- Figure 142:
- VALUE SHARE OF DAIRY MARKET, BY CATEGORY , %, NETHERLANDS, EUROPE, 2022 VS 2029
- Figure 143:
- VOLUME OF DAIRY MARKET, METRIC TONNES, RUSSIA, 2017 - 2030
- Figure 144:
- VALUE OF DAIRY MARKET, USD, RUSSIA, 2017 - 2030
- Figure 145:
- VALUE SHARE OF DAIRY MARKET, BY CATEGORY , %, RUSSIA, EUROPE, 2022 VS 2029
- Figure 146:
- VOLUME OF DAIRY MARKET, METRIC TONNES, SPAIN, 2017 - 2030
- Figure 147:
- VALUE OF DAIRY MARKET, USD, SPAIN, 2017 - 2030
- Figure 148:
- VALUE SHARE OF DAIRY MARKET, BY CATEGORY , %, SPAIN, EUROPE, 2022 VS 2029
- Figure 149:
- VOLUME OF DAIRY MARKET, METRIC TONNES, TURKEY, 2017 - 2030
- Figure 150:
- VALUE OF DAIRY MARKET, USD, TURKEY, 2017 - 2030
- Figure 151:
- VALUE SHARE OF DAIRY MARKET, BY CATEGORY , %, TURKEY, EUROPE, 2022 VS 2029
- Figure 152:
- VOLUME OF DAIRY MARKET, METRIC TONNES, UNITED KINGDOM, 2017 - 2030
- Figure 153:
- VALUE OF DAIRY MARKET, USD, UNITED KINGDOM, 2017 - 2030
- Figure 154:
- VALUE SHARE OF DAIRY MARKET, BY CATEGORY , %, UNITED KINGDOM, EUROPE, 2022 VS 2029
- Figure 155:
- VOLUME OF DAIRY MARKET, METRIC TONNES, REST OF EUROPE, 2017 - 2030
- Figure 156:
- VALUE OF DAIRY MARKET, USD, REST OF EUROPE, 2017 - 2030
- Figure 157:
- VALUE SHARE OF DAIRY MARKET, BY CATEGORY , %, REST OF EUROPE, EUROPE, 2022 VS 2029
- Figure 158:
- MOST ACTIVE COMPANIES BY NUMBER OF STRATEGIC MOVES, COUNT, EUROPE, 2017 - 2030
- Figure 159:
- MOST ADOPTED STRATEGIES, COUNT, EUROPE, 2017 - 2030
- Figure 160:
- VALUE SHARE OF MAJOR PLAYERS, %, EUROPE
Europe Dairy Industry Segmentation
Butter, Cheese, Cream, Dairy Desserts, Milk, Sour Milk Drinks, Yogurt are covered as segments by Category. Off-Trade, On-Trade are covered as segments by Distribution Channel. Belgium, France, Germany, Italy, Netherlands, Russia, Spain, Turkey, United Kingdom are covered as segments by Country.| Category | Butter | By Product Type | Cultured Butter | |
| Uncultured Butter | ||||
| Cheese | By Product Type | Natural Cheese | ||
| Processed Cheese | ||||
| Cream | By Product Type | Double Cream | ||
| Single Cream | ||||
| Whipping Cream | ||||
| Others | ||||
| Dairy Desserts | By Product Type | Cheesecakes | ||
| Frozen Desserts | ||||
| Ice Cream | ||||
| Mousses | ||||
| Others | ||||
| Milk | By Product Type | Condensed milk | ||
| Flavored Milk | ||||
| Fresh Milk | ||||
| Powdered Milk | ||||
| UHT Milk | ||||
| Sour Milk Drinks | ||||
| Yogurt | By Product Type | Flavored Yogurt | ||
| Unflavored Yogurt | ||||
| Distribution Channel | Off-Trade | Convenience Stores | ||
| Online Retail | ||||
| Specialist Retailers | ||||
| Supermarkets and Hypermarkets | ||||
| Others (Warehouse clubs, gas stations, etc.) | ||||
| On-Trade | ||||
| Country | Belgium | |||
| France | ||||
| Germany | ||||
| Italy | ||||
| Netherlands | ||||
| Russia | ||||
| Spain | ||||
| Turkey | ||||
| United Kingdom | ||||
| Rest of Europe | ||||
Need A Different Region or Segment?
Customize Now
Market Definition
- Butter - Butter is a yellow-to-white solid emulsion of fat globules, water, and inorganic salts produced by churning the cream from cows’ milk
- Dairy - Dairy product include milk and any of the foods made from milk, including butter, cheese, ice cream, yogurt, and condensed and dried milk.
- Frozen Desserts - Frozen dairy dessert means and includes products containing milk or cream and other ingredients which are frozen or semi-frozen prior to consumption, such as ice milk or sherbet, including frozen dairy desserts for special dietary purposes, and sorbet
- Sour Milk Drinks - Sour milk is thick, curdled milk, with a sour taste, obtained from the fermentation of milk. Sour milk drinks such as kefir, laban, buttermilk have been considered in the study
| Keyword | Definition |
|---|---|
| Cultured Butter | Cultured butter is prepared by having the raw butter go through chemical processing and has been added with certain emulsifiers and foreign ingredients. |
| Uncultured Butter | This type of butter is one which has not been processed in any way |
| Natural Cheese | The type of cheese in its most natural form. It is made from natural and simple products and ingredients, including fresh and natural salts, natural colors, enzymes, and high-quality milk. |
| Processed Cheese | Processed cheese undergoes the same processes as natural cheese; however, it requires more steps and many different forms of ingredients. Making processed cheese involves melting natural cheese, emulsifying it, and adding preservatives and other artificial ingredients or colorings. |
| Single Cream | Single cream contains around 18% fat. It’s a single layer of cream that appears over boiled milk. |
| Double Cream | Double cream contains 48% fat, more than double the amount of fat of single cream. It’s heavier and thicker than single cream |
| Whipping Cream | This has a much higher fat percentage than single cream (36%). Used to top cakes, pies, and puddings and as a thickener for sauces, soups, and fillings. |
| Frozen Desserts | Desserts that are meant to be eaten in frozen condition. E.g., sherbets, sorbets, frozen yogurts |
| UHT Milk (Ultra-high temperature milk) | Milk heated at a very high temperature. Ultra-high-temperature processing (UHT) of milk involves heating for 1–8 sec at 135–154°C. which kills the spore-forming pathogenic microorganism, resulting in a product with a shelf-life of several months. |
| Non-dairy butter/Plant-based butter | Butter made from plant-derived oil such as coconut, palm, etc. |
| Non-dairy Yogurt | Yogurt made from typically made from nuts, like almonds, cashews, coconuts, and even other foods like soybeans, plantains, oats, and peas |
| On-trade | It refers to restaurants, QSRs, and bars. |
| Off-trade | It refers to supermarkets, hypermarkets, on-line channels, etc. |
| Neufchatel cheese | One of the oldest kinds of cheese in France. It is a soft, slightly crumbly, mold-ripened, bloomy-rind cheese made in the Neufchâtel-en-Bray region of Normandy. |
| Flexitarian | It refers to a consumer preferring a semi-vegetarian diet, that is centered on plant foods with limited or occasional inclusion of meat. |
| Lactose Intolerance | Lactose intolerance is a reaction in digestive system to lactose, the sugar in milk. It causes uncomfortable symptoms in response to the consumption of dairy products. |
| Cream Cheese | Cream cheese is a soft and creamy fresh cheese with a tangy taste made from milk and cream. |
| Sorbets | Sorbet is a frozen dessert made using ice combined with fruit juice, fruit purée, or other ingredients, such as wine, liqueur, or honey. |
| Sherbet | Sherbet is a sweetened frozen dessert made with fruit and some sort of dairy product such as milk or cream. |
| Shelf stable | Foods that can be safely stored at room temperature, or "on the shelf," for at least one year and do not have to be cooked or refrigerated to eat safely. |
| DSD | Direct Store Delivery is the process in supply chain management wherein the product is delivered from manufacturing plant directly to the retailer. |
| OU Kosher | Orthodox Union Kosher is a kosher certification agency based in New York City. |
| Gelato | Gelato is a frozen creamy dessert made with milk, heavy cream and sugar. |
| Grass-fed Cows | Grass-fed cows are allowed to graze in pastures, where they eat a variety of grasses and clover. |
Need More Details on Market Definition?
Ask a Question
Research Methodology
Mordor Intelligence follows a four-step methodology in all our reports.
- Step-1: Identify Key Variables: In order to build a robust forecasting methodology, the variables and factors identified in Step 1 are tested against available historical market numbers. Through an iterative process, the variables required for market forecast are set, and the model is built on the basis of these variables.
- Step-2: Build a Market Model: Market-size estimations for the forecast years are in nominal terms. Inflation is not a part of the pricing, and the average selling price (ASP) is kept constant throughout the forecast period for each country.
- Step-3: Validate and Finalize: In this important step, all market numbers, variables, and analyst calls are validated through an extensive network of primary research experts from the market studied. The respondents are selected across levels and functions to generate a holistic picture of the market studied.
- Step-4: Research Outputs: Syndicated Reports, Custom Consulting Assignments, Databases & Subscription Platforms

Get More Details On Research Methodology
Download PDF


