
Market Overview
| Study Period | 2020 - 2031 |
|---|---|
| Forecast Data Period | 2026 - 2031 |
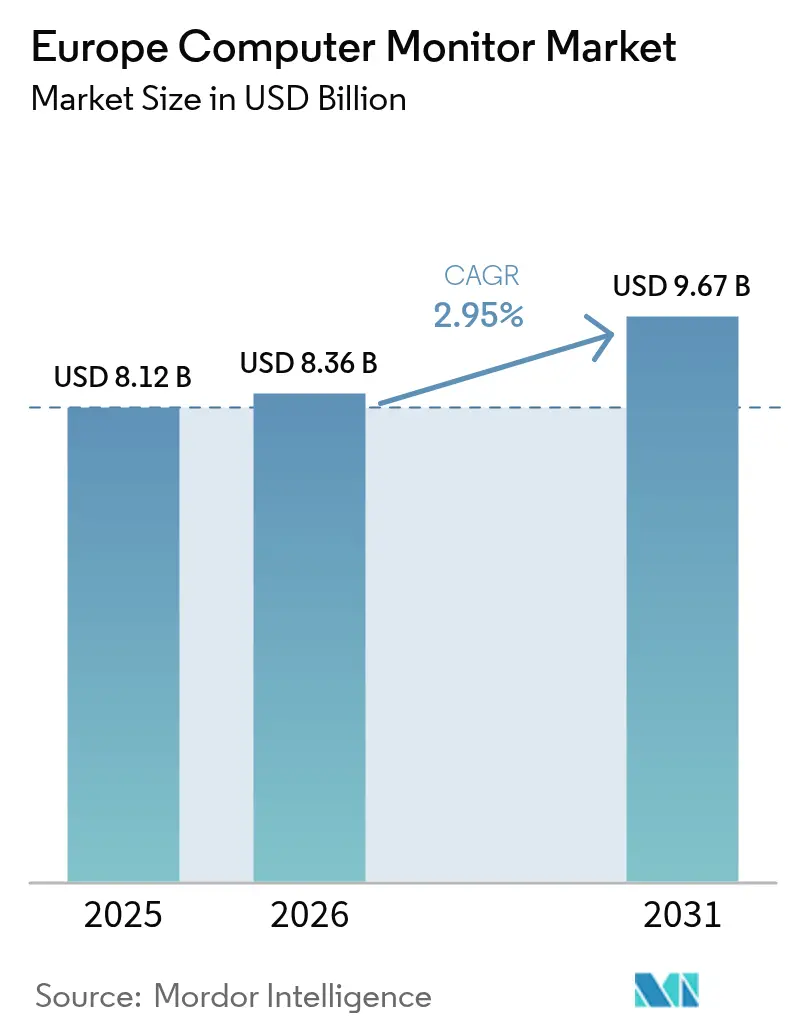
| Base Year Market Size (2025) | USD 8.12 Billion |
| Market Size (2026) | USD 8.36 Billion |
| Market Size (2031) | USD 9.67 Billion |
| Growth Rate (2026 - 2031) | 2.95% CAGR |
| Market Concentration | Medium |
Major Players *Disclaimer: Major Players sorted in no particular order Image © Mordor Intelligence. Reuse requires attribution under CC BY 4.0. | |
Europe Computer Monitor Market Analysis by Mordor Intelligence
The European computer monitor market size in 2026 is estimated at USD 8.36 billion, growing from 2025 value of USD 8.12 billion with 2031 projections showing USD 9.67 billion, growing at 2.95% CAGR over 2026-2031. The measured expansion of the European computer monitor market reflects a mature base that still finds incremental growth from hybrid-work refresh cycles, mainstream gaming upgrades, and new energy-efficient form factors. Corporate buyers continue to anchor demand, but the share of high-refresh gaming displays is rising as esports venues proliferate and household gaming setups become more sophisticated. Supply-side headwinds, including panel constraints and the EU’s Right-to-Repair rules, are pushing manufacturers toward premium segments where margins remain defensible. Meanwhile, Germany’s stringent sustainability criteria, Spain’s esports boom, and region-wide UHD migration collectively set the tone for product development and channel strategies across the European computer monitor market.[1]Environment Directorate-General, “EU GPP Criteria for Computers and Computer Monitors,” EUROPEAN COMMISSION, ec.europa.eu
Key Report Takeaways
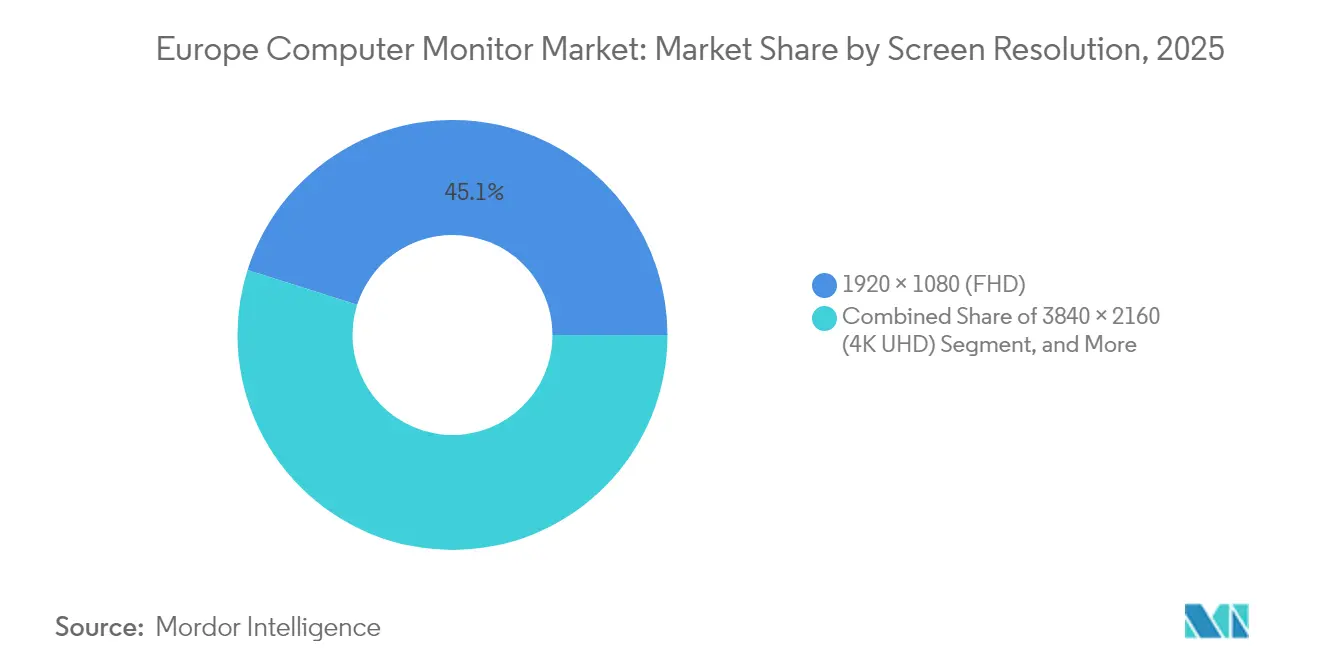
- By screen resolution, Full HD captured 45.12% share of the European computer monitor market size in 2025; the 4K UHD category is advancing at a 4.55% CAGR between 2026-2031.
- By panel technology, IPS held a 39.25% share of the European computer monitor market in 2025, whereas OLED is projected to post the fastest 4.62% CAGR to 2031.
- By screen size, the 22"-24.5" bracket accounted for 44.20% of 2025 revenue of the European computer monitor market, while ≥28" models are projected to grow at a 4.12% CAGR during the forecast period.
- By refresh rate, the 76-144 Hz tier dominated with 49.30% share of the European computer monitor market in 2025, and the ≥165 Hz tier is slated to climb at a 3.85% CAGR.
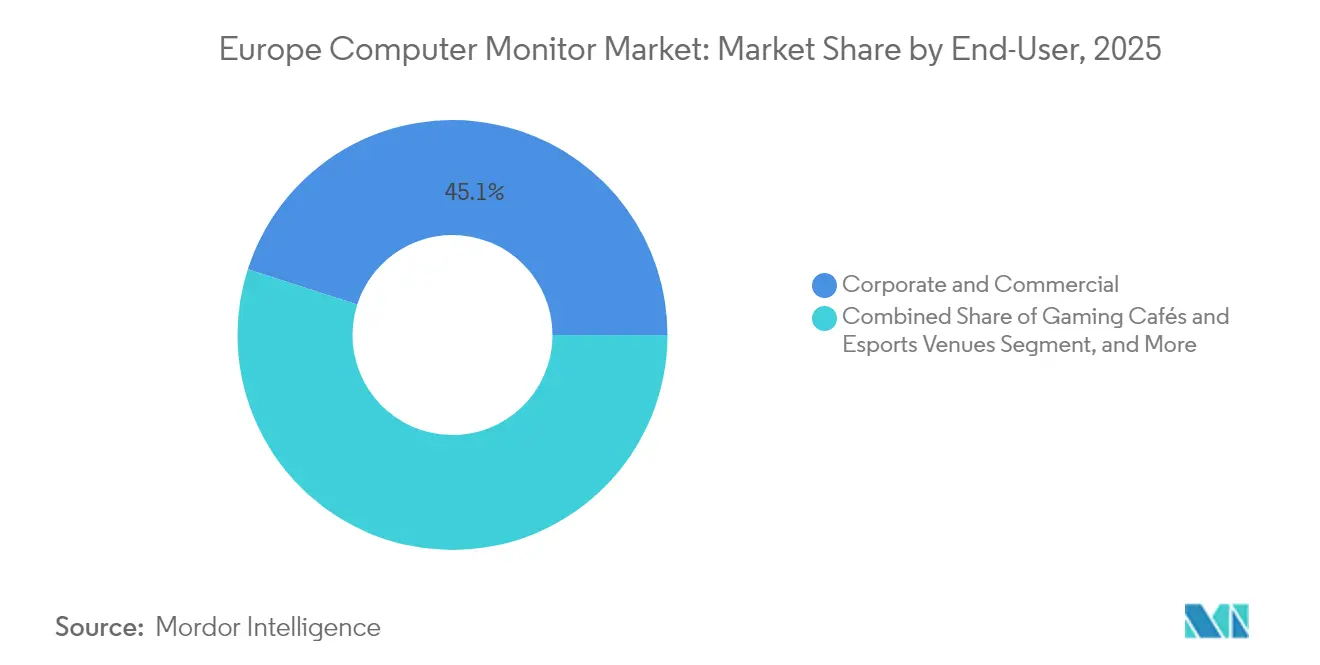
- By end-user, corporate and commercial deployments represented 45.06% of 2025 sales of the European computer monitor market, but gaming cafés and esports venues are poised for a 5.05% CAGR to 2031.
- By sales channel, offline retail and distribution secured 60.85% share of the European computer monitor market in 2025, whereas online and DTC avenues are projected to rise at a 3.95% CAGR over the same horizon.
- By geography, Germany led with 28.40% of the European computer monitor market share in 2025, while Spain is forecast to expand at a 4.85% CAGR through 2031.
Note: Market size and forecast figures in this report are generated using Mordor Intelligence’s proprietary estimation framework, updated with the latest available data and insights as of 2026.
Europe Computer Monitor Market Trends and Insights
Drivers Impact Analysis*
| Driver | (~) % Impact on CAGR Forecast | Geographic Relevance | Impact Timeline |
|---|---|---|---|
| Persistent hybrid-work monitor refresh cycles | +0.8% | Germany, UK, France, Netherlands | Medium term (2-4 years) |
| Rapid uptake of high-refresh gaming monitors | +0.9% | Spain, Germany, UK, Nordic countries | Short term (≤ 2 years) |
| Corporate demand for energy-efficient displays | +0.5% | EU-wide, strongest in Germany and Netherlands | Long term (≥ 4 years) |
| Transition toward UHD and WQHD resolutions | +0.7% | Germany, UK, France, Benelux | Medium term (2-4 years) |
| EU ecolabel rules accelerating panel innovation | +0.4% | EU-wide regulatory compliance | Long term (≥ 4 years) |
| Expansion of tele-health imaging monitors | +0.3% | Germany, France, Netherlands, Nordic countries | Medium term (2-4 years) |
| Source: Mordor Intelligence | |||
Persistent Hybrid-Work Monitor Refresh Cycles
Hybrid work adoption keeps offices and homes equally important. Dual-screen setups are now standard, and procurement teams in Germany and the Netherlands increasingly enforce EU Green Public Procurement criteria that reward energy-efficient models. EIZO’s Class A FlexScan releases illustrate how vendors secure contracts by offering lower lifetime energy costs. Rather than large one-time roll-outs, companies are staging staggered upgrades that blend central-office orders with employee stipend-funded home purchases, sustaining a rolling demand curve for the European computer monitor market.
Rapid Uptake of High-Refresh Gaming Monitors
Esports venue expansion and mainstream gaming enthusiasm are moving refresh-rate expectations from 144 Hz toward 240 Hz and beyond. Spain shows the steepest ascent, driven by new gaming cafés that specify tournament-grade displays. Partnerships such as AGON by AOC with Red Bull Esports illustrate the direct link between sponsor visibility and monitor specification upgrades.[2]“AGON by AOC and Red Bull’s Gaming Partnership Continues,” AOC, aoc.com Portable high-refresh units from ViewSonic also enjoy traction among players who attend both home and LAN events, reinforcing demand diversity within the European computer monitor market.[3]“ViewSonic Leads Global Portable and Touch Monitor Market in Q3 2024,” VIEWSONIC, viewsonic.com
Corporate Demand for Energy-Efficient Displays
Enterprises integrate monitor energy draws into ESG scorecards, expanding total cost of ownership models to seven-year horizons. Revised EU GPP requirements prescribe strict kWh caps, prompting IT departments to justify every watt saved. German and Dutch firms report electricity savings of 20%-30% after fleet-wide upgrades to low-power backlit monitors. This shift underpins premium pricing tolerance for Class A-rated units and reinforces manufacturer roadmaps centered on power-efficient panels.
Transition Toward UHD and WQHD Resolutions
Productivity-driven users in creative, financial, and medical settings anchor WQHD adoption as a step-up sweet spot. Meanwhile, 4 K UHD shipment growth rests on premium niches needing ultra-high pixel density trading desks, surgical theaters, and architectural studios. Mini-LED backlighting enables UHD brightness levels suitable for clinical imaging, as evidenced by Sony’s LMD-32M1MD launch. With EU corporate budgets favoring monitors that lengthen replacement cycles, higher-resolution panels present a future-proofing rationale that sustains demand.
Restraints Impact Analysis*
| Restraint | (~) % Impact on CAGR Forecast | Geographic Relevance | Impact Timeline |
|---|---|---|---|
| Panel supply-chain tightness and price inflation | -0.7% | EU-wide, particularly affecting budget segments | Short term (≤ 2 years) |
| Component shortages raising ASPs | -0.5% | EU-wide, strongest impact on mid-range segments | Medium term (2-4 years) |
| EU right-to-repair slowing replacement cycles | -0.4% | EU-wide regulatory impact | Long term (≥ 4 years) |
| Laptop-first workforce preference | -0.3% | Germany, UK, Nordic countries | Medium term (2-4 years) |
| Source: Mordor Intelligence | |||
Panel Supply-Chain Tightness and Price Inflation
LCD capacity reductions coincide with OLED ramp-ups, leaving a production gap that inflates glass and DDIC costs. Lead times for mainstream panels stretch to 16-20 weeks, forcing brands to favor high-margin models and sacrificing entry-level assortment breadth. The imbalance is set to persist until at least 2028, restraining unit growth in price-sensitive bands of the European computer monitor market.
EU Right-to-Repair Slowing Replacement Cycles
Directive 2024/1799 requires spare-part availability for seven years and promotes reparability scores, enabling organizations to extend monitor lifecycles to a decade. Leasing firms report 96% refurbish-and-resell rates on returned displays, underscoring a secondary-market expansion that cannibalizes new-build volumes and tempers upgrade frequency.
*Our forecasts treat driver/restraint impacts as directional, not additive. The impact forecasts reflect baseline growth, mix effects, and variable interactions.
Segment Analysis
By Screen Resolution: Premium Segments Drive Innovation
Full HD held 45.12% of the European computer monitor market share in 2025, underscoring its continued role as the default specification for cost-conscious buyers. Yet the 4 K UHD tier is advancing at a 4.55% CAGR, signaling robust appetite among creative professionals, medical institutions, and high-end gamers who equate pixel density with productivity and visual fidelity. OLED and Mini-LED innovations allow 4 K panels to achieve HDR brightness and accurate color gamuts, removing previous performance barriers. The result is a multi-layered pricing ladder in which UHD screens capture premium margins while FHD volumes absorb budget demand, collectively stabilizing the European computer monitor market.
WQHD serves as the mid-market bridge, favored by esports players who need higher sharpness without the GPU burden of 4 K rendering. Manufacturers leverage this zone to upsell existing owners through incremental refresh-rate boosts and curvature options. Legacy resolutions below 1080p shrink annually as offices retire aging assets, while specialty formats cater to medical carts and industrial control rooms. Looking ahead, the European computer monitor industry expects resolution mix shifts to be gradual, restrained by IT budget approvals and emerging regulations that prioritize energy efficiency over sheer pixel count.


By Panel Technology: OLED Emergence Reshapes Premium Segments
IPS LCD captured 39.25% share in 2025, prized for viewing-angle stability and an entrenched supply ecosystem. OLED, projected at a 4.62% CAGR, disrupts the premium stripe by delivering infinite contrast and near-instant response times, critical features for competitive gaming and cinematic content creation. Samsung’s QD-OLED collaborations with Dell illustrate how panel innovation translates into channel differentiation. VA and TN remain cost-effective for curved and entry-level gaming SKUs, yet the pricing gap narrows as OLED yields climb.
Mini-LED backlit IPS acts as an interim solution, offering zone dimming that brings HDR-level brightness without full emitter changeovers. This hybrid path helps vendors meet evolving EU power standards, since local dimming reduces average luminance draw. In parallel, manufacturers hedge supply disruptions by diversifying panel sourcing, balancing mature LCD lines with exploratory OLED capacity to protect the European computer monitor market continuity.
By Screen Size: Large-Format Growth Reflects Productivity Demands
The 22"-24.5" band dominated 2025 with 44.20% share, aligning with corporate desk ergonomics and price ceilings for bulk roll-outs. However, ≥28" displays are forecast for a 4.12% CAGR, propelled by remote workers seeking single-monitor setups that substitute for multi-screen arrays. Ultrawide formats (34"-49") gain traction in gaming cafés and creative studios, where immersive field-of-view enhances both entertainment and timeline editing workflows.
Hardware makers now bundle desk mounts and cable-management kits to offset footprint concerns and to comply with EU health-and-safety guidelines on workstation setups. Meanwhile, ≤21.5" screens persist in factory terminals and secondary display roles. The European computer monitor market size for large formats remains constrained by shipping costs and packaging waste rules, yet falling per-inch LCD pricing is eroding the premium delta and encouraging upgrades.

By Refresh Rate: Gaming Drives High-Performance Adoption
Units rated 76-144 Hz held 49.30% share in 2025, marking the mainstreaming of elevated refresh as a standard spec even for office-bound devices that benefit from smoother scrolling. The ≥165 Hz bracket will expand at a 3.85% CAGR through 2031 thanks to esports demand for 240 Hz and 360 Hz benchmarks. Tournament organizers increasingly publish approved-equipment lists that favor certified low-latency models, and brands use such endorsements to escalate ASPs within the European computer monitor market.
Corporate buyers start specifying 120 Hz for ergonomic reasons, citing lower eye fatigue scores in telecommuting surveys. Budget segments at ≤75 Hz persist mainly in public-sector tenders with strict ceiling prices. Over time, economies of scale and panel oversupply may push 144 Hz to baseline, compressing price tiers and compelling vendors to differentiate via color accuracy and connectivity rather than raw refresh metrics.
By End-User: Gaming Venues Accelerate Market Growth
Corporate and commercial deployments represented 45.06% of 2025 shipments as hybrid-work programs triggered simultaneous home-office and headquarters refresh cycles. Yet gaming cafés and esports arenas will post a 5.05% CAGR, reflecting continent-wide investments in competitive gaming infrastructure. Venue operators sign multi-year supply agreements that guarantee uniform display performance across all stations, enabling bulk orders that stabilize quarterly demand.
Consumer home setups occupy a sizeable middle tier, blending productivity and entertainment and steering monitor purchases toward versatile specs. Creative and media professionals require factory-calibrated color and thus gravitate to premium SKUs, while hospitals invest in medically compliant panels for tele-diagnostics. Industrial and educational segments remain niche but steady, illustrating the European computer monitor industry’s need to address divergent technical standards within a single region.
By Sales Channel: Online Growth Accelerates Digital Commerce
Offline chains held a 60.85% share in 2025 as buyers still preferred hands-on evaluation, especially for high-value models. However, online outlets will enjoy a 3.95% CAGR, supported by richer product configurators, AR try-out tools, and next-day fulfillment. Vendors exploit DTC portals to capture higher margins and gather user telemetry, informing firmware updates and feature roadmaps. B2B portals such as Bechtle integrate procurement APIs, enabling automated reordering tied to device-management dashboards.
Channel coexistence remains crucial: physical retailers host esports demo corners and medical imaging booths that online cannot replicate, but e-commerce excels in stocking niche variants and facilitating cross-border deliveries. Thus, a hybrid channel strategy becomes indispensable for sustaining the European computer monitor market growth.
Geography Analysis
Germany contributed 28.40% of the 2025 value, underpinned by rigorous corporate ESG mandates and a manufacturing economy that values robust, long-life hardware. Local enterprises deploy energy-class screening as a bid-qualification factor, rewarding OEMs that publish full lifecycle disclosures. The prevalence of dual-screen desk policies and specialized industrial monitoring further insulates demand from cyclical slowdowns, anchoring the European computer monitor market.
Spain is set to outpace peers at a 4.85% CAGR as government-sponsored esports hubs and gaming-focused retail rollouts multiply. Younger demographics embrace high-refresh panels, and café chains upgrade fleets every two years to maintain a competitive patron experience. The acceleration drives vendor interest in localized warehousing to shorten replenishment cycles and avoid currency-related pricing swings. Elsewhere, the UK prioritizes productivity and hybrid-work ergonomics, France leans toward color-critical creative use cases, while Italy reflects broader consumer electronics modernization. Belgium and the Netherlands exhibit stringent energy-consumption standards, rallying behind low-power OLED and Mini-LED designs. Nordic countries, bundled in Rest of Europe, consistently adopt cutting-edge OLED gaming monitors, aided by high disposable income and strong broadband infrastructure. Collectively, these territories create a patchwork of opportunities demanding tailored go-to-market playbooks within the European computer monitor market.
Regulatory Landscape
Computer monitors sold across the EU fall under the electronic displays framework led by Commission Regulation (EU) 2019/2021 (ecodesign requirements) and Delegated Regulation (EU) 2019/2013 (energy labelling). Together, these rules set performance thresholds and the A-to-G label used in procurement and retail. The European Commission also moved to refresh this rule set by launching a public consultation on updating ecodesign and labelling rules for electronic displays on 13 November 2024, which keeps compliance roadmaps active for brands selling into Europe.
Broader compliance requirements shape specification and lifecycle choices as well. Employers must meet Directive 90/270/EEC minimum safety and health requirements for display screen equipment at workstations, which influences corporate and public-sector tender specifications for legibility and ergonomics. Hazardous-substance controls remain tied to RoHS: the European Commission opened a stakeholder consultation window tied to RoHS exemption and revocation requests (Pack 29) running from 29 May 2026 to 1 August 2026, while Ireland implemented RoHS-related changes via S.I. No. 110/2026. Together, these updates reinforce the need for manufacturers and importers to maintain documentation and component-level substance traceability in the region.
Value Chain Analysis
The Europe computer monitor value chain starts with upstream panel and key-component supply (LCD, OLED, backlights, driver ICs, power components), followed by monitor ODM/OEM integration, firmware and feature validation, and then final configuration with region-specific compliance before distribution. Europe remains structurally reliant on imported panels and finished monitors, while localized activity concentrates on final assembly, configuration, and specialized professional or industrial displays. Regional activity in niche display manufacturing and integration includes Leyard Europe and DISPLAY VISIONS.
Channel execution then splits between B2B distributors and integrators (for corporate and public-sector deployments), consumer electronics retailers, and brand DTC and e-commerce platforms that support cross-border fulfillment. Near-term value-chain pressure points show up most clearly upstream: shifts in global LCD capacity and component availability tighten supply and raise costs for mainstream monitor SKUs, pushing brands toward higher-margin configurations. Panel technology transitions also create new sourcing dependencies and differentiation pathways, such as TCL CSOT beginning production of a 27-inch inkjet-printed OLED monitor panel on its Gen 5.5 line in Wuhan in July 2026, and Samsung Electronics shutting down its visual display production facility in Galanta, Slovakia in April 2026 (affecting MicroLED The Wall output). These manufacturing footprint changes outside conventional monitor assembly can still influence display component ecosystems and lead times for premium formats.
Competitive Landscape
Moderate fragmentation defines the competitive scene: traditional heavyweights Dell, HP, Samsung, and LG defend share through vertical integration and broad portfolios, whereas ASUS ROG, MSI, and BenQ ZOWIE attack premium gaming niches with esports credentials. Supply-chain turbulence advantages firms with multi-sourced panel strategies and in-house firmware teams capable of rapid spec pivots. Samsung Display’s QD-OLED partnerships with Dell stand out, pairing panel IP with branded marketing to command premium shelf space.[4]“Samsung Display and Intel Sign MoU to Accelerate AI PC Ecosystem,” SAMSUNG DISPLAY, samsung.com
Price competition surrenders ground to spec-based rivalry. Investment now targets 480 Hz prototypes, Mini-LED dimming algorithms, and on-device AI that adjusts color profiles by application. European makers such as EIZO leverage service networks to lock in medical and financial clients requiring calibration certificates. Chinese entrants seize budget layers, offering feature-matched SKUs at lower ASPs but must navigate EU ecolabel thresholds to scale. Overall, the European computer monitor market continues to reward innovation depth over volume pricing, leading to a dispersed but technology-intensive playing field.
Europe Computer Monitor Industry Leaders
Dell Technologies Inc.
HP Inc.
Lenovo Group Limited
TPV Technology Limited (AOC and Philips)
ASUSTeK Computer Inc.
- *Disclaimer: Major Players sorted in no particular order


Market Opportunities and Future Outlook
Energy compliance and procurement-led sustainability remain a clear whitespace for differentiation in Europe, where Commission Regulation (EU) 2019/2021 and the EU energy label regime require vendors to balance feature sets with measured power limits across on-mode and standby states. That combination creates room for product lines aimed at enterprise and public-sector buyers using EU Green Public Procurement and energy label screening, including fleets designed around lower kWh use, manageable standby behavior, and long-life serviceability consistent with right-to-repair direction in the region.
On the product side, premium refresh cycles are being shaped by panel architectures and multi-mode designs that let brands sell higher performance without forcing a single resolution-refresh tradeoff. Recent launches reflect this shift: ASUS Republic of Gamers introduced 4K Tandem RGB OLED models (ROG Swift OLED PG27UCWM and PG32UCWM), and also unveiled a Triple Mode concept in the ROG Strix XG27UCMG that switches between 4K and higher-refresh lower-resolution modes. AOC debuted the AGON PRO AGP277QKDC using 4th-gen Tandem WOLED, and Acer introduced ProDesigner QD-OLED monitors at COMPUTEX 2026. These moves expand the premium addressable mix across gaming and color-critical professional use cases, supporting higher ASP positioning even as mainstream LCD supply cycles and EU durability expectations pressure entry-level replacement volumes.
Recent Industry Developments
- July 2026: ASUS Republic of Gamers announced the availability of the ROG Swift OLED PG27UCWM and PG32UCWM gaming monitors using 4K Tandem RGB OLED technology. The launch raises the performance ceiling in the premium gaming tier while giving brands a clearer path to differentiate on panel architecture rather than incremental refresh-rate bumps alone.
- August 2025: ASUS Republic of Gamers announced new OLED gaming monitors at Gamescom 2025, including the ROG Swift OLED PG27AQWP-W and ROG Strix OLED XG27AQWMG featuring Tandem OLED technology. The announcement reinforced the shift toward next-generation OLED stacks in mainstream gaming lineups and increased competitive pressure on other vendors to secure advanced panel supply and tuning capabilities.
- January 2025: Dell Technologies introduced new monitors at CES 2025, including models featuring IPS Black technology and a 32-inch 4K QD-OLED option. This expanded QD-OLED visibility in branded monitor portfolios and strengthened the premium professional and prosumer segment where contrast and color performance can justify higher price points.


Research Methodology Framework and Report Scope
Market Definition and Coverage
For this report, the market covers revenues generated from sales of computer monitors across Europe, counted at the product level and captured in USD value terms, across consumer and commercial buying channels.
Scope exclusions: We do not count TVs, smartphones and tablets, projector systems, or professional large format signage displays that are not sold and used as computer monitors.
Segmentation Overview
- By Screen Resolution
- 1366 × 768
- 1920 × 1080 (FHD)
- 2560 × 1440 (QHD)
- 3840 × 2160 (4K UHD)
- Other Resolutions
- By Panel Technology
- IPS LCD
- VA LCD
- TN LCD
- OLED
- Mini-LED
- By Screen Size (Diagonal)
- ≤ 21.5″
- 22″-24.5″
- 25″-27″
- ≥ 28″
- By Refresh Rate
- ≤ 75 Hz
- 76-144 Hz
- ≥ 165 Hz
- By End-User
- Consumer
- Corporate and Commercial
- Gaming Cafés and Esports Venues
- Creative and Media Professionals
- Healthcare and Diagnostics
- Other End-Users
- By Sales Channel
- Offline (Retail and Distribution)
- Online (E-commerce and DTC)
- By Country
- Germany
- United Kingdom
- France
- Italy
- Spain
- Belgium
- Netherlands
- Rest of Europe
Data Sources, Market Sizing, and Validation
Desk Research
Desk research was used to map demand signals, price movements, and the policy context that shapes replacement cycles in Europe. We reviewed public statistics and publications such as Eurostat, OECD ICT indicators, ITU digital adoption datasets, and trade and tariff disclosures from the European Commission, which help indicate device penetration and cross-border flow patterns. For product and technology context, we also used sources such as ENERGY STAR and EU energy labeling material, plus technical and adoption commentary in peer-reviewed display and ergonomics journals.
On the supply and go-to-market side, we referenced company annual reports, investor presentations, and reputable press coverage to understand shipment priorities, channel mix shifts, and mix-driven ASP changes (for example, higher refresh rate and higher resolution monitors pulling up value). Select paid subscriptions were used only where they add structure, such as company financials and news intelligence, patent databases for feature direction, and shipment-level import and export datasets for validation checks. The desk research sources mentioned here are illustrative only, and many other public documents and datasets were also referred to for data collection, validation, and clarification.
Primary Interviews and Surveys
Primary work focused on validating what actually drives value in Europe, including replacement timing, channel margins, and pricing steps when buyers move from basic office screens to gaming and creative-use monitors. We spoke with a mix of brands, distributors, large retailers, and commercial buyers across major European countries, and then used these inputs to close gaps left by public data and to pressure-test assumptions before finalizing the model.
Distribution of primary research fieldwork respondents
| Company type | Respondent position | Region |
|---|---|---|
| Top tier: 34% | CXOs: 19% | |
| Mid tier: 46% | Functional/Unit leaders: 25% | |
| Smaller Players: 20% | Managers: 56% |
Market-Sizing & Forecasting
Sizing was built using a top-down and bottom-up approach, where Europe demand is first reconstructed from device-installed base and replacement behavior, and then converted into value using segment-level pricing. In practice, we start with PC and workstation footprint signals, align them with monitor attachment rates and replacement cycles, and then apply mix weights for key specs that shift value. To keep the totals realistic, selective bottom-up checks were run using sampled channel pricing, typical configuration bundles, and supplier and distributor roll-ups shared during interviews.
Several market fingerprints were tracked because they strongly influence monitor value in Europe, including average screen size mix, resolution shifts (for example, FHD to QHD and 4K), refresh-rate adoption in gaming, USB-C and docking-led demand in offices, and the split between offline distribution and e-commerce. Where public data did not break out the mix cleanly by country, we used interview-derived ranges and then normalized them against trade flows and vendor commentary so the model did not drift. Forecasts were developed using scenario analysis, where macro conditions and enterprise refresh cadence assumptions were adjusted, and then reviewed with experts to pick a realistic central case for 2026 to 2031.
Data Validation & Update Cycle
Outputs were cross-checked against independent signals such as import and export trends, consumer electronics spending direction, and reported vendor performance in the region. When a country or channel showed an unusual jump in value versus units, the ASP and mix assumptions were re-checked and, where needed, respondents were re-contacted to confirm whether the change was real or timing-related. Before sign-off, the model and assumptions go through a multi-step analyst review so that calculation logic, unit conversions, and currency handling are consistent.
Reports are refreshed on an annual cycle, and interim updates are made when material events occur, such as sharp pricing swings, new energy efficiency rules, or major channel shifts. Right before delivery, a final review pass is done so clients receive the most current view supported by the latest available public releases and field feedback.
Mordor Intelligence's Europe Computer Monitor Market Size Versus Other Published Estimates
Published market values for Europe computer monitors can vary even when the product sounds the same, because the study boundary and the value build-up steps are not always identical. Differences usually come from what gets counted as a computer monitor, which countries are included under Europe, and how pricing and mix upgrades are carried into the forecast years.
By tracking refresh-cycle drivers and checking mix shifts by resolution, refresh rate, and channel, Mordor Intelligence keeps the total tied to monitor-only revenues in Europe, since some estimates fold in adjacent display categories or apply a faster ASP ramp without the same country-level validation checks.
Benchmark comparison
| Source | Market Size | Gaps in Research Methodology |
|---|---|---|
| Mordor Intelligence | USD 8.36 B (2026) | |
| Regional Consultancy A | USD 12.80 B (2026) | This estimate appears to use a wider display scope, which can pull in large format and signage-style screens alongside standard PC monitors, and it also assumes a higher value uplift from premium specs across the period. |
| Industry Publisher B | USD 8.00 B (2022) | This number is anchored to an older base year and is likely closer to a unit-led view with simplified pricing, which can understate the impact of recent gaming and USB-C office upgrades on value. |
The spread in results is mainly explained by scope edges and how quickly price and mix are allowed to rise as buyers upgrade. When the scope stays monitor-only and assumptions are repeatedly checked against trade signals, channel feedback, and country patterns, the resulting market size is easier to follow and to replicate.


Key Questions Answered in the Report
What is the current value of the Europe computer monitor market?
It stands at USD 8.36 billion in 2026.
How fast will the market grow through 2031?
The forecast CAGR is 2.95%, pushing revenues to USD 9.67 billion by 2031.
Which screen resolution is growing the quickest?
4 K UHD leads with a 4.55% CAGR between 2026-2031.
Why are gaming cafés important for future sales?
They represent the fastest-growing end-user segment at a 5.05% CAGR, driving demand for high-refresh displays.
How will EU sustainability rules affect monitor lifecycles?
Right-to-Repair mandates will extend usable life to at least seven years, slowing replacement demand but boosting premium repairable designs.
Which country currently dominates unit demand?
Germany holds 28.40% share thanks to large-scale corporate and industrial procurement.
Page last updated on:






