
Market Overview
| Study Period | 2019 - 2031 |
|---|---|
| Forecast Data Period | 2026 - 2031 |
| Base Year Market Size (2025) | USD 70.77 Billion |
| Market Size (2026) | USD 75.14 Billion |
| Market Size (2031) | USD 99.65 Billion |
| Growth Rate (2026 - 2031) | 5.81 % |
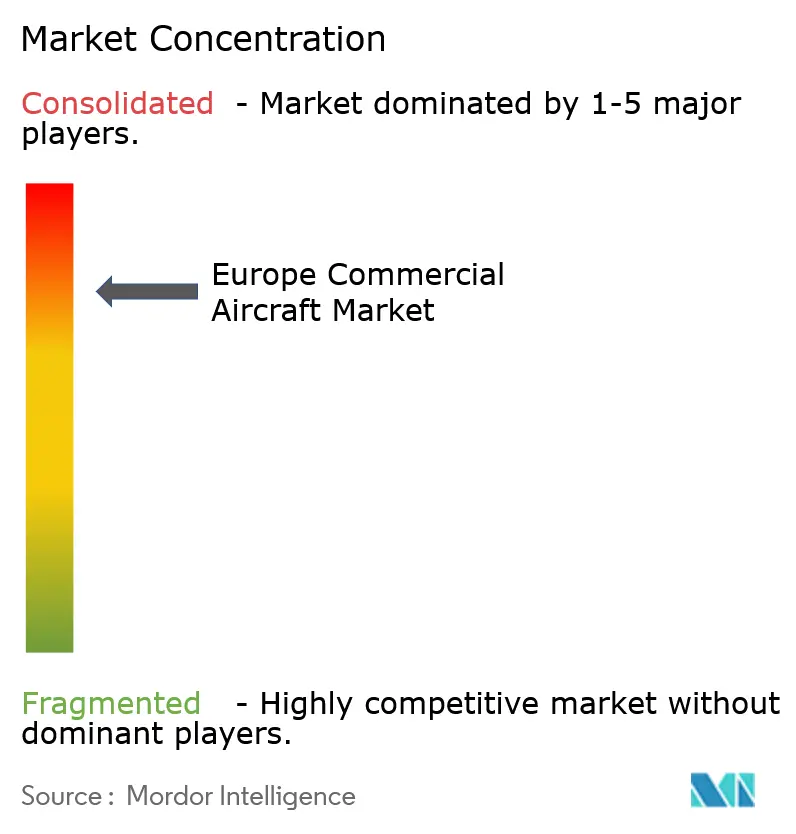
| Market Concentration | High |
Major Players *Disclaimer: Major Players sorted in no particular order Image © Mordor Intelligence. Reuse requires attribution under CC BY 4.0. | |
Europe Commercial Aircraft Market Analysis by Mordor Intelligence
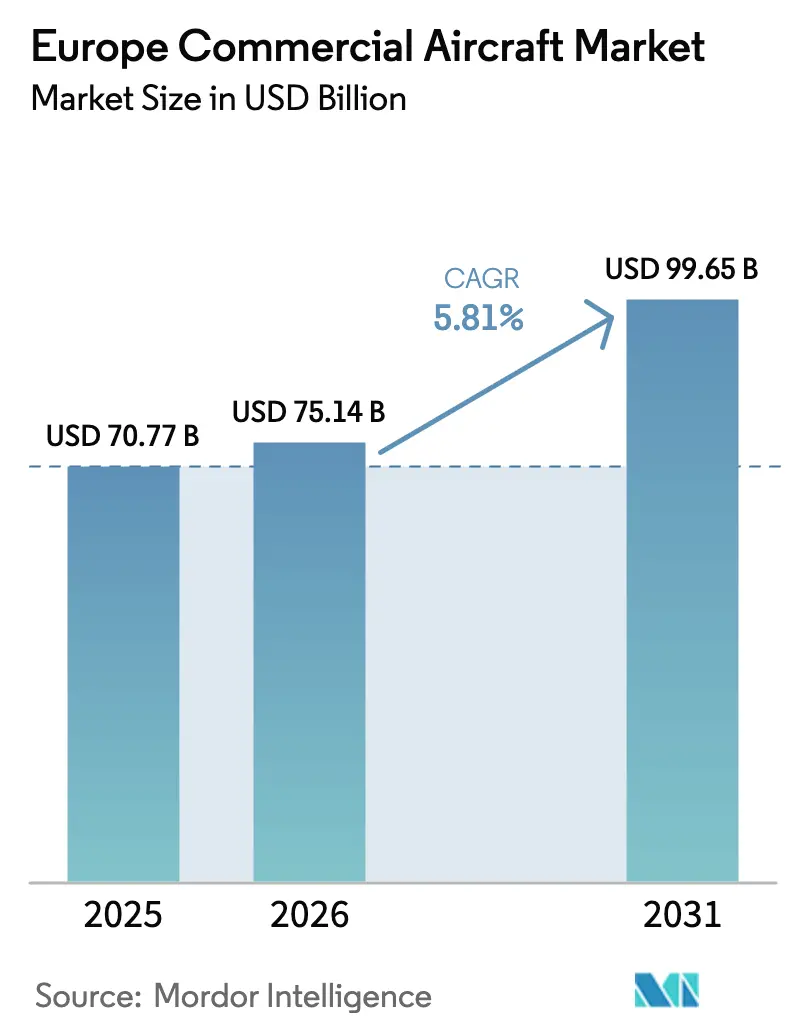
The Europe commercial aircraft market size is expected to grow from USD 70.77 billion in 2025 to USD 75.14 billion in 2026 and is forecasted to reach USD 99.65 billion by 2031 at a 5.81% CAGR over 2026-2031. Fleet growth reflects a structural pivot toward younger, more efficient narrow-bodies rather than a pure capacity build-up, because airlines must comply with the 2028 EU Stage 5 CO₂ and noise limits while juggling delivery delays tied to friction at tier-2 suppliers. Low-cost carriers (LCCs) still anchor single-aisle demand, but their order books now emphasize higher-density layouts that maximize revenue at slot-constrained hubs. The fastest expansion is in the dedicated freighter segment, where sustained e-commerce parcel growth and passenger-to-freighter conversions are helping to bypass belly-hold congestion. Turboprop programs are regaining share on short intra-regional sectors under 500 nautical miles, aided by public-service-obligation subsidies in Scandinavia and Eastern Europe. On the component side, avionics and flight-control electronics are drawing the sharpest investment as airlines deploy digital twins and predictive maintenance to trim unscheduled downtime and preserve margins.
Key Report Takeaways
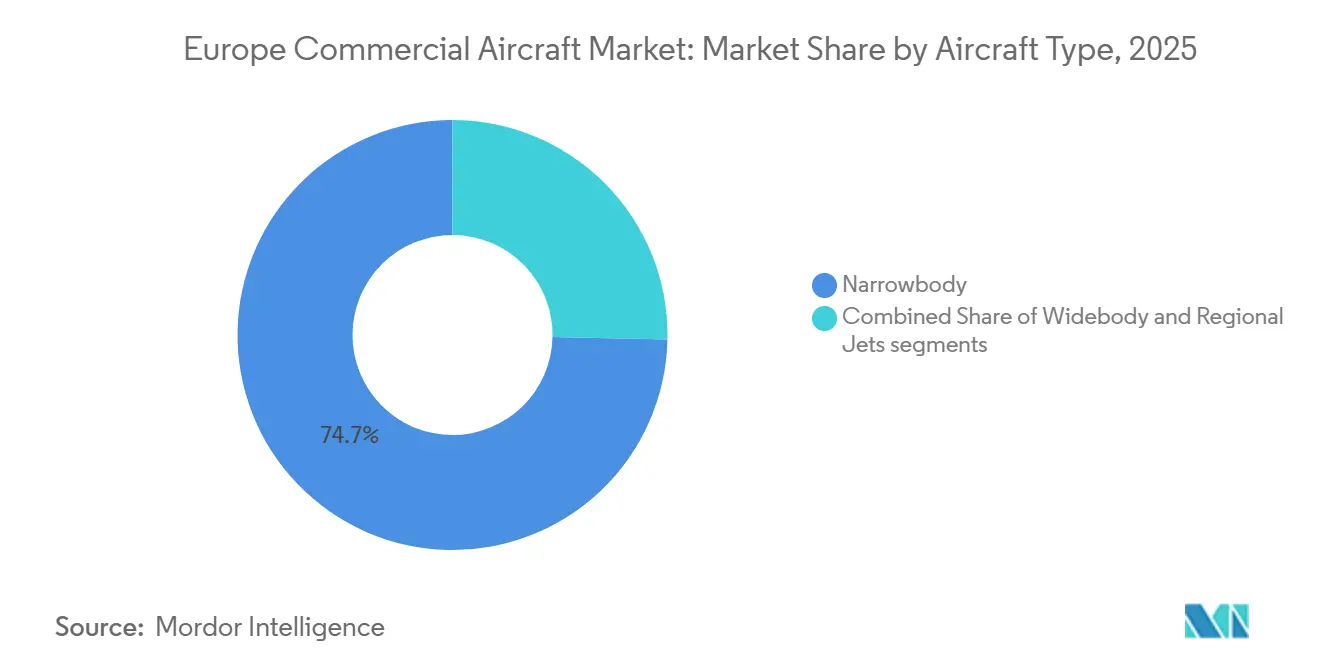
- By aircraft type, narrow-body aircraft led with a 74.67% share of the Europe commercial aircraft market in 2025, and the segment is expected to expand at a 6.13% CAGR through 2031.
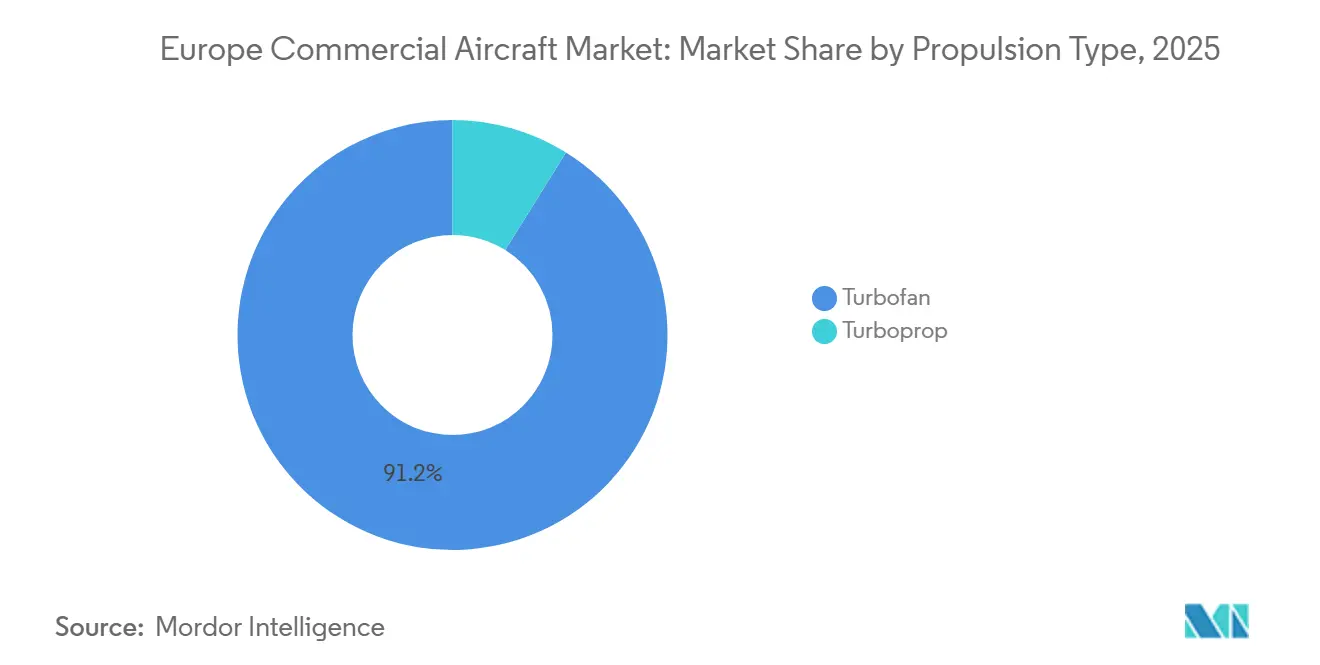
- By propulsion type, turbofan captured 91.15% share of the Europe commercial aircraft market size in 2025, while turboprop set to grow at an 8.78% CAGR, three percentage points faster than turbofans.
- By application, passenger represented 94.48% of the Europe commercial aircraft market size in 2025, and the freighter segment is projected to post a 9.93% CAGR to 2031, outpacing the passenger segment.
- By component, airframe structures accounted for 32.78% of revenue in 2025, while avionics are forecast to record the highest growth at a 6.17% CAGR.
- By geography, the United Kingdom maintained a 19.48% share of the Europe commercial aircraft market in 2025, whereas Poland is projected to log the fastest 7.32% CAGR through 2031.
Note: Market size and forecast figures in this report are generated using Mordor Intelligence’s proprietary estimation framework, updated with the latest available data and insights as of January 2026.
Europe Commercial Aircraft Market Trends and Insights
Drivers Impact Analysis*
| Driver | (~) % Impact on CAGR Forecast | Geographic Relevance | Impact Timeline |
|---|---|---|---|
| Surging demand for fuel-efficient narrow-body aircraft driven by LCC expansion | +1.2% | Pan-European, concentrated in Spain, Poland, UK | Medium term (2-4 years) |
| Fleet replacement cycle accelerated by EU Stage 5 CO₂ and noise caps from 2028 | +1.5% | EU-27, UK, Norway, Switzerland | Short term (≤ 2 years) |
| Intra-European regional-connectivity subsidies under TEN-T and PSO schemes | +0.6% | Peripheral regions: Scandinavia, Iberia, Greece, Eastern Europe | Long term (≥ 4 years) |
| Growing e-commerce boosting demand for dedicated narrow-body freighters and P2F conversions | +0.9% | Western Europe core (Germany, France, Netherlands, UK) | Medium term (2-4 years) |
| EU Clean Aviation funding catalyzing hydrogen-powered short-haul programs | +0.4% | France, Germany, Spain (Airbus ZEROe consortium) | Long term (≥ 4 years) |
| Airline push toward digital twins and predictive maintenance to maximize fleet uptime | +0.5% | Global, early adoption in Germany, France, UK | Short term (≤ 2 years) |
| Source: Mordor Intelligence | |||
Surging Demand for Fuel-Efficient Narrow-Body Aircraft Driven by LCC Expansion
LCCs continue to refresh their fleets with high-density A320neo and B737-8-200 jets that shave 3-4% off seat-mile costs and meet Stage 5 acoustic limits. Ryanair is scaling back deliveries, Wizz Air has postponed part of its backlog to ease balance-sheet strain, and easyJet is concentrating on fleet renewal at constrained airports, illustrating divergent strategies built around the same efficiency imperative. Order books show replacement rather than net growth, because retiring CFM56-powered single-aisles avoids USD 2-3 million retrofit expense per airframe. Slot access, not seat count, now determines route viability, so carriers configure 180-200 seat cabins to maximize departures where movements are capped.
Fleet Replacement Cycle Accelerated by EU Stage 5 CO₂ and Noise Caps from 2028
The 2024 CS-36 Amendment 6 introduces stricter cumulative noise standards and a new CO₂ metric for future type designs, pushing operators to retire legacy fleets sooner.[1] Lufthansa has removed its A340-600s, replacing them with quieter A350-900s, while British Airways has ordered additional B787-10s to phase out its older B777-200ERs. Central and Eastern carriers face higher compliance costs, prompting LOT and Tarom to adopt sale-leaseback arrangements for A220 and E2 jets. Residual values of mid-life classics have dipped, yet lease extensions remain prevalent because delivery slots for new aircraft are scarce. Regulatory pressure, therefore, accelerates replacement demand and adds 1.5 percentage points to market growth in the near term.
Intra-European Regional Connectivity Subsidies Under TEN-T and PSO Schemes
The Trans-European Transport Network budget channels funding to peripheral regions, underwriting thin intra-regional routes that lack commercial viability. Norway’s Widerøe and Greece’s Olympic Air receive annual support that covers as much as half of their operating expenses on island or remote city pairs. These subsidies favor turboprop deployment because aircraft such as the ATR 72-600 can operate profitably with lower breakeven load factors. As more Central and Eastern European states adopt PSO frameworks, airports with runways under 1,500 meters can welcome STOL-capable aircraft, thereby expanding connectivity without the need for extensive infrastructure upgrades. The program contributes 0.6 percentage points to the CAGR in the long run by sustaining demand in otherwise marginal markets.
Growing E-Commerce Boosting Demand for Dedicated Narrow-Body Freighters and P2F Conversions
European parcel volumes increased by 6.8% annually from 2020 to 2025, putting pressure on the limited belly-hold capacity on intra-European flights. DHL Express, Amazon Air, and Poste Italiane are scaling bespoke cargo networks based on B757-200F and A330-300P2F fleets that deliver same-day loops while bypassing passenger congestion. Conversion lines at EFW Dresden and IAI Bedek remain fully booked through 2027 as lessors deploy mid-life single-aisles into higher-yielding cargo roles. Dedicated freighters secure 100% payload revenue, unlike mixed passenger services, driving a 9.93% segment CAGR. This trend adds 0.9 percentage points to overall market expansion as e-commerce logistics prioritize reliability over shared capacity.
Restraints Impact Analysis*
| Restraint | (~) % Impact on CAGR Forecast | Geographic Relevance | Impact Timeline |
|---|---|---|---|
| Persistent tier-2/3 supply-chain bottlenecks prolonging delivery lead-times | -0.8% | Global, acute in France, Germany (Airbus supply base) | Medium term (2-4 years) |
| Escalating SAF-blend mandates increasing operating costs on marginal routes | -0.6% | EU-27, UK, Norway (ReFuelEU Aviation scope) | Long term (≥ 4 years) |
| High capital intensity amid rising interest rates limiting fleet-renewal budgets | -0.5% | Pan-European, concentrated in Southern and Eastern Europe | Short term (≤ 2 years) |
| Air-traffic-management capacity constraints and slot scarcity at primary hubs | -0.4% | Western Europe core (London, Paris, Frankfurt, Amsterdam) | Medium term (2-4 years) |
| Source: Mordor Intelligence | |||
Persistent Tier-2/3 Supply-Chain Bottlenecks Prolonging Delivery Lead-Times
Cabin-monument, landing-gear, and wiring-harness shortages held Airbus deliveries to 766 units in 2024, just below its 770-aircraft target. The B737 MAX line remains capped at 38 jets a month as Spirit AeroSystems integration and FAA oversight slow ramp-up. Grounded A320neo-family aircraft awaiting GTF disk replacements exacerbates the shortage, pushing new-aircraft lead times past 7 years for specific variants. Airlines must extend leases on older jets at premium rates, eroding the economic case for renewal and dragging the market CAGR down by 0.8 percentage points until supply stabilizes.
Escalating SAF-Blend Mandates Increasing Operating Costs on Marginal Routes
ReFuelEU mandates a 2% SAF blend in 2025 and 6% by 2030, with penalties for non-compliance. SAF trades at a 2-4x premium to Jet A-1, lifting annual fuel bills by EUR 200-400 million (USD 233.41-466.81 million) for a mid-sized carrier operating 150 narrow-bodies. Limited production capacity, with only 300,000 tons in 2025, forces airlines to either buy credits or absorb cost inflation, especially on low-yield leisure routes where pass-through pricing is limited. The mandate subtracts 0.6 percentage points from the CAGR across the forecast horizon.
*Our forecasts treat driver/restraint impacts as directional, not additive. The impact forecasts reflect baseline growth, mix effects, and variable interactions.
Segment Analysis
By Aircraft Type: Narrow-Body Dominance Masks Regional Turboprop Revival
Narrowbodies held 74.67% of the Europe commercial aircraft market share in 2025 and are forecast to post a 6.13% CAGR to 2031, anchored by Ryanair’s 737-8-200 program and easyJet’s A320neo intake. Airlines pursue 180-200-seat layouts to squeeze more revenue per slot at congested hubs, yet many arrivals replace aging classics rather than adding net capacity. Widebodies retain their critical long-haul relevance, as illustrated by British Airways’ B787-10 orders, which cut trip costs by 25% compared to four-engine forerunners.
Turboprops account for a small base but are growing faster at 8.78% as operators like Widerøe and Olympic Air expand connectivity under PSO contracts. ATR’s 42-600S STOL capability enables operations on runways under 1,000 meters, expanding viable networks without requiring expensive infrastructure projects. Regional jets maintain a niche on thin, mid-range routes, though scope clauses and pilot scarcity temper uptake. Aircraft selection now hinges on airport constraints and compliance costs rather than raw traffic demand.
By Application: Freighter Surge Outpaces Passenger Recovery
Passenger aircraft still comprise 94.48% of Europe commercial aircraft market size in 2025, yet their 5.81% CAGR lags the dedicated freighter segment’s 9.93% advance. DHL Express and Amazon Air anchor this cargo build-out, installing B757-200F and A330-300P2F capacity at Leipzig/Halle to guarantee overnight loops free from curfews.
Conversion slots remain sold out through 2027, pushing lessors to earmark mid-life A320s and B737-800s for cargo earlier than planned. Passenger network carriers delay expansion, focusing on utilization and ancillaries rather than headcount growth, a contrast that widens the performance gap between applications. Cargo demand now reflects a structural shift in logistics rather than a temporary pandemic spike.
By Propulsion Type: Turboprop Resurgence Challenges Turbofan Hegemony
Turbofan engines held 91.15% share in 2025, but turboprops grew nearly three points faster on a CAGR basis as regional economics override speed concerns. ATR’s PW127XT-M-powered variants cut fuel burn by another 3% and prolong on-wing intervals, sharpening the cost gap versus regional jets.[2]
Turbofan growth faces durability setbacks with the GTF, which has led to the grounding of over 1,000 aircraft worldwide and higher lease rates for older CFM56 units. Open-fan and hybrid-electric demonstrators under the CFM RISE and Rolls-Royce UltraFan programs promise 20-25% fuel savings after 2035; however, the commercial impact remains beyond the forecast window. Hydrogen and hybrid platforms stay experimental, yet Clean Aviation funding accelerates their technology readiness.
By Component: Avionics Gains Outpace Airframe Structures
Airframe structures captured 32.78% revenues in 2025, reflecting high bill-of-materials cost and long replacement cycles, but avionics and flight-control electronics are forecast to grow 6.17% through 2031, outpacing the overall Europe commercial aircraft market CAGR. Touchscreen cockpits, synthetic vision, and connected flight management enable single-pilot concepts and higher dispatch reliability.
Engines remain the second-largest segment, yet parts shortages and durability fixes cap volume. Interiors and IFEC retrofit demand rises as carriers monetize connectivity at EUR 8-12 (USD 9.34-14.01) per passenger. Other mechanical systems track delivery cadence but offer limited differentiation because OEMs increasingly bundle them into integrated packages that compress margins.
Geography Analysis
The United Kingdom held a 19.48% share of the Europe commercial aircraft market in 2025. Still, slot caps at Heathrow and Gatwick constrain forward growth to mid-single digits, despite British Airways’ Dreamliner expansion.[3] Virgin Atlantic’s switch to efficient A330neo and A350-1000 jets illustrates the carrier’s focus on Stage 5 compliance and lower per-seat fuel burn, rather than raw fleet count.
Germany and France anchor Airbus assembly, ensuring a steady flow of A320neo and A350 deliveries even amid supply-chain snags. Lufthansa Group operates the region’s largest fleet and deploys digital twins to extend on-wing time, while Air France-KLM trims unscheduled downtime by nearly one-fifth. Spain’s market centers on leisure, where Ryanair and Vueling jointly control more than 60% of domestic seat capacity and load high-density cabins onto routes to the Balearic and Canary Islands.
Poland is projected to register the fastest growth of 7.32% through 2031, as LOT and Wizz Air leverage TEN-T funding to expand their hubs in Warsaw and other Central European gateways. Italy remains fragmented following Alitalia’s exit, with ITA Airways lacking the scale to compete against Ryanair’s domestic push. The Netherlands profits from KLM’s transatlantic focus but faces strict annual movement caps at Schiphol. Scandinavia, Greece, and the Balkans rely on PSO subsidies; Widerøe and Olympic Air use modern turboprop aircraft to keep remote communities connected. Growth, therefore, tilts toward Central and Eastern peripheries, where infrastructure investment and regulatory support lift latent demand, while Western hubs bump against physical and environmental ceilings.
Regulatory Landscape
European commercial-aircraft activity is shaped by EU-level safety, environmental, and competition frameworks led by EASA and the European Commission. On the safety and certification side, EASA continued tightening and modernizing requirements through 2026, including EPAS 2026, which set out 129 actions and flagged priorities such as big data for risk management and rules simplification. EASA also issued Opinion No 01/2026 to align EU air operations rules with ICAO provisions, including EDTO and operations control personnel training. In parallel, EASA actions in 2026 included an Airworthiness Directive affecting the Airbus A320 family and type and engine-related certification updates, which can affect fleet availability and delivery timing in Europe.
On the decarbonization and market-access side, ReFuelEU Aviation has been in force since 1 January 2024 and establishes phased SAF supply obligations across EU airports, including a 2% minimum share starting in 2025, with a weighted-average flexibility mechanism running through 2034. The European Commission also opened policy work in 2026 via a call for evidence for a new EU Aviation and Aeronautics Strategy, and it advanced consultation on revised Air Transport State aid guidelines. These updates are intended to refresh rules for regional airports and align support with European Green Deal objectives, affecting airline economics, regional connectivity support, and OEM and airport investment priorities.
Value Chain Analysis
The Europe commercial aircraft value chain starts with raw materials and aerostructures inputs (aluminum, titanium, composites and semi-finished goods), followed by tiered manufacturing of airframes, engines, avionics, and cabin systems, and ends with final assembly and delivery centered on European OEM footprints, led by Airbus in France and Germany and supported by a multi-country supplier base. Production signals reinforce the manufacturing-driven character of the chain: Airbus reported a mid-2026 commercial backlog of 9,216 aircraft, translating to about 10.6 years of production coverage at current target rates, while it continued to manage monthly delivery cadence, including 89 commercial aircraft delivered in June 2026.
Downstream, aircraft are placed through airlines and lessors, with MRO, parts distribution, and digital services such as connected maintenance and predictive analytics supporting lifecycle value capture. The aftermarket competes with new-build programs for scarce engines and spares when fleets are extended. Bottlenecks remain most acute in interiors, structural components, and engine availability, keeping tier-2 and tier-3 suppliers and sub-assembly throughput as gating factors for ramp-ups, even as OEMs target higher single-aisle output and work to stabilize logistics and supplier financing across the European industrial ecosystem.
Competitive Landscape
Airbus and Boeing jointly account for roughly 95% of single-aisle and twin-aisle deliveries; however, regional players ATR and Embraer exploit the 50-120 seat white space, where operating economics favor small jets and turboprops. Airbus shipped 766 units in 2024, marginally below its goal, due to delays in cabin interiors and landing gear that hampered final assembly. Boeing struggles to recover B737 MAX production rates to 38 units a month while integrating Spirit AeroSystems.
ATR delivered more than 100 turboprops in 2024 and secured an order for 25 ATR 72-600s in October 2025, proving sustained appetite for short takeoff designs. In May 2025, Embraer delivered its inaugural E195-E2, featuring 146 seats, to a European client, but pilot scope clauses are hindering swift expansion. Pratt & Whitney plans to replace 1,000 grounded GTF engines by the end of 2027. This move not only accelerates its disk replacement strategy but also enhances MRO throughput and strengthens lease-rate factors for lessors.
Strategies focus on compliance, cost, and digital enablement, not fleet size. Network carriers invest in predictive maintenance to squeeze extra hours from constrained assets. Integrators like DHL Express and Amazon Air add converted freighters to guarantee overnight performance. Emerging disruptors focus on hydrogen programs, such as Airbus ZEROe, yet commercial adoption depends on the cost curves of green hydrogen. Competitive intensity, therefore, remains high, although the structural duopoly maintains elevated barriers to entry.
Europe Commercial Aircraft Industry Leaders
-
Airbus SE
-
The Boeing Company
-
Embraer S.A.
-
Pilatus Aircraft Ltd
-
De Havilland Aircraft of Canada Limited
- *Disclaimer: Major Players sorted in no particular order
Market Opportunities and Future Outlook
A key whitespace in Europe is the combination of single-aisle capacity expansion and production-system modernization as OEMs and suppliers work through long backlogs and airlines replace older fleets under tightening noise and CO2 constraints. Airbus provided a capacity signal in June 2026 by inaugurating a new A320 Family final assembly line at the Jean-Luc Lagardere site in Toulouse. The move completes a global network of 10 final assembly lines and reinforces the narrow-body throughput focus that underpins much of the region's fleet renewal activity.
Decarbonization policy also creates opportunity across fuel supply, aircraft modification, and operational enablers, not just aircraft sales. ReFuelEU Aviation, effective since 1 January 2024, mandates rising SAF shares at EU airports from 2025 onward and includes an EU-wide compliance mechanism, with weighted-average SAF supply across Union airports from 2025 to 2034. This structure supports demand for SAF logistics, blending, and traceability, and it underpins airline and lessor programs to deploy more fuel-efficient aircraft and maintenance and digital tools that help protect dispatch reliability in a constrained delivery environment.
Recent Industry Developments
- July 2026: Airbus disclosed an order from SMBC Aviation Capital for 100 A320neo Family aircraft (65 A321neo and 35 A320neo). The deal reinforces lessor-led demand for high-density, fuel-efficient single-aisle aircraft and supports fleet replacement programs across European operators facing delivery slot scarcity.
- November 2025: Air Europa signed an MoU with Airbus for up to 40 A350-900 aircraft, announced at the Dubai Airshow. The agreement highlights widebody fleet renewal activity tied to operating-cost and emissions performance, while extending long-haul capacity planning horizons amid constrained near-term deliveries.
- July 2024: EASA granted type certification to the Airbus A321XLR equipped with CFM LEAP-1A engines. The approval supports airline and lessor planning for longer-range single-aisle missions, which can open thinner routes and improve aircraft utilization within Europe’s slot-constrained airport network.
Research Methodology Framework and Report Scope
Market Definition and Coverage
For this study, the market covers the value of commercial aircraft demand and supply in Europe, focused on aircraft used for scheduled passenger and cargo transportation by airline operators, including new deliveries and related aircraft-level value captured in the region.
Scope exclusions: Military aircraft, business jets, helicopters, drones, and purely general aviation uses are excluded from this market sizing.
Segmentation Overview
- By Aircraft Type
- Narrowbody
- Widebody
- Regional Jets
- By Application
- Passenger
- Freighter
- By Propulsion Type
- Turbofan
- Turboprop
- By Component
- Airframe Structures
- Aero-Engines
- Avionics and Flight Control
- Cabin Interior and IFEC
- Other Components
- By Geography
- Europe
- United Kingdom
- Germany
- France
- Italy
- Spain
- Netherlands
- Russia
- Poland
- Rest of Europe
- Europe
Data Sources, Market Sizing, and Validation
Desk Research
Desk research was used to set market boundaries and build the input series that later gets tested in interviews. We relied on public sources such as EUROCONTROL traffic and operational performance statistics, EASA safety and airworthiness publications, ICAO civil aviation datasets, IATA traffic and airline economics summaries, and Eurostat trade statistics where relevant for aircraft and parts flows.
To translate demand signals into aircraft value, we also reviewed annual reports, investor presentations, and public order and delivery updates from airframers and key suppliers, along with airport operator releases and reputed financial press. Where needed, paid databases were used for company financials and news history, aircraft and engine fleet details, and patent lookups to clarify propulsion and platform direction. These examples are not exhaustive, and many other public sources were checked to collect, validate, and clarify assumptions.
Primary Interviews and Surveys
Primary discussions were conducted with airline and leasing professionals, MRO and aftermarket participants, and engineering, procurement, and program roles in the aircraft supply chain to verify delivery outlooks, price progression, and lead times. We also used these conversations to pressure-test passenger versus freighter demand and to confirm how backlogs and production constraints are expected to unwind across major European operating bases.
Distribution of primary research fieldwork respondents
| Company type | Respondent position |
|---|---|
| Top tier: 35% | CXOs: 18% |
| Mid tier: 45% | Functional/Unit leaders: 39% |
| Smaller Players: 20% | Managers: 43% |
Market-Sizing & Forecasting
Sizing starts with a top-down build where fleet and traffic indicators are converted into delivery needs, then translated into market value using an aircraft-type mix and average pricing assumptions. Since public reporting can be uneven by country, the totals were corroborated with selective bottom-up checks, including sampled delivery roll-ups by aircraft class, sampled price points, and channel checks on delivery timing.
Key inputs used in the model include aircraft deliveries and order backlogs, passenger traffic recovery and load factor direction, fleet replacement cycles by age and utilization, the shift between narrowbody, widebody, and regional aircraft, and the split between passenger and freighter aircraft. Pricing was treated as a controlled variable, with discounting and escalation tested through interviews so the value stays aligned with observed deal behavior.
For forecasting, scenario analysis was used because production rate changes, certification timing, and airline capacity plans can move the market more than any single macro variable. When gaps appeared in delivery or pricing disclosures, they were filled with conservative assumptions anchored to adjacent time periods, and then rechecked against expert feedback before finalizing the series.
Data Validation & Update Cycle
Validation is done in steps so the numbers stay explainable and consistent. We compare model outputs against independent signals such as regional traffic levels, delivery announcements, backlog movement, and supplier activity trends, and then investigate outliers that do not match the broader market direction.
Before sign-off, the work is reviewed by another analyst to confirm arithmetic, scope alignment, and whether assumptions are supported by source evidence or interview feedback. Reports are refreshed annually, and interim updates are triggered when material events occur, such as production rate resets, major order shifts, or new certification delays. Right before delivery, we do a final pass so clients receive the latest updated view of the market.
Mordor Intelligence's Europe Commercial Aircraft Market Estimate Compared With Other Published Estimates
Published market numbers for Europe commercial aircraft can differ even when they look like they cover the same topic, because each publisher sets its own scope, pricing logic, and update timing. Differences also appear when one estimate is built around aircraft delivery value, while another mixes in broader aerospace manufacturing activity or uses unit counts with simplified pricing.
The table shows a wide spread, and in Mordor Intelligence's model the total is tied to commercial passenger and freighter aircraft used by airlines in Europe, with aircraft-type mix and price discounting validated through interviews so adjacent categories like business jets and military platforms do not enter the market value.
Benchmark comparison
| Source | Market Size | Gaps in Research Methodology |
|---|---|---|
| Mordor Intelligence | USD 70.77 B (2025) | |
| Regional Consultancy A | USD 50.00 B (2024) | Uses an earlier base year and appears to apply broader demand recovery indicators with limited transparency on mapping to delivery value, backlog timing, and aircraft-type level price and discount treatment. |
| Trade Journal B | USD 82.40 B (2025) | Likely reflects a wider aircraft or manufacturing scope, which can inflate totals if non-commercial platforms or additional component value are counted alongside commercial aircraft deliveries. |
In practical terms, most of the gap is explained by what is counted as the market and how pricing is carried through the forecast years. When deliveries, backlog release, and realistic price progression are kept consistent, the result becomes easier to reconcile with observable activity across European airlines and the supply chain.
Key Questions Answered in the Report
What is the projected value of the Europe commercial aircraft market in 2031?
The Europe commercial aircraft market is forecasted to reach USD 99.65 billion by 2031.
Which aircraft segment is expanding the fastest through 2031?
Dedicated narrowbody freighters are advancing at a 9.93% CAGR.
Why are turboprops gaining share in Europe after years of decline?
Subsidized regional routes and short runways favor modern turboprops that cut fuel burn about 40% versus regional jets.
How will EU Stage 5 regulations influence fleet decisions?
Airlines are accelerating retirement of mid-life classics to avoid costly retrofits and meet stricter noise and CO₂ standards starting in 2028.
Which country is expected to grow quickest within the region?
Poland is projected to post a 7.32% CAGR through 2031, outpacing all other European markets.