
Market Overview
| Study Period | 2021 - 2031 |
|---|---|
| Forecast Data Period | 2026 - 2031 |
| Base Year Market Size (2025) | USD 16.11 Billion |
| Market Size (2026) | USD 17.14 Billion |
| Market Size (2031) | USD 23.35 Billion |
| Growth Rate (2026 - 2031) | 6.38 % |
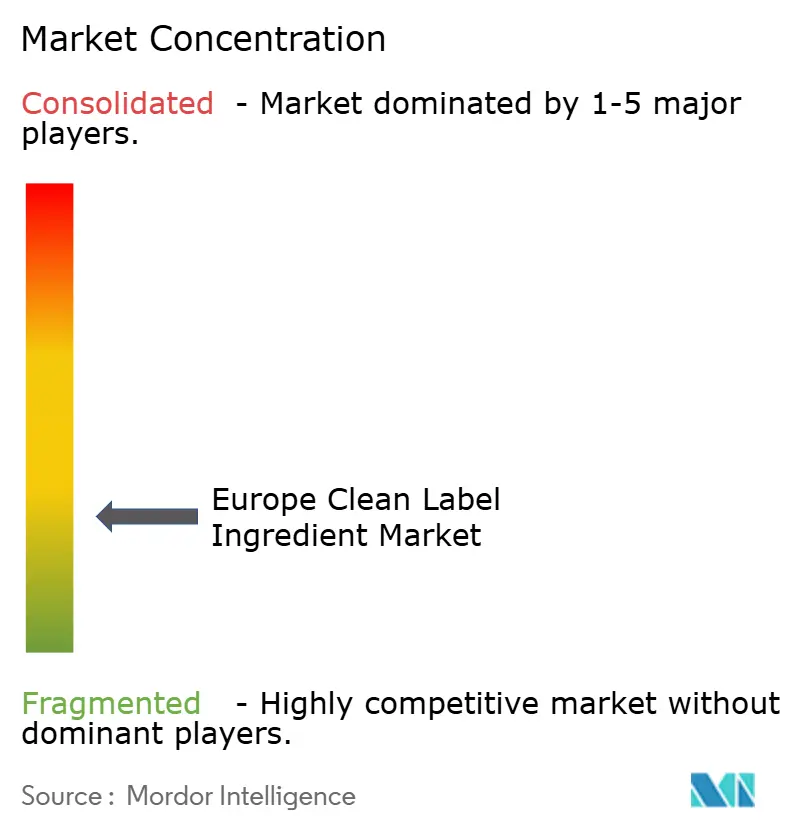
| Market Concentration | Low |
Major Players *Disclaimer: Major Players sorted in no particular order Image © Mordor Intelligence. Reuse requires attribution under CC BY 4.0. | |
Europe Clean Label Ingredient Market Analysis by Mordor Intelligence
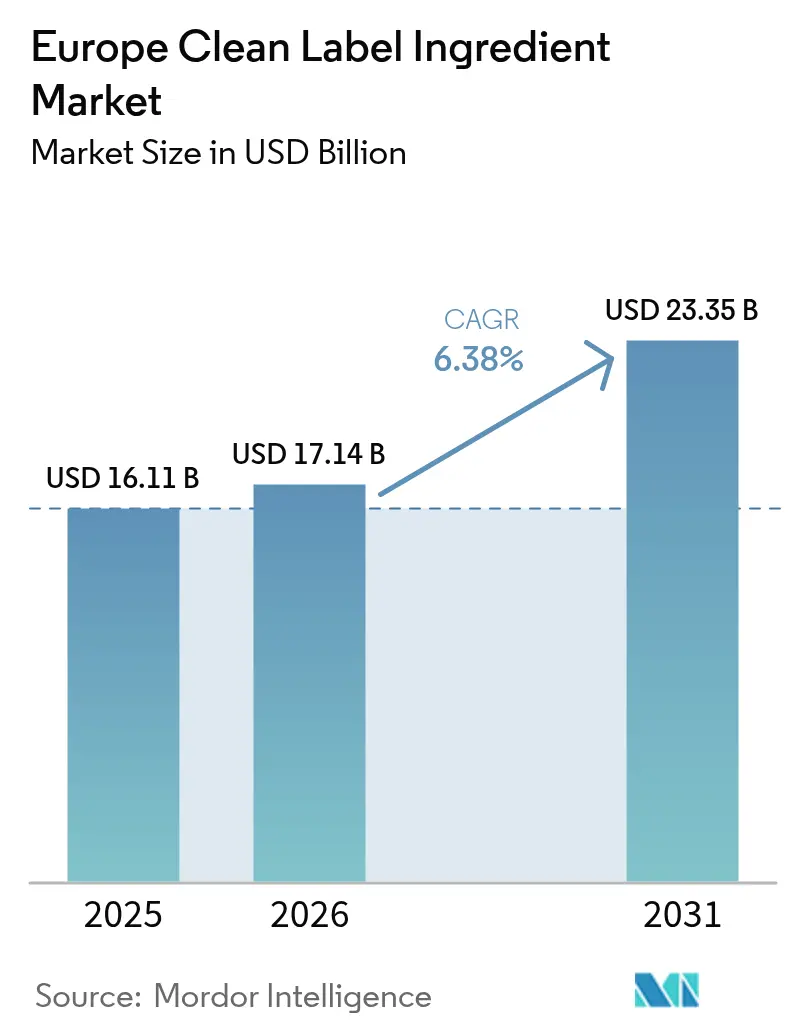
The Europe clean label ingredient market size was valued at USD 16.11 billion in 2025 and estimated to grow from USD 17.14 billion in 2026 to reach USD 23.35 billion by 2031, at a CAGR of 6.38% during the forecast period (2026-2031). This upward trajectory highlights the increasing consumer preference for natural and transparent labeling, driven by heightened awareness of health and wellness trends. Consumers are actively seeking products with clean labels that exclude artificial additives, preservatives, and synthetic ingredients, aligning with their desire for healthier and more sustainable food options. Additionally, the European Union's stringent regulatory framework plays a pivotal role in shaping the market. Regulations such as (EU) 2018/848, which governs organic production and labeling, and the European Food Safety Authority's (EFSA) ongoing re-evaluations of food additives, are pushing manufacturers to reformulate products with clean label ingredients. These regulatory measures aim to ensure food safety, enhance transparency, and meet the growing demand for natural alternatives. As a result, companies operating in this market are increasingly investing in research and development to innovate and expand their portfolio of clean label ingredients, further fueling market growth.
Key Report Takeaways
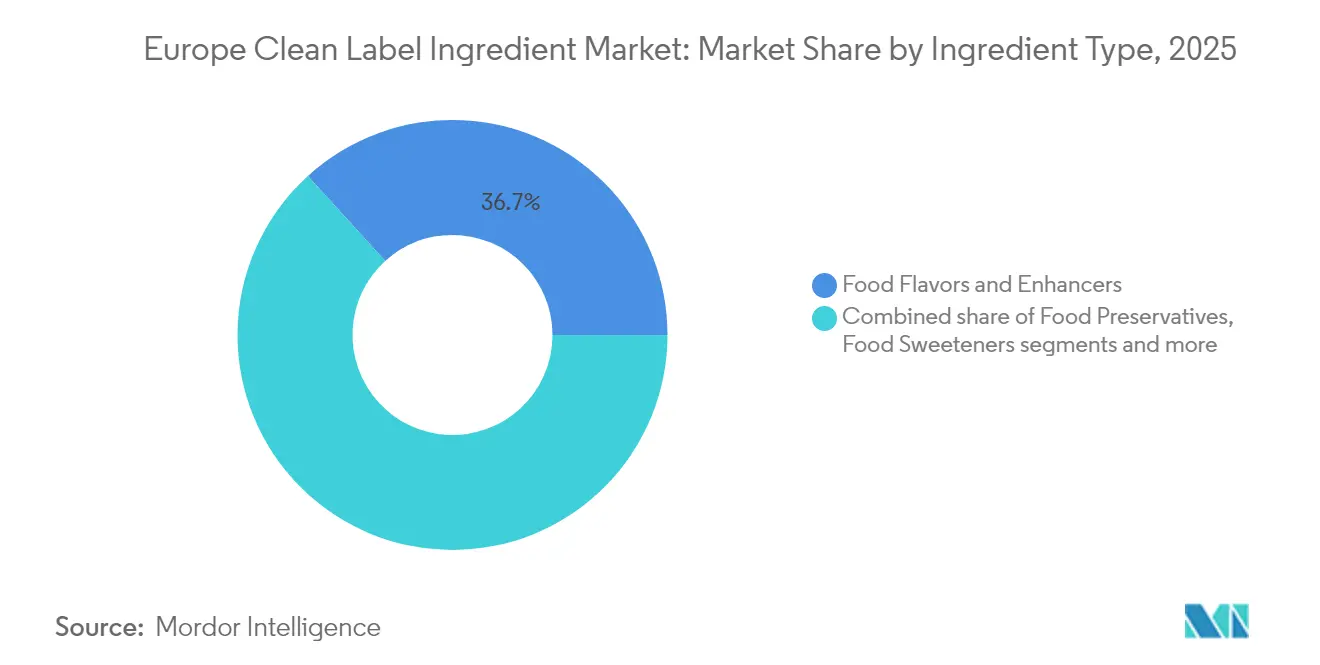
- By ingredient type, food flavors and enhancers led with 36.74% of Europe clean label ingredient market share in 2025; food colorants are projected to grow fastest at 6.95% CAGR to 2031.
- By form, dry ingredients commanded 59.63% share of the Europe clean label ingredient market size in 2025, while liquid forms are poised for an 7.74% CAGR through 2031.
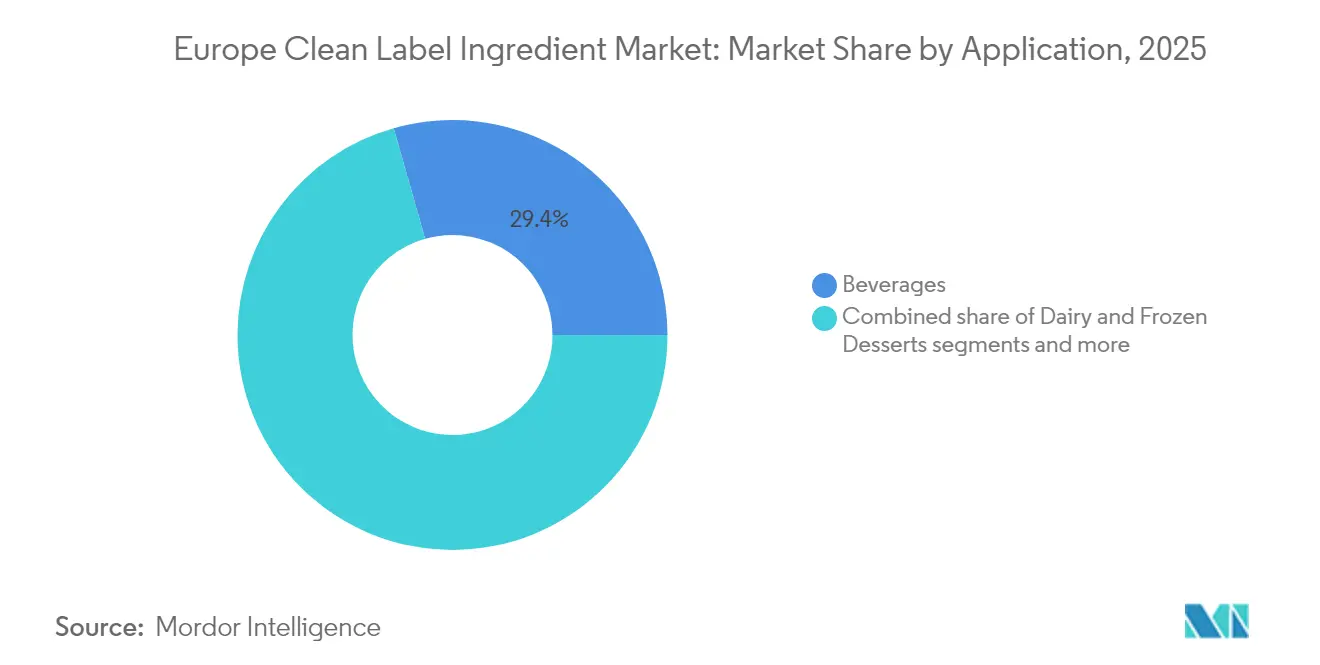
- By application, beverages accounted for 29.41% of the market size in 2025; meat and meat products are expanding at 7.58% CAGR between 2026-2031.
- By geography, Germany captured 22.05% of the market share in 2025 and is advancing at an 7.98% CAGR through 2031.
Note: Market size and forecast figures in this report are generated using Mordor Intelligence’s proprietary estimation framework, updated with the latest available data and insights as of 2026.
Europe Clean Label Ingredient Market Trends and Insights
Drivers Impact Analysis*
| Driver | (~) % Impact on CAGR Forecast | Geographic Relevance | Impact Timeline |
|---|---|---|---|
| Growing demand for natural and plant-based ingredients | +1.8% | Pan-European with stronger impact in Germany, France, UK | Medium term (2-4 years) |
| Expanding impact of food allergies and intolerances on consumer behavior | +1.2% | EU-wide, particularly Nordic countries | Short term (≤ 2 years) |
| Rising consumer preference for sustainable and ethical products | +1.5% | Western Europe, emerging in Eastern Europe | Long term (≥ 4 years) |
| Increasing penetration of functional and fortified food | +0.9% | Germany, Netherlands, France | Medium term (2-4 years) |
| Soaring label-conscious population across developed regions | +1.1% | EU-wide, concentrated in urban areas | Short term (≤ 2 years) |
| Premiumization and transparency in packaged food | +0.7% | Germany, France, UK, Italy | Medium term (2-4 years) |
| Source: Mordor Intelligence | |||
Growing demand for natural and plant-based ingredients
Consumers in the region are increasingly prioritizing transparency in food products, driving the demand for natural and plant-based ingredients. A report from the European Food Information Council highlights that a majority of European consumers favor clean-label products, underscoring their preference for recognizable, natural components. Moreover, the European Commission's Farm to Fork Strategy, which underscores the importance of sustainable food systems, bolsters the push for plant-based ingredients in food production. Data from ITC Trade Map reveals that in 2024, Central and Eastern Europe imported natural coloring matter worth USD 86.6 million, a significant rise from USD 61.8 million in 2020, further reflecting the growing demand for natural ingredients [1]. The European Vegetarian Union (EVU) notes a consistent uptick in the consumption of plant-based alternatives, including oat milk and plant-based meats, throughout Europe. These consumer trends, buoyed by government initiatives championing sustainable agriculture and plant-based diets, are poised to propel the market forward.
Expanding impact of food allergies and intolerances on consumer behavior
The increasing prevalence of food allergies and intolerances is significantly influencing consumer behavior, driving demand for clean-label ingredients in the European market. The European Food Safety Authority (EFSA) has highlighted that approximately 2% of adults and 6% of children in Europe are affected by food allergies, emphasizing the need for transparency in food labeling [2]. Governments and regulatory bodies are actively addressing this issue. For instance, the European Union's Food Information to Consumers (FIC) Regulation mandates clear labeling of allergens on pre-packaged food products. This regulation has encouraged manufacturers to adopt clean label practices, ensuring that consumers can make informed choices. Associations such as the European Federation of Allergy and Airways Diseases Patients' Associations (EFA) are also advocating for stricter labeling norms and increased awareness about food allergies. These efforts have led to a surge in demand for allergen-free and minimally processed ingredients, which align with the clean label trend. For example, companies are increasingly using natural substitutes like rice flour and chickpea flour instead of wheat flour to cater to gluten-intolerant consumers. Similarly, plant-based milk alternatives, such as almond and oat milk, are gaining popularity among individuals with lactose intolerance. These shifts in consumer preferences are driving innovation and growth in the European clean label ingredient market.
Rising consumer preference for sustainable and ethical products
Consumers in the region are increasingly gravitating towards sustainable and ethical products, driven by heightened awareness of health, environmental concerns, and ethical sourcing. This shift has propelled the growth of the clean label ingredients market in Europe. Research from CBI, the Ministry of Foreign Affairs, highlights this trend, projecting that clean-label products will rise from constituting 52% of portfolios in 2021 to over 70% in 2025 and 2026 [3]. This growth is fueled by consumers becoming more discerning about product ingredients, leading to a surge in demand for clean-label ingredients that are natural, minimally processed, and devoid of artificial additives. In response, manufacturers are prioritizing transparency in both ingredient sourcing and production processes. Concurrently, European regulatory bodies are tightening labeling requirements, further bolstering the clean label movement. As companies increasingly align their offerings with consumer preferences for sustainability and ethics, this trend is poised to significantly influence the market in the coming years.
Increasing penetration of functional and fortified food
The increasing penetration of functional and fortified foods is a key driver of the European clean-label ingredients market. Consumers are increasingly seeking healthier food options, which has led to a growing demand for products enriched with vitamins, minerals, and other functional ingredients. According to the European Food Safety Authority (EFSA), the regulatory framework in Europe supports the development and marketing of fortified foods, provided they meet safety and labeling standards. The Clean Label Alliance has further highlighted that the shift toward functional and fortified foods aligns with the growing consumer demand for natural and minimally processed ingredients. This trend is expected to continue driving the adoption of clean label ingredients across the region, as manufacturers increasingly focus on reformulating their products to cater to these evolving preferences.
Restraints Impact Analysis*
| Restraint | (~) % Impact on CAGR Forecast | Geographic Relevance | Impact Timeline |
|---|---|---|---|
| Seasonal fluctuations in ingredient supply | -0.9% | EU-wide, particularly Germany, France, Italy | Medium term (2-4 years) |
| Regulatory challenges in natural product certification | -0.8% | EU-wide, particularly affecting smaller producers | Short term (≤ 2 years) |
| Shorter shelf life of clean label products | -1.1% | Acute in Southern Europe | Medium term (2-4 years) |
| Complex supply chain logistics | -0.9% | EU-wide, severe in Eastern Europe | Medium term (2-4 years) |
| Source: Mordor Intelligence | |||
Seasonal fluctuations in ingredient supply
Seasonal fluctuations in ingredient supply act as a significant restraint in the European clean-label ingredients market. These fluctuations often lead to inconsistencies in the availability of raw materials, directly impacting production schedules and supply chain efficiency. For instance, certain natural ingredients, such as fruits, vegetables, and grains, are subject to seasonal harvest cycles, which can result in limited availability during off-seasons. This variability not only increases procurement costs but also creates challenges in maintaining consistent product quality and meeting consumer demand. Furthermore, adverse weather conditions, such as droughts or floods, can exacerbate these supply issues, further disrupting the market. As a result, manufacturers in the clean label ingredients market must adopt strategic sourcing and inventory management practices to mitigate the impact of these seasonal variations.
Regulatory challenges in natural product certification
Regulatory challenges associated with natural product certification act as a significant restraint on the market. In Europe, the certification process for natural products is often complicated by stringent and varying regulatory requirements across countries. These regulations are intended to ensure product authenticity, safety, and compliance with clean label standards but lack harmonization across the region. This inconsistency forces manufacturers to navigate diverse regulatory frameworks, increasing both the time and costs involved in obtaining certifications. According to the European Commission, food products in the EU must meet specific labeling and certification requirements, further complicating the process for manufacturers. These requirements often demand detailed documentation, rigorous testing, and adherence to strict guidelines, which can be resource-intensive for companies. Additionally, the need to adapt to frequent regulatory updates adds another layer of complexity, requiring continuous investment in compliance efforts. Together, these factors hinder the growth of the clean label ingredients market in Europe by creating barriers for new entrants and complicating operations for existing players.
*Our forecasts treat driver/restraint impacts as directional, not additive. The impact forecasts reflect baseline growth, mix effects, and variable interactions.
Segment Analysis
By Ingredient Type: Flavors Dominate, Colors Accelerate
Food flavors and enhancers claimed a 36.74% share of the market in 2025, underscoring their pivotal role in masking off-notes during reformulation, all without turning to synthetic compounds. This segment's growth is bolstered by advancements in fermentation-derived esters and botanical extracts, both of which can endure thermal processing. These innovations cater to the increasing demand for natural and sustainable solutions in food production.
Meanwhile, food colorants, though a smaller player in the market, are racing ahead with a 6.95% CAGR. This surge is fueled by regulatory bans on titanium dioxide and a consumer shift away from azo dyes, reflecting a broader trend toward cleaner and safer food products. Notably, 'coloring foods', legally recognized as ingredients rather than mere additives, empower manufacturers to preserve vibrant hues while upholding a cleaner ingredient list. This distinction allows companies to align with consumer expectations for transparency and natural ingredients, further driving the adoption of clean-label solutions across the region.

By Form: Liquid Innovations Challenge Dry Dominance
Dry formats commands a substantial 59.63% share in 2025. This dominance is attributed to their stable handling, ease of storage, and seamless compatibility with production lines. Products such as dehydrated herb blends, powdered antioxidants, and freeze-dried fruit powders integrate effortlessly into existing mixers, reducing the need for additional capital expenditure. These attributes make dry formats a preferred choice for manufacturers aiming to optimize operational efficiency. Furthermore, dry formats are particularly advantageous for long-term storage and transportation, as they are less prone to spoilage and require minimal preservation measures, making them cost-effective and sustainable.
On the other hand, liquid extracts are emerging as a high-growth segment, projected to register a robust CAGR of 7.74% during the forecast period. This growth is driven by technological advancements, including micro-encapsulation, osmotic concentration, and aseptic packaging, which have effectively resolved previous stability issues. These innovations have enhanced the shelf life and functionality of liquid extracts, making them increasingly attractive for various applications within the clean label ingredients market. Additionally, liquid extracts are gaining traction due to their ease of incorporation into beverages, sauces, and other liquid-based formulations, offering manufacturers greater versatility in product development.
By Application: Beverages Lead, Meat Products Surge
In 2025, beverages accounted for 29.41% of Europe's clean label ingredients market, with notable advancements in juices, teas, and flavored waters prominently showcasing ingredient lists on their front packaging. The growing consumer demand for transparency and healthier options has driven manufacturers to innovate and reformulate their products using clean label ingredients. This trend is particularly evident in the beverages segment, where natural flavors, sweeteners, and colorants are replacing artificial additives to meet consumer expectations.
Concurrently, the meat and meat products segment is experiencing a 7.58% CAGR, driven by processors' pursuit of natural nitrite alternatives and antioxidant systems that ensure shelf life while prioritizing safety. The shift toward clean label solutions in this segment is fueled by increasing awareness of the potential health risks associated with synthetic preservatives. Manufacturers are focusing on incorporating plant-based extracts and other natural solutions to maintain product quality and safety while aligning with clean label standards. This trend reflects the broader movement across the market toward transparency, sustainability, and health-conscious consumption.
Geography Analysis
In 2025, Germany leads the European clean label ingredients market with a 22.05% share, establishing itself as the dominant player in the region. The country also records the highest growth rate at 7.98% CAGR through 2031, reflecting its strong position in both market size and expansion speed. Germany's robust food and beverage industry, combined with increasing consumer demand for clean label products, drives this growth trajectory. The country's focus on innovation and adherence to stringent regulatory standards further strengthens its market leadership.
The United Kingdom and France also hold significant shares in the European clean label ingredients market. The UK benefits from a growing preference for natural and minimally processed ingredients, supported by strict regulatory frameworks that encourage transparency in food labeling. Additionally, the rising health consciousness among consumers in the UK has fueled the demand for clean label products. France, known for its rich culinary heritage, is witnessing a surge in the adoption of clean label ingredients as consumers increasingly prioritize transparency, sustainability, and health-conscious choices in their food products.
Italy, another key country in the region, is experiencing steady growth due to its strong focus on organic and natural food production. The country's emphasis on traditional, high-quality food products aligns well with the clean label trend, making it a significant contributor to the market. Together, Germany, the UK, France, and Italy play a pivotal role in shaping the European clean label ingredients market, driving its growth and development through innovation, consumer awareness, and adherence to evolving regulatory standards.
Regulatory Landscape
The European clean label ingredient market operates under the EU food additive and consumer information framework, where many ingredients used for technological functions are regulated as additives even when they are marketed with clean label positioning. Regulation (EC) No 1333/2008 (food additives) and EFSA safety assessments underpin authorization, conditions of use, and labeling (including E-numbers and/or specific names), with amendments to Annex II occurring through Commission regulations; for example, Regulation (EU) 2025/2060 authorized sorbic acid (E 200) and potassium sorbate (E 202) for non-heat-treated plant-based mousses, while 2024 amendments (including Regulation (EU) 2024/2597 and Regulation (EU) 2024/1451) updated conditions and specifications for several commonly used preservative and acidulant systems.
EU rules for food information to consumers (FIC) also shape clean label claims through mandatory ingredient list and allergen disclosure, which keeps reformulation focused on recognizable ingredients and away from contentious additives. The EU authorization pathway for new additives follows the common procedure (Regulation (EC) No 1331/2008), and EFSA re-evaluations of existing additives can tighten use levels or trigger reformulation workstreams. In addition, ingredients that perform additive-like functions but are not authorized under Regulation (EC) No 1333/2008 can face scrutiny by national authorities (for example, the Netherlands NVWA), increasing compliance diligence requirements for both suppliers and food manufacturers.
Value Chain Analysis
The value chain starts with agricultural and botanical raw materials (fruits and vegetables for coloring foods and fibers, herbs and spices, cereals and legumes, sugar and starch feedstocks, and oilseed-based inputs), alongside fermentation feedstocks used to produce clean label functional ingredients. Primary processing includes extraction, concentration, fermentation/bioprocessing, drying, and standardization to support consistent color, flavor, and functionality. These ingredients are then formulated into application-ready systems such as natural flavors and enhancers, hydrocolloids, sweetening systems, and preservation blends.
Regulatory compliance, specifications management, and traceability run through the chain, driven by the EU additive authorization regime (Regulation (EC) No 1333/2008) and ongoing specification updates that affect key texturizers and stabilizers. Midstream players include multinational ingredient manufacturers and specialized clean label suppliers that support application labs, pilot-scale validation, and co-development, with major processing and distribution hubs spanning Germany, France, the Netherlands, the United Kingdom, Spain, and Italy. Downstream, distributors supply beverage, bakery, dairy, and meat processors that translate ingredient functionality into finished products with simplified labels, while industry associations (for example, NATCOL for natural colors classification) shape technical understanding and market acceptance. Key bottlenecks include seasonal and weather-linked variability for natural inputs, cross-border logistics complexity, and the operational burden of keeping pace with EU additive specification changes (for example, Commission Regulation (EU) 2026/196, effective 18 August 2026, amending conditions and specifications for several hydrocolloids and modified starches used in clean label formulations).
Competitive Landscape
The European clean label ingredients market demonstrates significant fragmentation. This competitive landscape provides opportunities for both established multinational corporations and specialized ingredient suppliers to expand their market presence. Companies are actively leveraging innovation and strategic positioning to differentiate themselves in this dynamic environment. The market's fragmentation is driven by the diverse range of clean label ingredients, which include natural preservatives, plant-based proteins, and other functional ingredients. This diversity allows smaller players with specialized expertise to compete effectively against larger corporations, creating a level playing field in certain segments.
The increasing consumer demand for transparency, sustainability, and clean-label certifications has further intensified competition in the market. Companies are focusing on developing innovative solutions that align with these consumer preferences, such as clean-label formulations with minimal processing and recognizable ingredients. Additionally, the rise of plant-based and organic food trends has spurred the development of new product offerings, encouraging players to invest in research and development. This has led to a surge in partnerships, acquisitions, and collaborations as companies aim to strengthen their portfolios and enhance their market positioning.
Furthermore, the regulatory environment in Europe plays a crucial role in shaping the competitive dynamics of the clean label ingredients market. Stricter regulations regarding food labeling and ingredient transparency have compelled companies to adopt cleaner formulations and ensure compliance. This has created opportunities for ingredient suppliers to offer innovative solutions that meet regulatory standards while addressing consumer expectations. As a result, the market is witnessing a shift toward sustainable sourcing, clean-label certifications, and the development of functional ingredients that cater to health-conscious consumers. These factors collectively contribute to the evolving competitive landscape of the Europe Clean Label Ingredients Market.
Europe Clean Label Ingredient Industry Leaders
-
Archer Daniels Midland Company
-
Kerry Group PLC
-
Cargill, Incorporated
-
Tate & Lyle PLC
-
International Flavors & Fragrances
- *Disclaimer: Major Players sorted in no particular order
Market Opportunities and Future Outlook
Opportunities in Europe are closely tied to reformulation programs that reduce reliance on contentious additives and improve transparency in high-volume categories such as beverages and processed meats, where taste, texture, and shelf-life constraints drive demand for clean label functional systems (natural flavors, hydrocolloids, and preservation solutions). Regulatory activity and re-evaluation cycles also create openings for suppliers that can provide compliant alternatives with robust technical dossiers and application support, as food manufacturers work to meet Annex II conditions under Regulation (EC) No 1333/2008 while maintaining simplified ingredient lists.
Industry efforts on labeling modernization and streamlined approvals support near-term commercialization pathways for new clean label ingredients and systems. FoodDrinkEurope has advocated an EU-wide approach to digital labeling (February 2025) and, through 2025 action plans and position papers (July and September 2025), pushed for more predictable and simplified regulatory processes to support reformulation and innovation in sustainable food systems. On the regulatory science side, EFSA activity continues to influence portfolio decisions: its February 2026 re-evaluation opinion on sucralose (E 955) maintained the existing ADI, and EFSA updated guidance on scientific data requirements for food additive authorization applications effective for submissions starting 20 July 2026, raising the bar for data quality and favoring suppliers with stronger regulatory and analytical capabilities.
Recent Industry Developments
- June 2026: Cargill invested around EUR 56 million in Belgium to strengthen its European food innovation and manufacturing footprint, including a EUR 5.4 million extrusion pilot plant at the Vilvoorde Innovation Center. The added pilot capability supports faster prototyping and functionality testing for ingredients used in food and pet food, tightening the link between R&D and scalable clean label reformulation work.
- May 2026: ADM announced new protein ingredient solutions spanning launches in North America and Europe, centered on soy- and pea-based isolates and functional concentrates aligned with clean label and high-protein formulations. The broader portfolio push supports manufacturers working on texture and nutrition upgrades while keeping ingredient statements simple and familiar.
- July 2024: ADM introduced a European supply program for fully verified, segregated, and traceable soybean meal and oil aligned to upcoming EU deforestation-related requirements. The move strengthens downstream traceability options for ingredient buyers and supports clean label positioning where provenance and responsible sourcing are part of supplier qualification.
Research Methodology Framework and Report Scope
Market Definition and Coverage
For this study, the market covers ingredients used by food and beverage manufacturers in Europe when products are positioned with clean label claims, meaning simpler and recognizable ingredient declarations.
Scope exclusions: We exclude ingredients sold only for personal care, nutraceutical, or household-cleaning uses, even if the same chemistry could be used in food.
Segmentation Overview
- By Ingredient Type
- Food Preservatives
- Food Sweeteners
- Food Colorants
- Food Hydrocolloids
- Food Flavors and Enhancers
- Other Ingredients Types
- By Form
- Dry
- Liquid
- By Application
- Bakery and Confectionery
- Dairy and Frozen Desserts
- Beverages
- Meat and Meat Products
- Sauces, and Condiments
- Other Applications
- By Geography
- United Kingdom
- Germany
- Spain
- France
- Italy
- Netherlands
- Sweden
- Poland
- Belgium
- Rest of Europe
Data Sources, Market Sizing, and Validation
Desk Research
Desk work starts by mapping the demand pool in Europe and the rules that shape what can be claimed and labeled. We relied on public and official sources such as European Commission rules on food additives and labeling, EFSA opinions, Eurostat production and trade tables, and national food safety bodies for country-level clarifications. We also pulled supporting context from association websites and publications, including FoodDrinkEurope, plus peer-reviewed food science journals that discuss adoption patterns for natural colors, sweeteners, and texture systems.
Next, we reviewed supplier financial filings, investor presentations, and trade press to gauge pricing direction, reformulation activity, and where volumes are moving by application. When needed, we used paid subscriptions for company financial intelligence, patent databases, and shipment-level import/export data to cross-check reported footprints and the flow of key ingredient groups into Europe. These sources are illustrative, and we reviewed additional documents to fill gaps, validate inputs, and clarify edge cases.
Primary Interviews and Surveys
Primary interviews focused on matching the clean label scope to how buyers actually procure ingredients across bakery, dairy, beverages, and meat applications. We spoke with ingredient suppliers, distributors, and food manufacturers across major European markets to confirm mix shifts, typical price bands, and how substitutions move between synthetic and natural solutions. These discussions helped close gaps from public datasets, and we rechecked the assumptions across different respondent roles before finalizing the totals.
Distribution of primary research fieldwork respondents
| Company type | Respondent position |
|---|---|
| Top tier: 33% | CXOs: 13% |
| Mid tier: 51% | Functional/Unit leaders: 32% |
| Smaller Players: 16% | Managers: 55% |
Market-Sizing & Forecasting
Sizing is built first from a top-down demand reconstruction that follows Europe-level consumption and production signals in key processed foods, then links them to clean label reformulation intensity by application. The model uses practical inputs, such as packaged food output trends, import and export movement for key ingredient groups, the share of new and relaunched products carrying clean label style claims, and typical dosage and use rates for ingredient systems in bakery, dairy, beverages, and meat. Pricing is handled through blended average selling prices, adjusted by form (dry or liquid) and by function, since natural colors and natural sweeteners do not behave like hydrocolloids and preservative systems.
To keep totals grounded, we corroborate with selective bottom-up approximations, including sampled supplier revenue splits for Europe, channel checks with distributors, and volume times ASP checks for a small set of high-visibility ingredient families. Where direct visibility is limited, we use proxy demand indicators from adjacent applications and then tighten the ranges through interview feedback. For forecasting, we run scenario analysis around a core trajectory, since reformulation speed, regulatory actions, and commodity-linked input costs can change faster than a straight trend line.
Data Validation & Update Cycle
Validation is done by comparing the modeled market value with independent signals, such as processed food output, trade flows, and supplier commentary on regional demand, and then checking whether implied per-ton pricing is consistent. Outliers are investigated at the country and application level, and assumptions are revisited when the spread cannot be explained by known events such as crop shocks or regulatory changes. Before sign-off, the work is reviewed in multiple steps so the calculation logic, sources, and conversion choices remain consistent.
The report is refreshed annually, and interim updates are triggered when material events occur, for example major rule changes, sharp input cost movements, or large capacity additions. Before delivery, we complete a final pass to ensure the latest public releases and confirmed interview learnings are reflected in the numbers.
Mordor Intelligence's Europe Clean Label Ingredient Market Size Versus Other Published Estimates
Published market sizes for clean label ingredients in Europe can differ even when the growth story sounds similar, because the scope and counting logic are not the same. Differences usually come from what gets classified as clean label, how applications are grouped, and whether values are captured at the ingredient supply level or at the finished-food level.
Some published figures are broader because they fold in adjacent categories like organic foods, natural and specialty ingredients without a clear clean label filter, or they use retail value proxies instead. In Mordor Intelligence sizing, value is counted only for food-grade clean label ingredients sold into commercial food and beverage manufacturing in Europe, and it excludes ingredients sold exclusively into personal care, nutraceutical, or household-cleaning end uses.
Benchmark comparison
| Source | Market Size | Gaps in Research Methodology |
|---|---|---|
| Mordor Intelligence | USD 16.11 B (2025) | |
| Trade Journal A | USD 19.60 B (2025) | Uses a wider inclusion set that mixes clean label with broader natural and specialty ingredient sales, and it appears to include non-food end uses, which inflates totals versus a food-manufacturing-only view. |
| Industry Association B | USD 14.90 B (2024) | Relies on member-reported sales and a prior-year snapshot, and it can undercount smaller importers and multi-functional blends sold through distributors, which reduces the reported value. |
The spread across the table is mainly explained by how narrowly clean label is defined and whether the value is captured at the ingredient supplier sale into food production, or expanded to adjacent natural categories. By keeping the scope tied to a repeatable demand pool and rechecking pricing and use-rate assumptions with interviews, the final estimate stays traceable to clear inputs that can be refreshed each year.
Key Questions Answered in the Report
What is the current size of the Europe clean label ingredients market?
The market stands at USD 17.14 billion in 2026 and is forecast to reach USD 23.35 billion by 2031.
Which ingredient segment holds the largest share?
Food flavors and enhancers lead with 36.74% market share in 2025, reflecting their critical role in maintaining taste during reformulation.
Which application area is growing the fastest?
Meat and meat products are expanding at a 7.58% CAGR as processors seek natural preservation systems that meet strict safety requirements.
Why is Germany pivotal to market growth?
Germany contributes 22.05% of regional revenue and posts an 7.98% CAGR owing to its large processing sector and consumer insistence on non-GMO, locally sourced inputs.