
Market Overview
| Study Period | 2021 - 2031 |
|---|---|
| Forecast Data Period | 2026 - 2031 |
| Base Year Market Size (2025) | USD 4.19 Billion |
| Market Size (2026) | USD 4.41 Billion |
| Market Size (2031) | USD 5.67 Billion |
| Growth Rate (2026 - 2031) | 5.17 % |
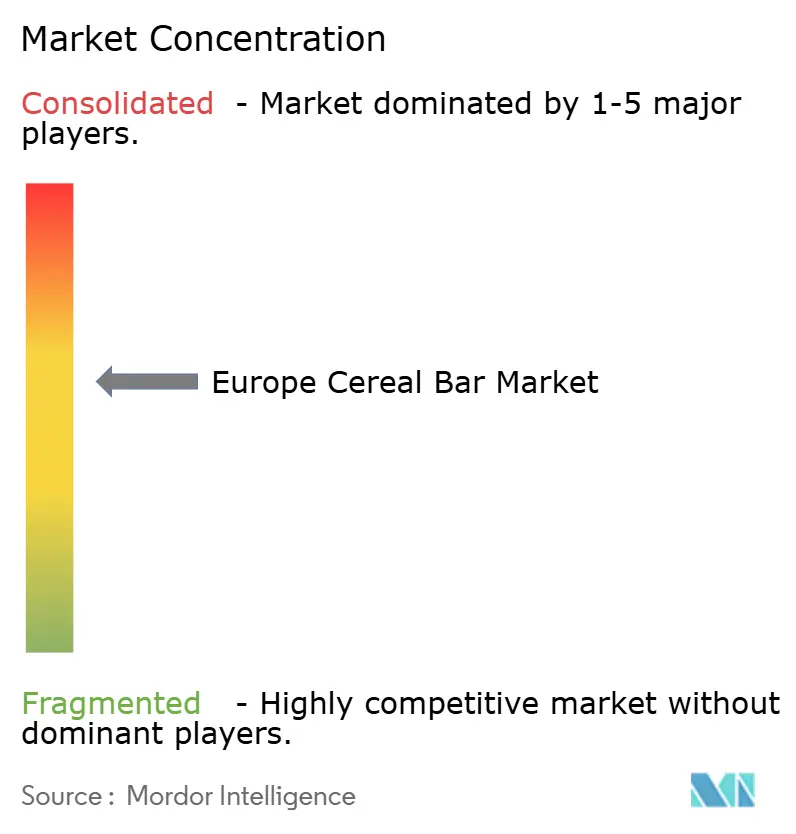
| Market Concentration | Medium |
Major Players *Disclaimer: Major Players sorted in no particular order Image © Mordor Intelligence. Reuse requires attribution under CC BY 4.0. | |
Europe Cereal Bar Market Analysis by Mordor Intelligence
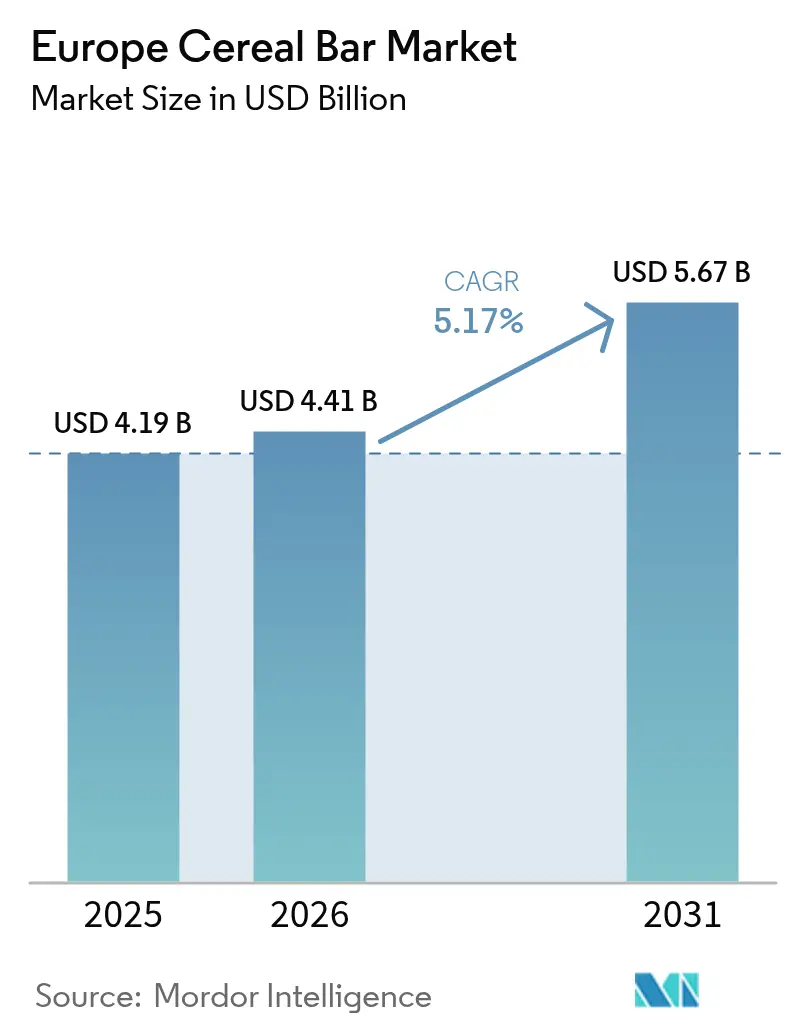
The Europe cereal bars market size in 2026 is estimated at USD 4.41 billion, growing from 2025 value of USD 4.19 billion with 2031 projections showing USD 5.67 billion, growing at 5.17% CAGR over 2026-2031. The market's growth stems from changing consumer preferences toward convenient and nutritious snacking options. Key growth drivers include increased health awareness, demand for high-protein and fiber-rich products, fitness trends, and product innovations in flavors and formats. Germany and the United Kingdom represent major market shares, while countries like Poland demonstrate significant growth potential. While supermarkets and hypermarkets continue to be the primary distribution channels, e-commerce is experiencing rapid growth due to increased digital adoption. The market faces challenges including concerns about sugar content, competition from other snack categories, and regulatory requirements. However, the Europe cereal bars market continues to expand as manufacturers adapt to meet consumer demands for healthier snacking alternatives.
Key Report Takeaways
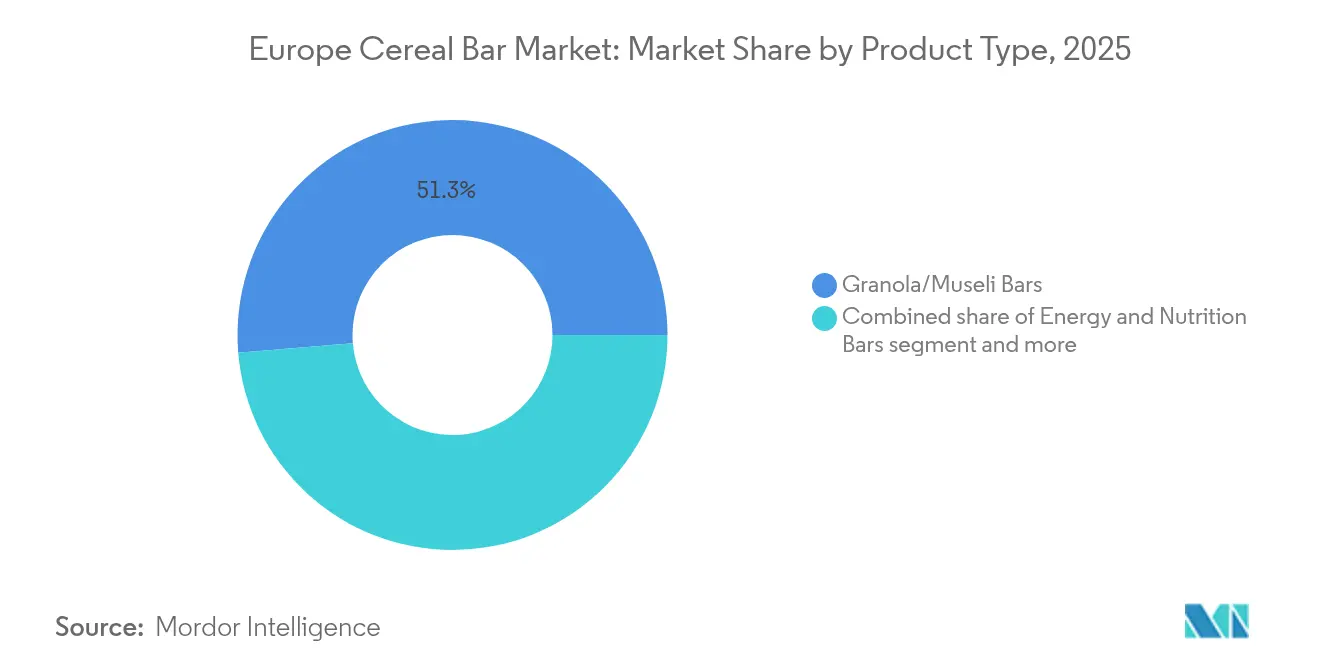
- Granola and muesli bars accounted for 51.32% of Europe's cereal bars market share in 2025; energy and nutrition bars are forecast to post a 6.13% CAGR to 2031.
- Conventional products held 72.65% revenue share in 2025; organic offerings are expected to grow at a 6.84% CAGR through 2031.
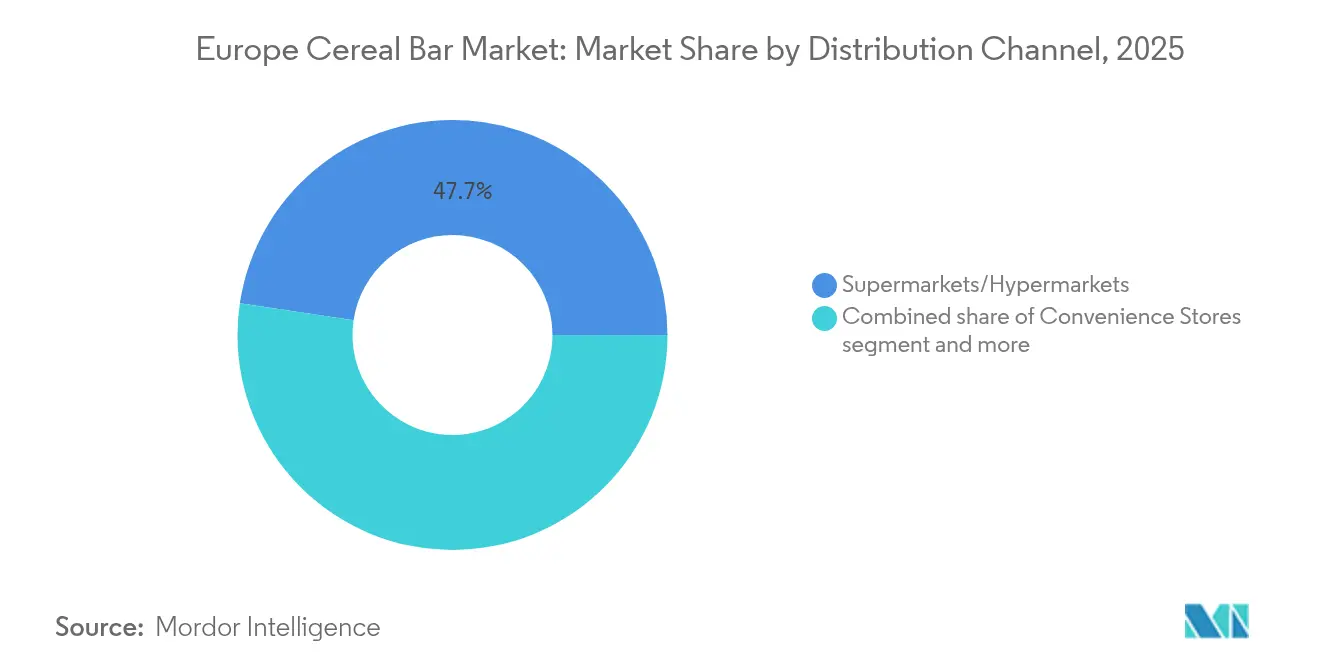
- Supermarkets and hypermarkets maintained a 47.65% revenue share in 2025; online stores are projected to register an 8.02% CAGR through 2031.
- Germany captured 18.05% of Europe's cereal bars market size in 2025; Poland is predicted to lead growth at a 6.08% CAGR to 2031.
Note: Market size and forecast figures in this report are generated using Mordor Intelligence’s proprietary estimation framework, updated with the latest available data and insights as of 2026.
Europe Cereal Bar Market Trends and Insights
Drivers Impact Analysis*
| Driver | (~) % Impact on CAGR Forecast | Geographic Relevance | Impact Timeline |
|---|---|---|---|
| Convenience-driven on-the-go snacking trend | +1.2% | Global, strongest in Germany and the United Kingdom urban centers | Medium term (2-4 years) |
| Growing preference for high-protein and fiber-rich bars | +1.8% | Europe-wide, led by Nordic countries and Germany | Long term (≥ 4 years) |
| Growing fitness trends fuel the consumption of cereal bars | +1.1% | Western Europe core, expanding to Eastern Europe | Medium term (2-4 years) |
| Innovation in flavors and formats | +0.8% | Innovation hubs: Germany, Netherlands, the United Kingdom | Short term (≤ 2 years) |
| Rising awareness of dietary restrictions | +0.9% | Northern and Western Europe, gradual Eastern adoption | Long term (≥ 4 years) |
| Health and wellness trends | +1.4% | Pan-European with premium positioning | Long term (≥ 4 years) |
| Source: Mordor Intelligence | |||
Convenience-driven on-the-go snacking trend
The European cereal bar market is primarily driven by the increasing demand for convenient, on-the-go snacking options. As consumers manage busier lifestyles, they seek portable and nutritious snacks that integrate seamlessly into their daily schedules. Cereal bars meet these requirements through their practical packaging and nutritional benefits, making them a preferred choice for consumption outside homes and workplaces. This preference is particularly evident among young consumers and working professionals who prioritize products combining nutrition with convenience. According to the Italian National Institute of Statistics (Istat), in 2023, 65.2% of Italian children aged 11-13 consumed snacks at least once per week [1]. This high snacking frequency among the younger population reflects broader European consumption patterns favoring convenient options like cereal bars. The market's alignment with current consumer preferences for convenient and health-conscious snacking supports its continued growth across Europe.
Growing preference for high-protein and fiber-rich bars
The growing consumer preference for high-protein and fiber-rich bars drives the European cereal bar market. Health-conscious consumers seek convenient snack options that provide functional benefits, including sustained energy, digestive health, and satiety. Products containing protein and dietary fiber align with these nutritional goals, making cereal bars a preferred choice for individuals focusing on active lifestyles, weight management, and overall wellness. This emphasis on nutrient-dense formulations has encouraged manufacturers to enhance their product offerings to meet the demand for healthier snacking alternatives. For instance, in August 2025, Kellogg's expanded its United Kingdom presence by launching Oaties cereal bars, containing 55% wholegrain oats and serving as a fiber source. These bars, available in Chocolate & Oat and Honey and Oat flavors, combine taste with nutritional value. This product launch demonstrates how companies are responding to the demand for high-fiber and whole-grain-based cereal bars, strengthening their market position.
Growing Fitness Trends Fuel Consumption of Cereal bars
The rising fitness trend significantly drives cereal bar consumption in the European market. The increasing adoption of active and health-conscious lifestyles has created demand for convenient, nutritious snacks that support energy replenishment, muscle recovery, and wellness. Cereal bars, particularly those fortified with protein and functional ingredients, serve fitness enthusiasts and athletes seeking quick, portable snack options to complement their workout routines. According to Sport England, fitness class participation in England increased from 6.29 million people to 6.69 million between November 2023 and November 2024 [2]. This growth in fitness participation aligns with the broader European shift toward healthier living and physical activity, contributing to the increased consumption of cereal bars among active consumers. The expanding fitness-focused consumer base strengthens the market growth for cereal bars designed to provide nutritional support for active lifestyles.
Innovation in flavors and formats
Product innovation in flavor profiles and format diversification continues to be a significant growth driver in the European cereal bar market. Consumer preferences have evolved beyond fundamental nutritional requirements to encompass sophisticated taste experiences and distinctive textural elements in snack products. Manufacturing companies are implementing strategic product development initiatives to create differentiated flavor combinations and innovative formats, thereby expanding their market presence. These product developments align with current market trends, including clean-label ingredient incorporation and functional nutritional benefits, which strengthen competitive positioning. In August 2025, Cadbury introduced its Cadbury Brunch Choc Chip cereal bars, incorporating a structured combination of cereals such as oats, bran flakes, and rice crispies, honey integration, chocolate chip elements, and Cadbury milk chocolate coating. This product introduction exemplifies the industry's approach to developing nutritionally balanced convenience products with premium ingredients.
Restraints Impact Analysis*
| Restraint | (~) % Impact on CAGR Forecast | Geographic Relevance | Impact Timeline |
|---|---|---|---|
| High sugar content concerns | -1.1% | European Union-wide, strictest in Nordic countries | Medium term (2-4 years) |
| Competition from alternative snacks | -0.8% | Mature markets: Germany, the United Kingdom, and France | Short term (≤ 2 years) |
| Supply-chain volatility for specialty proteins | -0.7% | Import-dependent regions, Eastern Europe impact | Short term (≤ 2 years) |
| Saturated shelf space in mature retail markets | -0.6% | Western Europe retail concentration | Medium term (2-4 years) |
| Source: Mordor Intelligence | |||
High Sugar Content Concerns
Health concerns regarding high sugar content constrain the growth of the European cereal bar market. Consumers are increasingly aware of the health risks associated with excessive sugar consumption, including obesity, diabetes, and cardiovascular diseases, leading to higher demand for low-sugar or sugar-free options. Consumers examine product labels more thoroughly and frequently avoid snacks with high sugar content. This consumer behavior shift creates challenges for manufacturers who must reformulate products while maintaining taste and texture, a process that involves technical complexity and increased costs. European regulatory requirements and public health initiatives focused on sugar reduction further pressure cereal bar manufacturers. These factors restrict market growth by reducing the appeal of conventional cereal bars and creating obstacles for companies dependent on sugar-based formulations.
Competition from Alternative Snacks
The European cereal bar market encounters substantial competition from alternative snack products. The market demonstrates an extensive range of convenient and nutritious snacking alternatives, encompassing nuts, seeds, fruit bars, vegetable chips, protein clusters, and fresh fruit, which directly compete with cereal bars in consumer expenditure allocation. Alternative snacks frequently address specific consumer requirements, including whole-food ingredient composition, minimal processing methodologies, and specialized dietary specifications. The increasing consumer preference for specialty snacks with enhanced nutritional compositions and innovative product formulations further intensifies market competition. This competitive landscape necessitates substantial investments from cereal bar manufacturers in product innovation and differentiation strategies, subsequently resulting in elevated production expenses and increased market volatility.
*Our forecasts treat driver/restraint impacts as directional, not additive. The impact forecasts reflect baseline growth, mix effects, and variable interactions.
Segment Analysis
By Product Type: Energy Bars Drive Premium Positioning
Granola and muesli bars dominate the European cereal bar market with a 51.32% market share in 2025. This dominance stems from consumer preference for wholesome ingredients and health benefits. These bars meet the increasing demand for convenient, nutritious snacking options, particularly among health-conscious consumers with active lifestyles. The products offer diverse flavors, textures, and ingredient combinations, incorporating oats, nuts, dried fruits, seeds, and natural sweeteners. The category benefits from consumer preferences for natural, organic, and functional food products, as these bars typically contain clean-label and minimally processed ingredients.
Energy and nutrition bars are projected to grow at a CAGR of 6.13% through 2031. This growth reflects increasing consumer demand for convenient options with enhanced nutritional benefits, including higher protein content, added vitamins, and sustained energy release. Rising health and fitness awareness has positioned these bars as popular meal supplements and portable energy sources. Manufacturers are developing new formulations with functional ingredients such as protein isolates, energy-boosting compounds, and natural sweeteners to address specific dietary requirements, including keto, paleo, and plant-based diets.

By Functional Claim: Organic Acceleration Despite Conventional Dominance
In the European cereal bar market, conventional products maintain a predominant market position, accounting for 72.65% market share in 2025. This substantial market presence is attributed to their extensive retail distribution, cost-effective pricing structures, and comprehensive flavor portfolios. Conventional cereal bars function as efficient nutritional solutions for consumers seeking convenient, portable sustenance. Major manufacturers sustain their market dominance through sophisticated distribution networks and established brand equity. Furthermore, established consumer purchasing patterns and product familiarity contribute significantly to maintaining the conventional segment's market supremacy.
The organic cereal bar segment in Europe demonstrates substantial growth prospects, with projections indicating a compound annual growth rate (CAGR) of 6.84% through 2031. This trajectory reflects an increasing consumer migration toward nutritionally superior, naturally derived, and environmentally sustainable food alternatives. Market demand is primarily driven by heightened food safety consciousness, environmental sustainability considerations, and consumer preferences for products free from synthetic agricultural chemicals and artificial additives. The German Organic Food Federation's statistical analysis reinforces this market development, documenting an increase in organic food revenues from EUR 16.06 billion in 2023 to EUR 16.99 billion in 2024, demonstrating enhanced market penetration of organic cereal bars among health-conscious consumers .
By Distribution Channel: E-commerce Transforms Retail Dynamics
Supermarkets and hypermarkets maintained a significant market share of 47.65% in 2025, establishing their position as primary distribution channels. These retail formats offer extensive reach and accessibility, serving consumers who prefer consolidated shopping experiences for their daily needs, including cereal bars. The prominence of these retail formats is strengthened through strategic partnerships and product launches that improve product visibility. In January 2024, Deliciously Ella expanded its distribution through major retailers Asda and The Co-op. The brand's product range, including granolas, cereal bars, and nut bites, is available in these stores, demonstrating effective market penetration through established retail channels. These partnerships enhance sales and build consumer confidence through association with established retail chains.
Online stores in the European cereal bar market are experiencing rapid growth, with a projected compound annual growth rate (CAGR) of 8.02% through 2031. This expansion stems from consumers' increasing preference for digital shopping and access to diverse cereal bar options not typically found in traditional retail outlets. E-commerce platforms enable consumers to purchase specialized, niche, and premium cereal bars, including organic, vegan, and functional varieties, directly from manufacturers or authorized sellers. The integration of online marketing tools, customized product suggestions, and subscription options has improved the digital shopping experience, resulting in increased customer retention and recurring purchases.
Geography Analysis
Germany holds an 18.05% market share in 2025, making it Europe's largest cereal bar market. The country's dominance stems from its established health-conscious culture, comprehensive retail infrastructure, and consumers' acceptance of premium pricing for functional nutrition products. The market's maturity and efficient distribution networks ensure wide product availability and consistent demand for wellness-oriented cereal bars.
Poland exhibits the highest growth rate in Europe, with a projected CAGR of 6.08% through 2031. Rising disposable income, urbanization, and shifting consumer preferences toward convenient nutrition drive this expansion. The growing middle class and increased health awareness are driving Polish consumers toward on-the-go snacking options, creating opportunities in the cereal bar segment.
The United Kingdom and France maintain stable markets with established consumption patterns, showing growth potential through premium products and functional innovations. Spain, the Netherlands, Belgium, and Sweden offer distinct growth opportunities based on local consumer preferences and regulations. The Netherlands shows notable progress in e-commerce adoption and sustainability awareness, with dietary surveys indicating trends toward reduced sugar and salt intake and increased fiber consumption, suggesting heightened demand for healthier cereal bars.
Regulatory Landscape
Cereal bars sold across Europe must comply with the EU Food Information to Consumers framework (Regulation (EU) No 1169/2011), which sets labeling requirements including ingredient lists, allergen declarations, and mandatory nutrition information. This baseline has increased scrutiny on sugar-related positioning and on-pack nutrition communication, particularly for products marketed with functional benefits.
Formulation innovation is also shaped by the EU Novel Food regime (Regulation (EU) 2015/2283) and the European Food Safety Authority (EFSA) assessment process, with market access linked to inclusion in the Union List of Novel Foods. Recent examples include Commission Implementing Regulation (EU) 2026/1219 authorizing inulin-propionate ester and Commission Implementing Regulation (EU) 2026/397 authorizing lacto-N-tetraose, highlighting that new functional ingredients used in cereal-bar-style applications must be formally authorized before commercialization.
Competitive Landscape
The European cereal bars market shows moderate concentration, with competition driven by consolidation and innovation. Major players include General Mills, Inc., Nestlé S.A., Mars, Incorporated, Mondelēz International, Inc., and Hero Group. These companies influence market trends and consumer preferences through their established presence and extensive distribution networks.
Companies compete primarily through innovation, using their patent portfolios to develop new technologies. These include methods for extending shelf life, protein-sweetener binding systems, and incorporation of functional ingredients to improve product quality and meet consumer demands for healthy, convenient options.
Manufacturing and supply chain operations are evolving through increased technology adoption. Companies are investing in precision fermentation and alternative protein sources. These technological improvements enable product diversification, help manage ingredient costs, and address sustainability and nutritional requirements.
Europe Cereal Bar Industry Leaders
-
General Mills, Inc.
-
Nestlé S.A.
-
Mars, Incorporated
-
Mondelēz International, Inc.
-
Hero Group
- *Disclaimer: Major Players sorted in no particular order
Market Opportunities and Future Outlook
Manufacturers have an actionable opportunity in aligning reformulation and functional benefits with regulation-aligned communication, as sugar concerns and label scrutiny affect shopper choices at shelf and online. Recent product activity in the region, including Kellogg's Oaties launch in the United Kingdom (positioned around wholegrain oats and fiber) and Cadbury Brunch bar line extensions, points to demand for differentiated taste-plus-nutrition propositions that work in mainstream retail and remain easy to interpret on pack.
Packaging updates are another concrete area to watch. The Packaging and Packaging Waste Regulation (EU) 2025/40 (adopted 19 December 2024) tightens requirements on packaging recyclability and circular-economy outcomes, giving cereal-bar brands and private labels a basis to refresh packaging formats and materials while improving shelf readiness for e-commerce fulfillment. Ingredient innovation using upcycled or fiber-forward inputs, including brewer's spent grain referenced in recent academic research for cereal-bar formulation, can also support higher-fiber positioning, provided claims are substantiated through compliant, traceable documentation.
Recent Industry Developments
- May 2026: Mars, Incorporated announced a GBP 190 million investment in its Slough, United Kingdom manufacturing site to modernize operations and lift output to about 5 million bars per day. The added capacity and upgraded production capability strengthen local supply resilience for bar-format snacks and support broader European distribution.
- September 2025: Mars, Incorporated stated a commitment to invest EUR 1 billion across its European Union operations by the end of 2026 to enhance manufacturing capability and innovation. The program signals sustained capital allocation to regional production footprints that can influence capacity availability, co-manufacturing dynamics, and speed-to-market for snack innovations.
- September 2024: MadeGood entered the United Kingdom with a snack portfolio that includes granola bars and soft baked oat bars. This expansion broadened brand choice in a core European market and increased competitive intensity for better-for-you propositions positioned around free-from and family-friendly snacking.
Research Methodology Framework and Report Scope
Market Definition and Coverage
For this study, the Europe cereal bar market is defined as packaged cereal-based bars sold for retail consumption across European countries and measured in value terms. The coverage follows the products as they are sold through common retail and online channels, using a consistent USD conversion for comparisons.
Scope exclusions: We do not include adjacent snack formats that are not positioned and sold as cereal bars (for example, confectionery bars, protein powders, or baked cookies), even if they target similar occasions.
Segmentation Overview
- By Product Type
- Granola/Muesli Bars
- Energy and Nutrition Bars
- Others
- By Functional Claim
- Organic
- Conventional
- By Distribution Channel
- Supermarkets / Hypermarkets
- Convenience Stores
- Specialty Stores
- Online Stores
- Other Distribution Channels
- By Geography
- Germany
- United Kingdom
- Italy
- France
- Spain
- Netherlands
- Poland
- Belgium
- Sweden
- Rest of Europe
Data Sources, Market Sizing, and Validation
Desk Research
Desk research starts with building a clean fact base on packaged snack foods and cereal based products in Europe, and then narrowing it to cereal bar definitions used in trade and retail. We reference public sources such as Eurostat for household spend and price indices, national statistics offices for consumer price series, and customs trade data systems for import and export direction checks where relevant.
To keep assumptions realistic, we also review sources such as food standards and labeling guidance from European and national regulators, trade association publications, and peer reviewed nutrition and packaged food journals that discuss reformulation and ingredient trends. Company annual reports, investor presentations, and reputable press are used to confirm distribution shifts, channel priorities, and product positioning. In a few places, paid subscriptions for company financials and news, patent databases, and shipment level import and export datasets are used to fill gaps on supplier activity and category movement. These sources are illustrative, and many other public references were also used for data collection, validation, and clarification during the research.
Primary Interviews and Surveys
Primary work is used to pressure test the desk assumptions on how cereal bars are defined in shelves, how pricing shifts over time, and how channel mix differs by country. We speak with stakeholders across manufacturing, branded sales, retail category teams, and ingredient and packaging participants, and the inputs are balanced across Western Europe and other active European markets so the model does not lean on one country view.
Distribution of primary research fieldwork respondents
| Company type | Respondent position |
|---|---|
| Top tier: 30% | CXOs: 13% |
| Mid tier: 55% | Functional/Unit leaders: 38% |
| Smaller Players: 15% | Managers: 49% |
Market-Sizing & Forecasting
Sizing is built using a top-down approach, where retail food spend and packaged snack indicators are reconstructed into a cereal bar demand pool by applying category shares and channel splits that were confirmed through interviews. The model is then checked using selective bottom-up approximations, such as sampled price points by channel and product type, combined with observed sales intensity and distribution breadth, which helps us adjust totals when the first pass looks off.
Inputs that influence the model include price and promotion intensity for packaged snacks, shifts between supermarkets and convenience stores versus online stores, the mix between granola or muesli bars and energy and nutrition bars, the organic versus conventional split, and consumer health and on-the-go snacking trends that change purchase frequency. Forecasting is done using scenario analysis supported by short trend models (exponential smoothing on key series like price growth and channel mix), and the final path is aligned to what respondents expect on reformulation, premiumization, and retailer space allocation. When a country level data point is missing, the gap is handled through proxying with similar markets based on income levels, modern retail penetration, and observed channel structures, before it is rechecked with expert feedback.
Data Validation & Update Cycle
Validation happens in layers, so the output is not dependent on one spreadsheet run. We compare the results against independent signals like packaged snack inflation trends, retail channel growth patterns, and the implied price per bar movement, and then investigate large variances before sign-off.
A second analyst review is completed to recheck formulas, unit consistency, and country aggregation logic, and follow-up calls are triggered when a key assumption changes or a respondent view strongly conflicts with the desk evidence. Reports are refreshed annually, and interim updates are made when material events occur, such as major label changes, channel disruptions, or sudden commodity driven pricing shifts. Before delivery, a final pass is completed so clients receive the most recent updated view.
Mordor Intelligence's Europe Cereal Bar Market Sizing Compared With Other Published Estimates
It is normal to see different market sizes for Europe cereal bars because publishers do not always count the same products, years, and price assumptions. Differences also come from how country totals are built up, how online sales are treated, and how often the model is refreshed when pricing and promotions change.
Some published numbers appear to fold in a wider snack bar set and then apply a single growth curve across Europe, which can lift the total even when cereal bar penetration is uneven by country. In Mordor Intelligence, the value is limited to cereal bars as sold through defined retail and online channels, with product types and organic versus conventional splits checked through interview based channel and pricing logic before the total is finalized.
Benchmark comparison
| Source | Market Size | Gaps in Research Methodology |
|---|---|---|
| Mordor Intelligence | USD 4.19 B (2025) | |
| Global Databook Publisher A | USD 5.43 B (2024) | Uses an earlier base year and a segment structure that can capture broader snack bar value under cereal bar labels, and the higher growth rate assumption tends to compound the gap when carried forward. |
| Trade Journal B | USD 4.80 B (2025) | Often reported as a headline Europe figure with limited transparency on country weighting, online inclusion rules, and currency timing, which can shift totals when pricing and promotions move quickly. |
Looking across the table, the spread mostly comes from product set choices, base year timing, and how pricing and channel mix are treated. Our approach keeps the estimate traceable to observable levers like channel splits, product type mix, and realistic price progression, and it stays repeatable when the same steps are applied country by country.
Key Questions Answered in the Report
What is the projected value of the Europe cereal bars market in 2031?
It is expected to reach USD 5.67 billion by 2031, up from USD 4.19 billion in 2025.
Which product segment is growing fastest in Europe?
Energy and nutrition bars are forecast to expand at a 6.13% CAGR through 2031.
How significant is organic certification in European cereal bars?
Organic variants are predicted to grow at a 6.84% CAGR, propelled by stricter EU rules that raise consumer trust.
Which country currently leads European cereal-bar sales?
Germany held 18.05% of 2025 sales, supported by high Nutri-Score awareness and mature retail infrastructure.