
Europe Blueberry Market Analysis by Mordor Intelligence
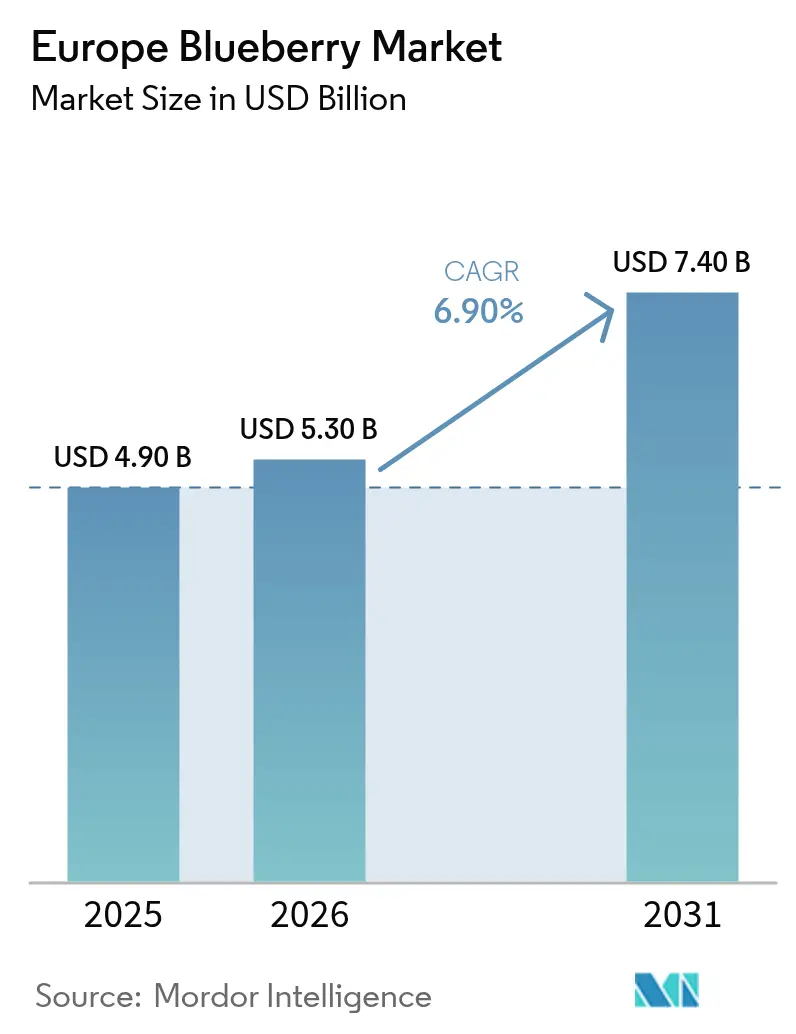
The Europe blueberry market size is projected to expand from USD 4.9 billion in 2025 and USD 5.3 billion in 2026 to USD 7.4 billion by 2031, registering a CAGR of 6.9% between 2026 and 2031. Robust consumer demand for nutrient-dense snacks, multi-year sourcing contracts that shift retail risk onto growers, and rapid tunnel adoption that lengthens the harvest season underpin this trajectory. Spain maintains its leadership in supply because Huelva province harvests premium fruit in December when wholesale prices peak. Germany anchors consumption as retailers position blueberries as convenient functional food, while Poland posts double-digit production gains by coupling tunnel systems with mechanical harvesters. Ongoing consolidation among packers and breeders strengthens their negotiating power with supermarkets, yet moderate concentration leaves room for regional cooperatives to scale proprietary cultivars and capture margins.
Key Report Takeaways
- By geography, Germany commanded a 24.8% share of the Europe blueberry market size in 2025 and is advancing at a 9.5% CAGR through 2031.
Note: Market size and forecast figures in this report are generated using Mordor Intelligence’s proprietary estimation framework, updated with the latest available data and insights as of 2026.
Europe Blueberry Market Trends and Insights
Drivers Impact Analysis*
| Driver | (~) % Impact on CAGR Forecast | Geographic Relevance | Impact Timeline |
|---|---|---|---|
| Rising adoption of controlled-environment agriculture | +1.8% | Spain, the Netherlands, Poland, Germany, the United Kingdom, France, and Italy | Medium term (2-4 years) |
| Expansion of mechanized harvesting technologies | +1.2% | Poland, Spain, the Netherlands, and Germany | Medium term (2-4 years) |
| Growing demand for antioxidant-rich snack ingredients | +1.5% | Europe with the strongest pull in Germany and the United Kingdom | Long term (≥ 4 years) |
| European Union specialty-crop financial support programs | +1.3% | All member states, strongest uptake in Spain and Poland | Long term (≥ 4 years) |
| Retail-chain private-label grower contracts | +1.4% | Western Europe retail hubs | Medium term (2-4 years) |
| Blueberry inclusion in nationally funded school-meal standards | +0.9% | Germany, Poland, the United Kingdom, France, Spain, Italy, the Netherlands | Long term (≥ 4 years) |
| Source: Mordor Intelligence | |||
Rising Adoption of Controlled-Environment Agriculture
High‑tunnel systems in Huelva enable a December blueberry harvest, allowing growers to secure pre‑holiday premiums, and in 2026, blueberries covered approximately 3,800 hectares. Severe February storms damaged infrastructure and caused up to 50% early strawberry losses. Daifressh is expanding blueberry tunnels in Poland from 10 hectares in 2024 to 100 hectares by 2030, showcasing profitability in marginal climates through protected cultivation. Dutch producers have adopted advanced substrate systems, which have tripled strawberry yields. In 2025, around 591 hectares are under protected cultivation, while open-field production is around 724 hectares[1]. Tunnel culture reduces fungicide sprays by lowering leaf wetness, aligning with European pesticide-reduction targets. Retailers reward this consistency with multi-year contracts that smaller open-field farms struggle to secure.
Expansion of Mechanized Harvesting Technologies
Mechanized harvesting directly shapes the Europe blueberry market by easing the region’s most acute constraint, seasonal labor. Over-the-row pickers reduce harvesting labor from 120 person-hours to 15 machine-hours per hectare, helping growers in Poland, Spain, and Italy stabilize costs and stay competitive despite wage inflation within the Jagoda Jps. European growers are using mechanical harvesters with soft-robotic grippers from the International Federation of Adapted Physical Activity (IFAPA) and vibration-tuned models from the University of Turin, reducing damage rates to 4.5% and meeting private-label standards for the fresh market. Nurseries such as Fall Creek now breed uniform-ripening cultivars for one-pass mechanical picking, a shift that raises pack-out efficiency, extends shelf life, and trims shrink, all of which bolster growers’ margins in a market where retailers negotiate on delivered cost per clamshell fallcreeknursery.com. As mechanization scales across flat Polish farms and gradually penetrates Spain’s sloped Huelva orchards, labor-related volatility eases, reinforcing the supply reliability that European supermarkets demand and underpinning continued regional output growth.
Growing Demand for Antioxidant-Rich Snack Ingredients
German shoppers consumed 1.2 kilograms per capita in 2025 as retailers marketed blueberries as cognitive and cardiovascular aids[2]. Food manufacturers have reformulated yogurt, cereal bars, and smoothie packs to include natural anthocyanins, with processed blueberry ingredients anticipated to comprise 22% of the European market value by 2025. United Kingdom campaigns linked daily portions to science-backed benefits, lifting household penetration to a trend of 60%. I Fresh-market distributors increasingly prioritize varieties with extended shelf life and strong visual appeal, strengthening year‑round programs with retailers. Although seasonal price fluctuations remain, growers value the reliable retail programs that provide a stable demand baseline and greater planning security.
European Union Specialty-Crop Financial Support Programs
Under the 2023–2027 Common Agricultural Policy (CAP), eco-schemes allocate EUR 8.9 billion (USD 10.47 billion) annually to support sustainable practices like drip irrigation and integrated pest management. High-value crops, such as blueberries, attract significant investment to meet European Union (EU) Green Deal objective[3]. The Junta de Andalucía allocated subsidies covering 40% of capital costs for tunnel modernization across a designated 1,200 hectares in 2024. These subsidies are conditional upon farms obtaining LEAF or Global Good Agricultural Practices GlobalG.A.P. certification to comply with European Union (EU) sustainability requirements. Poland has allocated a significant portion of its EUR 823 million (USD 967.88 million) Common Agricultural Policy (CAP) processing budget and Knowledge Process Outsourcing (KPO) funds to modernize cold storage and harvesting equipment, boosting its record exports to Germany, which exceeded EUR 8 billion (USD 9.41 billion) in the first half of 2025. France backed varietal nurseries to double national output by 2030. Compliance costs for water audits and biodiversity buffers squeeze smallholders, pushing acreage toward firms with administrative scale.
Restraints Impact Analysis*
| Restraint | (~) % Impact on CAGR Forecast | Geographic Relevance | Impact Timeline |
|---|---|---|---|
| Labor shortages during peak harvest windows | -1.1% | United Kingdom, Poland, Spain, Germany, France, Italy, and the Netherlands | Short term (≤ 2 years) |
| Rising incidence of mummy-berry and scorch virus | -0.7% | Poland, Germany, the Netherlands, Italy, Switzerland, Spain, and France | Medium term (2-4 years) |
| Farm-gate price volatility from off-season import surges | -0.9% | Spain, the Netherlands, Germany, the United Kingdom, France, Italy, and Poland | Short term (≤ 2 years) |
| Stricter water-use regulations in southern Europe | -0.6% | Spain, Italy, and France | Long term (≥ 4 years) |
| Source: Mordor Intelligence | |||
Labor Shortages During Peak Harvest Windows
Irregular border crossings into the European Union (EU) dropped by 22% in 2025, but the agricultural sector still faces a labor shortage. Consequently, Italy and the United Kingdom have raised seasonal worker quotas to record levels to sustain harvest productivity. In 2024, United Kingdom farms left 12% of their fruit unharvested due to 8,500 unfilled seasonal worker vacancies, prompting 71% of growers to invest in automation and Agri-Tech despite high initial costs. Poland relied on Ukrainian workers, whose numbers dropped sharply after wartime mobilization, while German vegetables lured pickers with higher hourly pay. Moroccan visa delays for the early 2026 harvest led some Huelva producers to offer premiums of up to EUR 12 (USD 14.11) per hour, reducing profit margins by an estimated 18%.
Rising Incidence of Mummy-Berry and Scorch Virus
Blueberry scorch virus is a key phytosanitary concern in Poland. The industry focuses on vector control and testing resistant varieties to sustain its 12,500-hectare production through 2026. Germany documented outbreaks in Lower Saxony and Bavaria that prompted neonicotinoid-free aphid programs, increasing operating costs. The mummy-berry fungus threatens blueberry production in the United Kingdom, France, and the Netherlands, with fungicide applications costing GBP 450 (USD 608) per hectare to prevent yield losses of up to 50%. Italian research showed infection peaks during bloom, but many small farms lack weather stations for precise sprays. Retail audits penalize orchards with repeat infections, jeopardizing long-term contracts and accelerating exits.
*Our forecasts treat driver/restraint impacts as directional, not additive. The impact forecasts reflect baseline growth, mix effects, and variable interactions.
Geography Analysis
Germany remains the consumption engine, accounting for a 24.8% share in the Europe blueberry market size, and is anticipated to register the fastest growth at 9.5% CAGR by 2031. The growing import accounting for around 34,600 metric tons to satisfy demand for functional snacking, while domestic acreage stabilizes under 8,500 hectares. Spain retained leadership with 31.2% production share in 2025, and harvests of 66,600 metric tons that feed winter exports, yet strict irrigation caps on the Doñana aquifer threaten expansion and raise compliance costs. Poland leads European blueberry production, with annual growth of 25% over the past few years. The industry focuses on covered cultivation and mechanization across 13,000 hectares to boost exports to Germany and the United Kingdom. The Netherlands, Europe’s primary logistics hub, imports over 87,000 metric tons of blueberries, projected to reach 114,000 metric tons by 2026. Of this, 88% is re-exported, shaping regional price signals and supply chains.
France pursues subsidy-driven plans to double output by 2030 and leans on organic niches to win shelf space. The United Kingdom’s reliance on Spanish and Polish fruit persists as local labor shortages curb acreage growth despite retailer backing. Italy adds capacity in Piedmont and Veneto, but yields decline due to water caps and drought stress along the Po River. Portugal and Romania offer low-cost expansion sites for integrated groups and breeders targeting Central Europe.
Northern regions benefit from ample rainfall and fewer irrigation rules, drawing investment away from drought-prone southern Spain and Italy. Eastern Europe gains traction as supply chain diversification hedges import volatility from Southern Hemisphere origins. Logistics corridors anchored in Rotterdam and Hamburg shorten lead times, enabling retailers to better calibrate supply to weekly promotions. Over the forecast, acreage migrates northward while southern leaders protect share through premium genetics and organic certification.
Regulatory Landscape
Blueberries traded within Europe operate under EU-wide food safety and plant health rules, with pesticide Maximum Residue Levels set under Regulation (EC) No 396/2005 and enforced through residue monitoring and buyer testing regimes. For fresh-market sales, blueberries fall under the EU general marketing standards for fruit and vegetables, including labeling and marketable-quality requirements, under Commission Delegated Regulation (EU) 2023/2429, which affects packhouse grading, lot identification, and retail compliance.
For imports into the EU, phytosanitary compliance under the Plant Health Law (Regulation (EU) 2016/2031) and the quarantine pest framework in Implementing Regulation (EU) 2019/2072 (as amended) drive pre-export controls, phytosanitary certification, and border inspection processes. These public requirements typically run alongside retailer and brand specifications such as GLOBALG.A.P. and audited traceability systems, which increases compliance and documentation needs for growers, exporters, and packers supplying Western European retail programs.
Value Chain Analysis
The Europe blueberry value chain begins with plant material and inputs (nurseries and genetics providers, substrate and irrigation suppliers, crop protection, and tunnel or protected-cultivation infrastructure). It then moves into farm production across open-field and protected systems, followed by harvesting (manual and increasingly mechanized). Packhouses and service providers handle sorting, grading, residue and quality assurance, and clamshell packaging before cold-chain distribution into wholesale markets, foodservice, and retailer distribution centers, with logistics hubs such as the Netherlands playing a larger role in import aggregation and re-export.
Downstream, supermarkets and their private-label programs set specifications for firmness, shelf life, and certification compliance, pushing growers toward multi-year supply arrangements and standardized quality systems. Bottlenecks center on peak-season labor availability, cold storage and rapid pre-cooling capacity, and promotional-week supply synchronization. As a result, larger grower groups and integrated marketers have increased investments in mechanical harvesting, automated grading, and centralized packing platforms.
Competitive Landscape
The combined top five account for the majority of Europe blueberry market share, leaving ample room for cooperatives that specialize in niche varieties or organic premiums. Driscoll’s led the Europe blueberry market with a significant revenue share in 2025 by coupling Iberian and Dutch packhouses with its 2022 purchase of Berry Gardens United Kingdom, which added local grower alliances and new export routes. Hortifrut followed, with its acquisition of Atlantic Blue for EUR 241 million (USD 254 million), lifting regional volume by 25% in 2024 and supporting the NaturAll on-the-branch launch targeting premium retailers. Together, the two giants secure direct-retailer contracts and integrate breeding, farming, packing, and marketing to protect margins.
The September 2024 merger of Agroberries and BerryWorld, backed by Continental Grain, created the second-largest global berry supplier with 150,000 metric tons throughput and 3,000 hectares under management. Surexport assembled 1,600 hectares across Spain, Portugal, and Morocco through three 2023 deals and built an automated Huelva facility to chase private-label growth. BayWa and Nufri formed a joint venture to commercialize VentureFruit genetics on 120 hectares that aim for December harvests before Peruvian volumes arrive. MerrryBerry in Romania expanded capacity and sorting capability to supply Central European supermarkets.
Companies expand their geographic footprints to hedge weather risk and secure year-round supply, while investments in renewable energy and water audits support retailer sustainability scorecards. Breeding programs focus on machine-harvest traits and flavor stability, leveraging genotyping advances from the United States Department of Agriculture Research Service that cut development cycles to seven years. Capital inflows from pension funds such as PSP Investments, now holding 62.04% of Hortifrut, signal confidence in scale players that tie genetics to distribution.
Market Opportunities and Future Outlook
A visible opportunity is in performance-oriented upgrades that reduce shrink and help stabilize retailer specs, particularly optical grading, improved post-harvest handling, and heat-mitigation tools for protected production. In July 2026, UK grower WB Chambers highlighted deployment of AI-powered optical grading to assess berry color, size, shape, and quality, alongside drone application of whitewash on polytunnels to reduce heat stress, pointing to a commercialization pathway for tech-led premiumization where retailers reward consistency.
Policy-linked sustainability and compliance services are a second near-term area, given tightening expectations around water use, biodiversity, and farm assurance as CAP implementation progresses. Regulation (EU) 2024/1468 amended CAP rules to provide Member States more flexibility in applying GAEC standards, which reinforces the value of farm management, data capture, and verification to support eligibility while meeting environmental requirements. In parallel, certification and chain-of-custody capabilities, such as GLOBALG.A.P. plus social and water-related add-ons commonly requested by European buyers, create room for exporters, packers, and cooperatives to provide auditable traceability and residue-risk management across fragmented grower bases.
Recent Industry Developments
- July 2026: Frukty Polissia announced a USD 24.2 million plan to develop a 90-hectare blueberry plantation and a processing complex in Volyn, Ukraine, targeting EU and UK export channels. The project adds scale and more structured supply from Eastern Europe, increasing competitive pressure during the regional peak season while expanding processed and value-added capabilities.
- June 2025: A EUR 20 million blueberry project was launched in Carinena, Spain, adding new investment momentum outside the traditional Huelva focus. The move supports supply diversification within Spain and strengthens the role of modern, investment-backed orchards and packing infrastructure in serving retail programs.
- September 2024: Agroberries and BerryWorld merged, backed by Continental Grain, creating a larger global berry supplier with 150,000 metric tons of throughput and 3,000 hectares under management. The consolidation increases negotiating leverage with European retailers and accelerates integration across sourcing, packing, and year-round commercial programs.
Research Methodology Framework and Report Scope
Market Definition and Coverage
For this study, the market includes the value of blueberries consumed in Europe, based on a balance of local production and imported supply that reaches retail and foodservice channels.
Scope exclusions: The model does not count derived blueberry ingredients and processed products such as concentrates, powders, or supplements.
Segmentation Overview
- By Geography
- Spain
- Production Analysis (Area Harvested, Yield, and Production Volume)
- Consumption Analysis (Consumption Value and Volume)
- Import Market Analysis (Import Value, Volume, and Key Supplying Markets)
- Export Market Analysis (Export Value, Volume, and Key Destination Markets)
- Wholesale Price Trend Analysis and Forecast
- Regulatory Framework
- List of Key Players
- Logistics and Infrastructure
- Seasonality Analysis
- Poland
- Production Analysis (Area Harvested, Yield, and Production Volume)
- Consumption Analysis (Consumption Value and Volume)
- Import Market Analysis (Import Value, Volume, and Key Supplying Markets)
- Export Market Analysis (Export Value, Volume, and Key Destination Markets)
- Wholesale Price Trend Analysis and Forecast
- Regulatory Framework
- List of Key Players
- Logistics and Infrastructure
- Seasonality Analysis
- Germany
- Production Analysis (Area Harvested, Yield, and Production Volume)
- Consumption Analysis (Consumption Value and Volume)
- Import Market Analysis (Import Value, Volume, and Key Supplying Markets)
- Export Market Analysis (Export Value, Volume, and Key Destination Markets)
- Wholesale Price Trend Analysis and Forecast
- Regulatory Framework
- List of Key Players
- Logistics and Infrastructure
- Seasonality Analysis
- Netherlands
- Production Analysis (Area Harvested, Yield, and Production Volume)
- Consumption Analysis (Consumption Value and Volume)
- Import Market Analysis (Import Value, Volume, and Key Supplying Markets)
- Export Market Analysis (Export Value, Volume, and Key Destination Markets)
- Wholesale Price Trend Analysis and Forecast
- Regulatory Framework
- List of Key Players
- Logistics and Infrastructure
- Seasonality Analysis
- United Kingdom
- Production Analysis (Area Harvested, Yield, and Production Volume)
- Consumption Analysis (Consumption Value and Volume)
- Import Market Analysis (Import Value, Volume, and Key Supplying Markets)
- Export Market Analysis (Export Value, Volume, and Key Destination Markets)
- Wholesale Price Trend Analysis and Forecast
- Regulatory Framework
- List of Key Players
- Logistics and Infrastructure
- Seasonality Analysis
- France
- Production Analysis (Area Harvested, Yield, and Production Volume)
- Consumption Analysis (Consumption Value and Volume)
- Import Market Analysis (Import Value, Volume, and Key Supplying Markets)
- Export Market Analysis (Export Value, Volume, and Key Destination Markets)
- Wholesale Price Trend Analysis and Forecast
- Regulatory Framework
- List of Key Players
- Logistics and Infrastructure
- Seasonality Analysis
- Italy
- Production Analysis (Area Harvested, Yield, and Production Volume)
- Consumption Analysis (Consumption Value and Volume)
- Import Market Analysis (Import Value, Volume, and Key Supplying Markets)
- Export Market Analysis (Export Value, Volume, and Key Destination Markets)
- Wholesale Price Trend Analysis and Forecast
- Regulatory Framework
- List of Key Players
- Logistics and Infrastructure
- Seasonality Analysis
- Spain
Data Sources, Market Sizing, and Validation
Desk Research
Desk research was used to set the factual boundaries for Europe supply, trade, and consumption before the model was built. We used open, official datasets and sector references to understand how much fruit is grown, how it moves across borders, and how prices develop across the year.
Key inputs were drawn from sources such as Eurostat crop and trade statistics, national agriculture ministries, customs trade releases, and the FAO data series, then checked against peer-reviewed horticulture papers and public plant variety registries. To convert these signals into a usable sizing model, we also reviewed company annual reports, investor presentations, and reputable produce press to confirm season timing and pricing context. Where needed, paid subscriptions for company financials and intelligence were used to verify reported revenue mix and expansion announcements. This desk list is illustrative, and many other public sources were consulted to collect data, validate assumptions, and clarify gaps.
Primary Interviews and Surveys
Primary work focused on validating the demand and supply picture that desk research cannot fully explain, especially price formation and seasonal availability. We spoke with a mix of growers, packers, importers, distributors, and retail category stakeholders across major European blueberry markets, then aligned their inputs to the model assumptions before finalizing totals.
Distribution of primary research fieldwork respondents
| Company type | Respondent position |
|---|---|
| Top tier: 36% | CXOs: 17% |
| Mid tier: 45% | Functional/Unit leaders: 33% |
| Smaller Players: 19% | Managers: 50% |
Market-Sizing & Forecasting
Sizing was built using a top-down approach where production and trade data reconstruct the blueberries available for consumption in Europe, and then pricing layers convert volumes into market value. Country-level balances were prepared by checking harvested area and yield indicators, import and export flows, and typical season windows, then reconciled to avoid double counting within Europe.
To keep the totals realistic, selective bottom-up approximations were used as a cross-check, including sampled price per kilogram by season, distributor throughput checks, and a roll-up of visible supplier revenues where disclosure allowed. When gaps appeared for smaller countries, proxy indicators like per capita fruit consumption trends and retail promotion intensity were used, and the impact was kept small through conservative bounds.
Forecasts were produced using scenario analysis because yields, weather shocks, and import availability can shift quickly in fresh fruit. Key variables carried forward included planted area changes, yield trend direction, import season mix, wholesale and retail price movement, and the share of supply coming from protected cultivation. Assumptions were reviewed with primary respondents so the forward view stayed tied to what is feasible on farms and in supply chains.
Data Validation & Update Cycle
Outputs were checked in several steps so the final numbers align with observable market signals. We compared implied per capita consumption and trade balances against independent statistics, then reviewed price and volume movements for outliers that did not fit seasonality or known supply patterns.
If a variance was large, the assumptions behind yields, trade timing, or average price were revisited, and respondents were re-contacted when required. Before sign-off, another analyst reviews the logic and calculations to catch inconsistencies, and a final pass is done close to delivery so clients receive the latest updated view. Reports are refreshed annually, with interim updates when material events occur.
Mordor Intelligence's Europe Blueberry Market Size Compared Against Other Published Estimates
Published numbers for Europe blueberries can differ even when they use the same region name, because the counted basket, the treatment of trade, and the pricing basis are not always consistent. Differences also come from whether the estimate is anchored in observed supply flows or inferred from consumer spending proxies.
By tracking seasonal import and export balances and refreshing average price assumptions by country, Mordor Intelligence keeps the estimate tied to blueberries that actually enter European consumption channels, rather than blending in processed blueberry products or broader berry categories.
Benchmark comparison
| Source | Market Size | Gaps in Research Methodology |
|---|---|---|
| Mordor Intelligence | USD 4.90 B (2025) | |
| Regional Consultancy A | USD 8.90 B (2024) | This estimate appears to bundle fresh blueberries with value added blueberry products, which lifts the total when processed formats are priced at higher per unit values. |
| Trade Journal B | USD 2.70 B (2023) | This value looks closer to import trade value tracking, which can understate the market when local European production and domestic channel markups are not fully added. |
The spread in the table is largely explained by what is included in the product basket and whether trade value is treated as the final market value. When the scope is kept strictly to blueberries sold into Europe and the value build uses transparent volume and price steps, the result is easier to replicate and update year after year.
Key Questions Answered in the Report
What is the projected value of the Europe blueberry market in 2031?
The Europe blueberry market is forecast to reach USD 5.3 billion by 2031.
Which country consumes the most blueberries in Europe?
Germany leads consumption, accounting for 24.8% of regional volume in 2025.
Why are tunnel systems important for European blueberry growers?
Tunnels extend harvest from May to November, protect against weather, and help secure premium winter pricing.
How severe are labor shortages for European blueberry farms?
In 2024, farms across Europe lacked thousands of seasonal workers, leaving up to 12% of fruit unharvested in the United Kingdom.
Which segment of demand is growing fastest?
Industrial users in yogurt, cereal, and smoothie applications are increasing purchases at a 9.5% annual rate.
What is the key restraint on Spanish production growth?
Stricter water-use rules on the Doñana aquifer have cut irrigation allowances by 15% and could remove 800 hectares by 2028.