Market Overview
| Study Period | 2017 - 2030 |
|---|---|
| Base Year For Estimation | 2024 |
| Forecast Data Period | 2025 - 2030 |
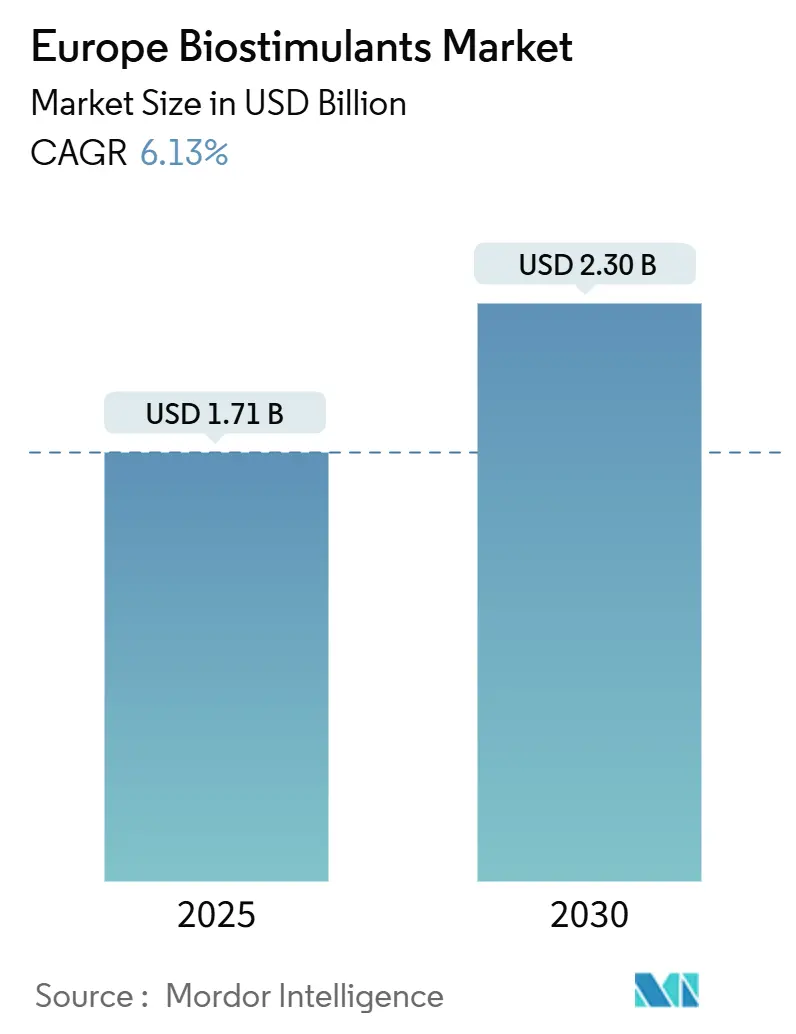
| Market Size (2025) | USD 1.71 Billion |
| Market Size (2030) | USD 2.30 Billion |
| Growth Rate (2025 - 2030) | 6.13% CAGR |
| Market Concentration | Low |
Major Players
*Disclaimer: Major Players sorted in no particular order Image © Mordor Intelligence. Reuse requires attribution under CC BY 4.0. |
|
Europe Biostimulants Market Analysis by Mordor Intelligence
Europe biostimulants market size reached USD 1.71 billion in 2025 and is forecast to advance to USD 2.3 billion by 2030, registering a 6.13% CAGR across the period. The outlook reflects accelerating policy pressure to curb synthetic fertilizer use, a growing organic acreage base, and widening access to Conformité Européenne (CE) marked products that streamline cross-border sales. Technology improvements have trimmed seaweed extraction and microbial fermentation costs by up to 20%, bringing biological inputs closer to parity with conventional fertilizers and reinforcing the overall growth trajectory. Precision agriculture adoption continues to validate field-level returns, especially in variable-rate application systems that match biostimulant dosing to crop needs. Competitive intensity remains low, with top five players hold 5.5% share.
Key Report Takeaways
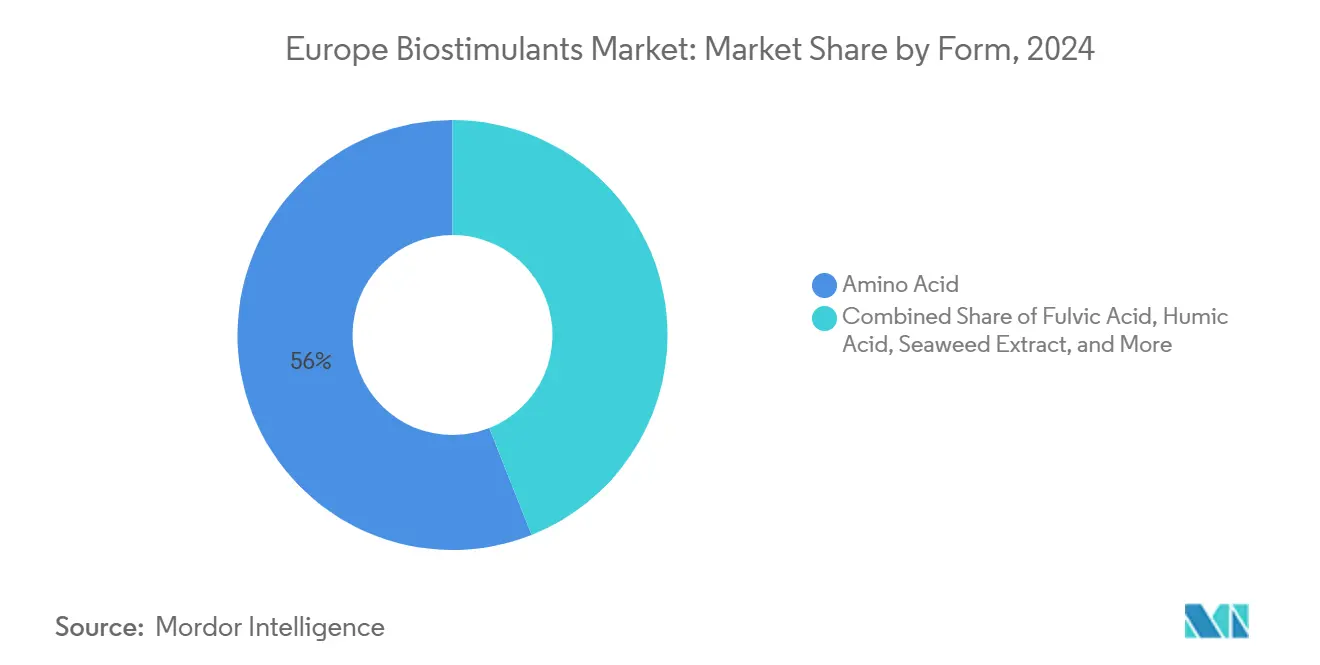
- By form, amino acids commanded 56% of Europe's biostimulants market share in 2024, while humic acid products are projected to post a 7.1% CAGR through 2030.
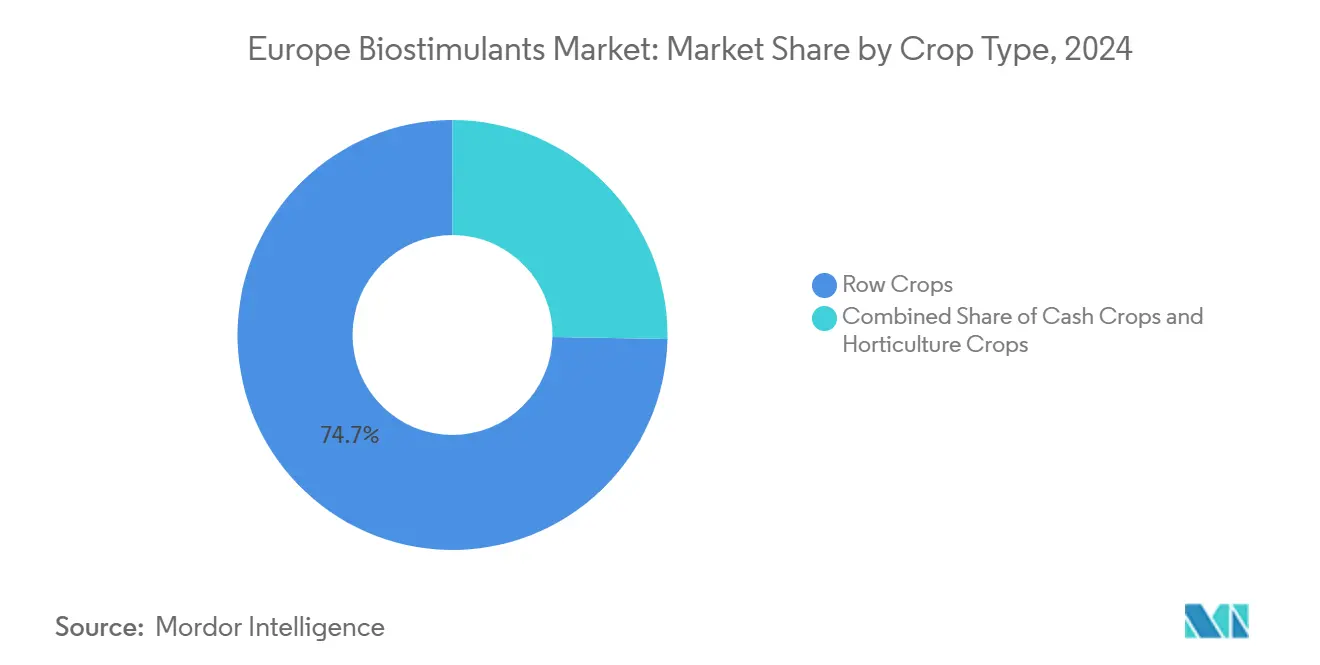
- By crop type, row crops accounted for a 74.7% share of the European biostimulants market size in 2024; cash crops are expected to expand at a 7.2% CAGR over 2025-2030.
- By country, France led with 17.9% revenue share in 2024, while Spain is projected to record a 7.1% CAGR during the forecast window.
Europe Biostimulants Market Trends and Insights
Drivers Impact Analysis
| Driver | (~) % Impact on CAGR Forecast | Geographic Relevance | Impact Timeline |
|---|---|---|---|
| EU Green Deal and Farm-to-Fork Fertilizer-Reduction Mandates | +1.8% | France, Germany, Netherlands | Medium term (2–4 years) |
| Expansion of Certified Organic Farmland | +1.2% | Italy, Spain, Austria | Long term (≥4 years) |
| Harmonized CE-Mark Framework Streamlining Market Access | +0.9% | EU-27, spill-over to the UK and Turkey | Short term (≤2 years) |
| Rapid Cost Declines in Seaweed Extraction and Microbial Fermentation | +1.1% | Atlantic coastal regions | Medium term (2–4 years) |
| Precision-ag variable-rate tech proving field-level ROI | +0.7% | Western Europe and North America | Long term (≥4 years) |
| Surge in EU protein-crop R&D funding driving yield-boost demand | +0.5% | Netherlands, Denmark, Germany | Medium term (2–4 years) |
| Source: Mordor Intelligence | |||
EU Green Deal and Farm-to-Fork Fertilizer-Reduction Mandates
The European Union made its 20% synthetic-fertilizer-cut target legally binding, so every member state must show measurable progress within its national strategic plan[1]Source: European Commission, “Farm to Fork Strategy,” EUROPA.EU. Field pilots in Brittany and Bavaria already record 12-15% substitution when biostimulants are paired with variable-rate spreaders. Cooperative advisers now bundle compliance audits with biological-input recommendations, turning regulation into a commercial pull rather than a push. Equipment vendors and input suppliers co-sponsor on-farm demonstrations that prove yield stability under lower nutrient rates, further easing adoption resistance. As penalty fees escalate from 2026 onward, growers are increasingly locking in multi-year supply contracts for Conformité Européenne (CE)-marked formulations that help them meet mandated nutrient benchmarks.
Expansion of Certified Organic Farmland
Certified organic acreage expanded by 3.6% per year between 2020 and 2023, reaching 17.7 million hectares, equivalent to 10.1% of total farmland[2]Source: Eurostat, “Organic Farming Statistics,” EUROSTAT.EC.EUROPA.EU. Organic rules prohibit most synthetic fertilizers, so certified biostimulants fill the nutrient-management gap while supporting plant resilience. Premium farm-gate prices, often 20 to 40% higher than those for conventional crops, offset higher input costs and shorten the payback periods for biological products. Retailers now demand third-party verification of input provenance, which favors manufacturers with transparent supply chains and digital traceability. The trend extends beyond early adopters, such as Austria, to mid-sized producers in Italy and Spain, thereby widening the addressable base for Conformité Européenne (CE)-certified labels.
Harmonized Conformité Européenne (CE)-Mark Framework Streamlining Market Access
Regulation (EU) 2019/1009 defines biostimulants and allows a single Conformité Européenne (CE) mark to authorize sales across all member states, replacing twenty-seven separate approval tracks[3]Source: European Food Safety Authority, “Scientific Opinion on Biostimulant Efficacy Testing,” EFSA.EUROPA.EU. By December 2024, 89% of commercially viable products carried the Conformité Européenne (CE) logo, which reduced the average time-to-market from thirty-six to ten months for small and mid-sized firms. Distributors immediately expanded their product catalogs, allowing farmers to gain brand variety without additional paperwork. National trade shows showcase new launches side by side, accelerating learning curves and peer-to-peer validation. The unified rulebook lowers compliance costs, redirecting capital toward research and promotional field trials rather than legal fees.
Rapid Cost Declines in Seaweed Extraction and Microbial Fermentation
Enzymatic extraction now delivers 40% higher yield at 25% lower energy use than alkaline methods, reducing production costs by 15-20% since 2023. Shortened microbial-fermentation cycles have freed bioprocessing capacity, allowing producers to double output without major plant expansions. The cost savings narrow the price gap with commodity fertilizers, especially in high-value horticulture, where growers track dollars per kilogram of harvested product. Firms pass a portion of the savings to distributors through tiered rebates, which in turn improves dealer margins and stocking incentives. Lower manufacturing costs also open the door for trial packages and subscription models that mitigate buyer risk.
Restraints Impact Analysis
| Restraint | (~) % Impact on CAGR Forecast | Geographic Relevance | Impact Timeline |
|---|---|---|---|
| Absence of EU-Wide Performance Standards and Protocols | −0.8% | EU-27 | Long term (≥ 4 years) |
| Higher Price Premium Versus Conventional Fertilizers | −1.2% | Eastern Europe | Medium term (2–4 years) |
| Seaweed biomass supply volatility in Atlantic & Baltic aquaculture | −0.6% | Atlantic and Baltic coasts | Short term (≤ 2 years) |
| Digital labeling / traceability compliance costs post-2024 | −0.4% | EU core | Short term (≤ 2 years) |
| Source: Mordor Intelligence | |||
Absence of EU-Wide Performance Standards and Protocols
Although Conformité Européenne (CE) marking simplifies market access, there is still no pan-European benchmark for field-level efficacy, leaving farmers to rely on disparate national trial data. Advisory cooperatives struggle to issue definitive product rankings, so risk-averse growers delay adoption until local case studies accumulate. Low-performing labels can legally coexist with science-backed brands, muddying market signals and eroding trust. Industry associations are pushing for a unified protocol, but consensus remains slow due to the wide variation in climatic zones and crop mixes across Europe. Until harmonization arrives, buyers will lean on peer referral and brand reputation, which lengthens sales cycles.
Higher Price Premium Versus Conventional Fertilizers
Biostimulants still cost two to three times more than nutrient-equivalent conventional fertilizers on a per-hectare basis, especially in broad-acre cereals where applications cover thousands of hectares. Eastern European growers often operate on thin margins and cannot justify the spend unless contracts guarantee higher commodity prices. Currency fluctuations add another layer of uncertainty, as many biological inputs are imported and priced in USD. Dealers attempt to soften the blow with in-season credit, but repayment depends on harvest quality and market prices at delivery. Without consistent economic incentives, adoption curves flatten in price-sensitive regions.
Segment Analysis
By Form: Soil-Health Gains Propel Humic Acid Upswing
Amino acids secured 56% of Europe biostimulants market share in 2024, reflecting their versatility across cereals, oilseeds, and greenhouse crops. Humic acid formulations, prized for their carbon-rich soil-conditioning benefits, are predicted to expand at the fastest 7.15% CAGR between 2025 and 2030, outpacing all other categories as regenerative agriculture practices spread. The widening performance gap underscores a shift from purely plant-focused inputs toward solutions that also rebuild soil structure and microbial activity, aligning with subsidy schemes that reward long-term sustainability.
Seaweed extracts continue to anchor certified-organic programs, while fulvic acids gain traction in micronutrient delivery for high-value fruits and vegetables. Protein hydrolysates appeal to specialty growers seeking fast amino-nitrogen uptake under stress, whereas the diverse “other biostimulants” pool including microbial blends and peptide complexes serves niche needs in protected cultivation. Collectively, these offerings broaden the functional palette, allowing distributors to craft crop-specific packages that improve nutrient efficiency, enhance stress resilience, and meet regionally distinct regulatory requirements.
Note: Segment shares of all individual segments available upon report purchase
Get Detailed Market Forecasts at the Most Granular Levels
Download PDF
By Crop Type: Row Crops Dominate, Cash Crops Gain Pace
Row crops commanded 74.7% of Europe biostimulants market share in 2024, driven by vast cereal and oilseed acreage and government incentives favoring domestic protein-crop output. Cash crops led by industrial hemp and emerging bioenergy plants are set to post the fastest 7.25% CAGR through 2030 as growers chase premium contracts tied to low-input, high-value supply chains. This acceleration spotlights a market pivot toward diversified rotations that monetize sustainability certifications and carbon sequestration credits.
Horticultural operations, especially greenhouse vegetables and berries, lean heavily on liquid formulations compatible with fertigation, prioritizing quality and shelf-life gains over sheer tonnage. Row-crop expansion centers on amino acid and fulvic acid blends that integrate seamlessly with variable-rate sprayers, while cash-crop adopters experiment with humic acid and seaweed complexes to amplify soil health and resilience. Across every crop type, agronomists emphasize pairing biologicals with digital decision-support tools to validate field-level returns and secure ongoing input budget allocations.
Note: Segment shares of all individual segments available upon report purchase
Get Detailed Market Forecasts at the Most Granular Levels
Download PDF
Geography Analysis
France captured 17.9% of Europe's biostimulants market share in 2024, reflecting the widespread use of amino acid and seaweed inputs in intensive cereal and wine-growing regions. Spain, already a leader in protected horticulture, is forecast to expand usage at a 7.13% CAGR between 2025 and 2030 as drip-irrigation networks pair liquid biologicals with fertigation systems. Both countries benefit from national sustainability programs that subsidize biological alternatives to synthetic fertilizers and reward growers for carbon-smart practices. The presence of technical advisers and digital decision-support tools accelerates on-farm validation, anchoring steady demand growth across large and small holdings.
Germany, Italy, and Turkey form the next tier of adoption, each building momentum through targeted incentives and crop-specific research. German vegetable producers rely on humic-acid blends to improve the quality of heavy soils, while Italian vineyards utilize seaweed extracts to enhance grape quality under heat stress. Turkish greenhouse exporters integrate Conformité Européenne (CE)-marked formulations to satisfy European retail standards, creating a reliable pull for domestic distributors. These moderately growing countries have robust extension networks and are increasingly mandating traceability, conditions that favor suppliers with transparent supply chains and agronomic service capabilities.
Looking ahead, the Netherlands and Russia are positioned to drive incremental volume as technology and policy converge. The Dutch high-tech greenhouse cluster validates biostimulant performance through real-time sensor data, shortening product trial cycles and encouraging rapid scale-up. Russian growers seek inputs that buffer crops against climate volatility, prompting interest in humic-acid and microbial formulations that enhance soil resilience. Smaller Eastern European markets leverage rural-development funds to offset adoption costs, while the United Kingdom maintains regulatory alignment that keeps Conformité Européenne (CE)-marked products flowing post-Brexit. Together, these factors suggest that geographically diverse demand will sustain the upward trajectory of the Europe biostimulants market beyond 2030.
Competitive Landscape
Europe's biostimulants market remains highly fragmented, with the top five players holding only a 5.56% share, resulting in numerous specialized competitors. Leading firms, such as Valagro, Biolchim SpA, and BioAtlantis, differentiate themselves through proprietary extraction technologies and crop-specific formulations. Low competitive intensity stems from technical service requirements and regulatory hurdles that deter price wars.
Research investment averages 8 to 12% of revenue among top firms, fueling innovations in microencapsulation, controlled release, and digital decision-support tools. Patent filings increased by 23% in 2024, underscoring a surge in the race to secure intellectual property and maintain premium pricing. Partnerships between biostimulant suppliers and precision-agriculture platforms are emerging as a route to bundled value and deeper on-farm data.
Supply security is a strategic focus following seaweed shortages; deals, such as UPL’s joint venture with Ocean Forest, aim to lock in sustainable biomass at a predictable cost. Acquisitions, exemplified by Valagro’s purchase of Frayssinet, broaden organic-certified portfolios and geographic reach. The absence of dominant market leaders leaves room for start-ups leveraging synthetic biology to disrupt traditional extraction methods with lower-cost fermentation pathways.
Europe Biostimulants Industry Leaders
-
Agronutrition
-
BioAtlantis Ltd
-
Biolchim SPA
-
Trade Corporation International
-
Valagro
- *Disclaimer: Major Players sorted in no particular order
Need More Details on Market Players and Competitors?
Download PDF
Recent Industry Developments
- June 2025: The European Biostimulants Industry Council convened its annual EBIC Summit in Brussels, centered on the theme “Making competitive and sustainable EU agriculture a reality.” The EU Green Week-partnered forum assembled senior agrifood leaders for sessions on circular animal by-products, beneficial microorganisms, and farmer innovation pathways
- June 2025: Syngenta outlined a biologicals leadership roadmap that incorporates the 2024 Intrinsyx Bio acquisition, the integration of Novartis' natural products collection, and a new 22,000 m² plant in Orangeburg, South Carolina, which will produce 16,000 tons of biostimulants annually.
- October 2024: Syngenta AG launched the BioCrop platform in collaboration with Microsoft, combining biostimulant recommendations with precision agriculture data analytics across 12 European countries.
Europe Biostimulants Market Report Scope
Amino Acids, Fulvic Acid, Humic Acid, Protein Hydrolysates, Seaweed Extracts are covered as segments by Form. Cash Crops, Horticultural Crops, Row Crops are covered as segments by Crop Type. France, Germany, Italy, Netherlands, Russia, Spain, Turkey, United Kingdom are covered as segments by Country.
Form
| Amino Acids |
| Fulvic Acid |
| Humic Acid |
| Protein Hydrolysates |
| Seaweed Extracts |
| Other Biostimulants |
Crop Type
| Cash Crops |
| Horticultural Crops |
| Row Crops |
Country
| France |
| Germany |
| Italy |
| Netherlands |
| Russia |
| Spain |
| Turkey |
| United Kingdom |
| Rest of Europe |
| Form | Amino Acids |
| Fulvic Acid | |
| Humic Acid | |
| Protein Hydrolysates | |
| Seaweed Extracts | |
| Other Biostimulants | |
| Crop Type | Cash Crops |
| Horticultural Crops | |
| Row Crops | |
| Country | France |
| Germany | |
| Italy | |
| Netherlands | |
| Russia | |
| Spain | |
| Turkey | |
| United Kingdom | |
| Rest of Europe |
Need A Different Region or Segment?
Customize Now
Market Definition
- AVERAGE DOSAGE RATE - The average application rate is the average volume of biostimulants applied per hectare of farmland in the respective region/country.
- CROP TYPE - Crop type includes Row crops (Cereals, Pulses, Oilseeds), Horticultural Crops (Fruits and vegetables) and Cash Crops (Plantation Crops, Fibre Crops and Other Industrial Crops)
- FUNCTION - The Crop Protection function of agirucultural biological include products that prevent or control various biotic and abiotic stress.
- TYPE - Biostimulants boost crop growth and yield by preventing or controlling various abiotic stresses.
| Keyword | Definition |
|---|---|
| Cash Crops | Cash crops are non-consumable crops sold as a whole or part of the crop to manufacture end-products to make a profit. |
| Integrated Pest Management (IPM) | IPM is an environment-friendly and sustainable approach to control pests in various crops. It involves a combination of methods, including biological controls, cultural practices, and selective use of pesticides. |
| Bacterial biocontrol agents | Bacteria used to control pests and diseases in crops. They work by producing toxins harmful to the target pests or competing with them for nutrients and space in the growing environment. Some examples of commonly used bacterial biocontrol agents include Bacillus thuringiensis (Bt), Pseudomonas fluorescens, and Streptomyces spp. |
| Plant Protection Product (PPP) | A plant protection product is a formulation applied to crops to protect from pests, such as weeds, diseases, or insects. They contain one or more active substances with other co-formulants such as solvents, carriers, inert material, wetting agents or adjuvants formulated to give optimum product efficacy. |
| Pathogen | A pathogen is an organism causing disease to its host, with the severity of the disease symptoms. |
| Parasitoids | Parasitoids are insects that lay their eggs on or within the host insect, with their larvae feeding on the host insect. In agriculture, parasitoids can be used as a form of biological pest control, as they help to control pest damage to crops and decrease the need for chemical pesticides. |
| Entomopathogenic Nematodes (EPN) | Entomopathogenic nematodes are parasitic roundworms that infect and kill pests by releasing bacteria from their gut. Entomopathogenic nematodes are a form of biocontrol agents used in agriculture. |
| Vesicular-arbuscular mycorrhiza (VAM) | VAM fungi are mycorrhizal species of fungus. They live in the roots of different higher-order plants. They develop a symbiotic relationship with the plants in the roots of these plants. |
| Fungal biocontrol agents | Fungal biocontrol agents are the beneficial fungi that control plant pests and diseases. They are an alternative to chemical pesticides. They infect and kill the pests or compete with pathogenic fungi for nutrients and space. |
| Biofertilizers | Biofertilizers contain beneficial microorganisms that enhance soil fertility and promote plant growth. |
| Biopesticides | Biopesticides are natural/bio-based compounds used to manage agricultural pests using specific biological effects. |
| Predators | Predators in agriculture are the organisms that feed on pests and help control pest damage to the crops. Some common predator species used in agriculture include ladybugs, lacewings, and predatory mites. |
| Biocontrol agents | Biocontrol agents are living organisms used to control pests and diseases in agriculture. They are alternatives to chemical pesticides and are known for their lesser impact on the environment and human health. |
| Organic Fertilizers | Organic fertilizer is composed of animal or vegetable matter used alone or in combination with one or more non-synthetically derived elements or compounds used for soil fertility and plant growth. |
| Protein hydrolysates (PHs) | Protein hydrolysate-based biostimulants contain free amino acids, oligopeptides, and polypeptides produced by enzymatic or chemical hydrolysis of proteins, primarily from vegetal or animal sources. |
| Biostimulants/Plant Growth Regulators (PGR) | Biostimulants/Plant Growth Regulators (PGR) are substances derived from natural resources to enhance plant growth and health by stimulating plant processes (metabolism). |
| Soil Amendments | Soil Amendments are substances applied to soil that improve soil health, such as soil fertility and soil structure. |
| Seaweed Extract | Seaweed extracts are rich in micro and macronutrients, proteins, polysaccharides, polyphenols, phytohormones, and osmolytes. These substances boost seed germination and crop establishment, total plant growth and productivity. |
| Compounds related to biocontrol and/or promoting growth (CRBPG) | Compounds related to biocontrol or promoting growth (CRBPG) are the ability of a bacteria to produce compounds for phytopathogen biocontrol and plant growth promotion. |
| Symbiotic Nitrogen-Fixing Bacteria | Symbiotic nitrogen-fixing bacteria such as Rhizobium obtain food and shelter from the host, and in return, they help by providing fixed nitrogen to the plants. |
| Nitrogen Fixation | Nitrogen fixation is a chemical process in soil which converts molecular nitrogen into ammonia or related nitrogenous compounds. |
| ARS (Agricultural Research Service) | ARS is the U.S. Department of Agriculture's chief scientific in-house research agency. It aims to find solutions to agricultural problems faced by the farmers in the country. |
| Phytosanitary Regulations | Phytosanitary regulations imposed by the respective government bodies check or prohibit the importation and marketing of certain insects, plant species, or products of these plants to prevent the introduction or spread of new plant pests or pathogens. |
| Ectomycorrhizae (ECM) | Ectomycorrhiza (ECM) is a symbiotic interaction of fungi with the feeder roots of higher plants in which both the plant and the fungi benefit through the association for survival. |
Need More Details on Market Definition?
Ask a Question
Research Methodology
Mordor Intelligence follows a four-step methodology in all our reports.
- Step-1: Identify Key Variables: In order to build a robust forecasting methodology, the variables and factors identified in Step-1 are tested against available historical market numbers. Through an iterative process, the variables required for market forecast are set and the model is built on the basis of these variables.
- Step-2: Build a Market Model: Market-size estimations for the forecast years are in nominal terms. Inflation is not a part of the pricing, and the average selling price (ASP) is kept constant throughout the forecast period.
- Step-3: Validate and Finalize: In this important step, all market numbers, variables and analyst calls are validated through an extensive network of primary research experts from the market studied. The respondents are selected across levels and functions to generate a holistic picture of the market studied.
- Step-4: Research Outputs: Syndicated Reports, Custom Consulting Assignments, Databases & Subscription Platforms.

Get More Details On Research Methodology
Download PDF


