
Market Overview
| Study Period | 2021 - 2031 |
|---|---|
| Forecast Data Period | 2026 - 2031 |
| Base Year Market Size (2025) | 47.5 gigawatt |
| Market Volume (2026) | 49.69 gigawatt |
| Market Volume (2031) | 62.28 gigawatt |
| Growth Rate (2026 - 2031) | 4.62% CAGR |
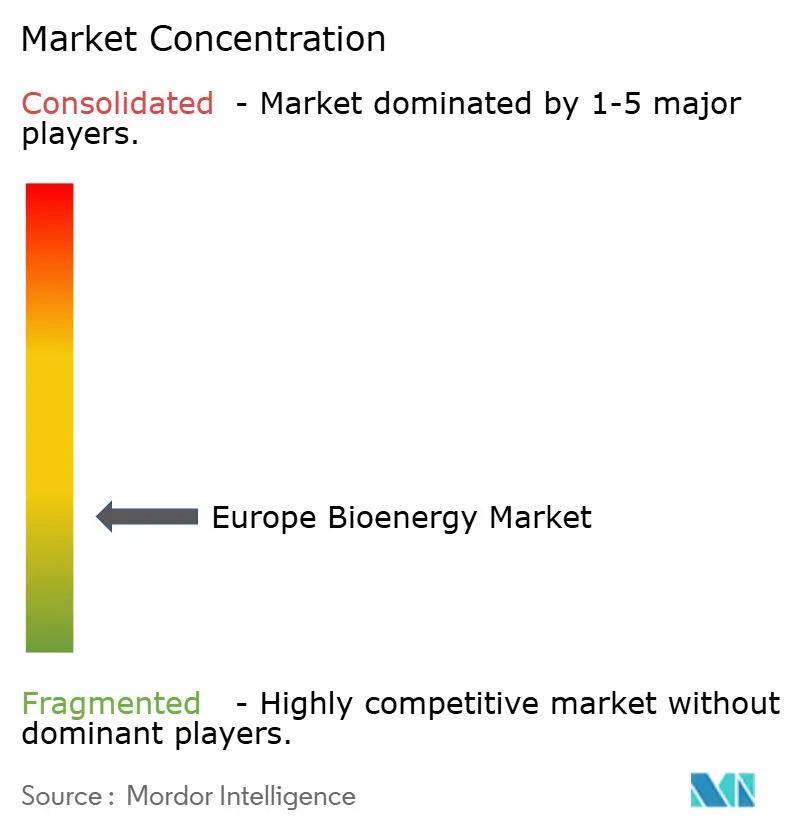
| Market Concentration | Low |
Major Players *Disclaimer: Major Players sorted in no particular order Image © Mordor Intelligence. Reuse requires attribution under CC BY 4.0. | |
Europe Bioenergy Market Analysis by Mordor Intelligence
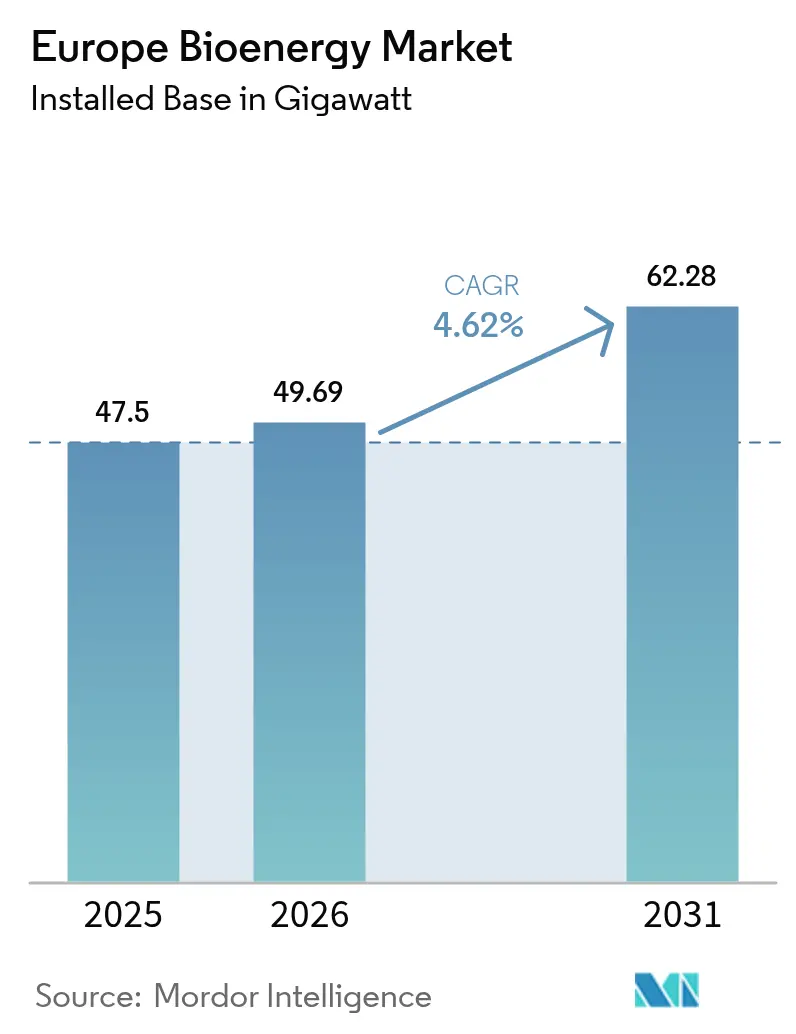
The Europe Bioenergy Market size was valued at 47.5 gigawatt in 2025 and estimated to grow from 49.69 gigawatt in 2026 to reach 62.28 gigawatt by 2031, at a CAGR of 4.62% during the forecast period (2026-2031).
Policy continuity under Renewable Energy Directive III, steady coal-to-biomass repowering, and widening corporate demand for round-the-clock thermal energy keep headline growth intact even as capacity expansion slows from the break-neck pace of the previous decade. Operators concentrate investments on efficiency upgrades, EUDR-compliant feedstock logistics, and negative-emission retrofits rather than greenfield build-outs. Biogas emerges as the pivotal growth engine because anaerobic digestion turns farm and food waste into grid-compatible biomethane, unlocking fresh revenue from tipping fees and gas-network sales. Meanwhile, solid biomass retains its central role in district-heat and combined-heat-and-power (CHP) systems that provide reliable baseload energy where solar and wind intermittency remains a constraint.
Key Report Takeaways
- By type, solid biomass held 58.52 % of Europe bioenergy market share in 2025, while biogas is projected to post the fastest 6.44 % CAGR through 2031.
- By feedstock, forestry residues led with 41.12 % of the Europe bioenergy market size in 2025; agricultural residues represent the fastest-rising stream at a 6.02 % CAGR to 2031.
- By technology, combustion accounted for 54.15 % of the Europe bioenergy market size in 2025 whereas gasification, pyrolysis, and other technologies are gaining at an 7.66 % CAGR.
- By application, electricity generation captured 44.05 % of the Europe bioenergy market size in 2025; transportation fuel requirements are expanding most rapidly at a 6.63 % CAGR through 2031.
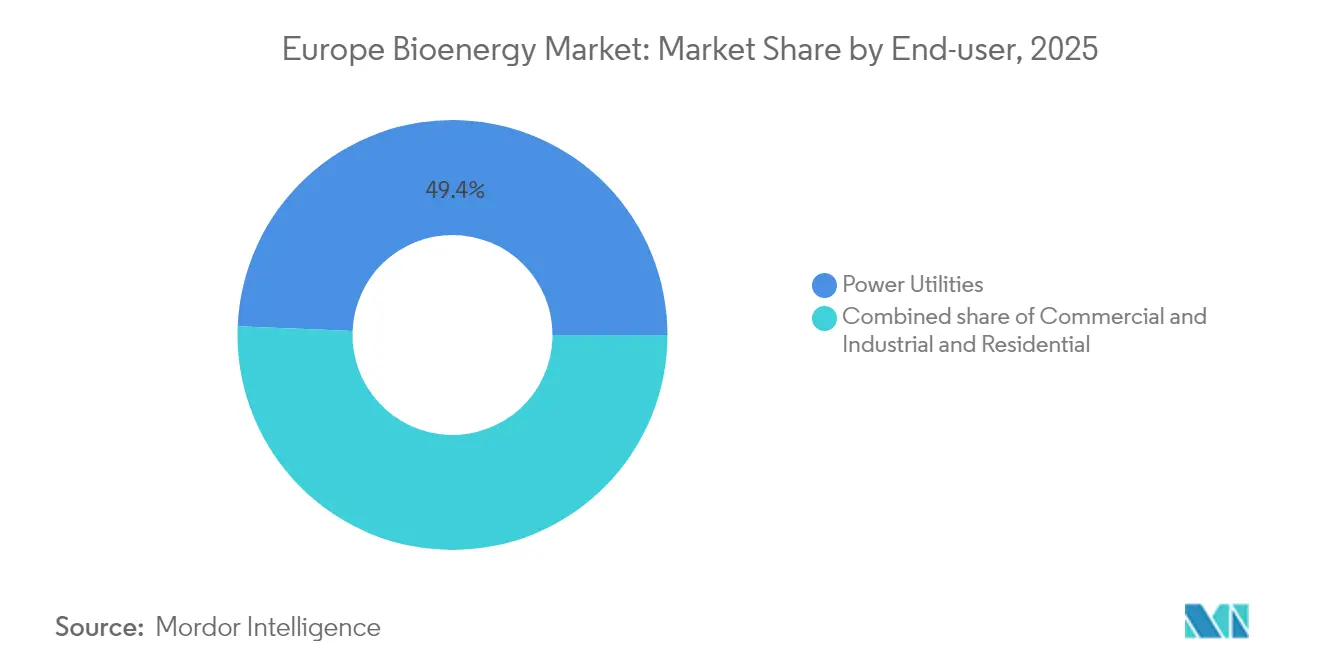
- By end-user, power utilities held a 49.35% share of the bioenergy market size in 2025, while commercial and industrial demand is projected to advance at a 6.17% CAGR between 2026-2031.
- By geography, Germany commanded 22.03 % of Europe bioenergy market share in 2025 and is maintaining leadership with reinforced feed-in tariffs, streamlined biomethane permits, and BECCS pilot funding.
Note: Market size and forecast figures in this report are generated using Mordor Intelligence’s proprietary estimation framework, updated with the latest available data and insights as of 2026.
Europe Bioenergy Market Trends and Insights
Drivers Impact Analysis*
| Driver | (~) % Impact on CAGR Forecast | Geographic Relevance | Impact Timeline |
|---|---|---|---|
| EU Renewable Energy Directive III 2030 targets | +1.2 % | Germany, France, Italy | Medium term (2-4 years) |
| National biomass-heat incentive schemes | +0.9 % | Germany, Finland, UK, Nordic countries | Short term (≤ 2 years) |
| EU-wide 35 bcm biomethane roadmap | +0.7 % | France, Germany, Italy, Netherlands | Medium term (2-4 years) |
| Corporate 24 / 7 renewable-heat sourcing pledges | +0.8 % | Industrial hubs in Germany, Finland, France | Long term (≥ 4 years) |
| Coal-to-biomass power-plant conversions | +0.6 % | UK, Turkey, Eastern Europe | Short term (≤ 2 years) |
| BECCS negative-emission revenue streams | +0.5 % | Finland, UK, Germany | Long term (≥ 4 years) |
| Source: Mordor Intelligence | |||
EU Renewable Energy Directive III 2030 targets
Directive III obliges member states to reach a 42.5 % renewable-energy share by 2030 and sets binding transport, heat, and industry sub-targets, underpinning multi-year offtake for sustainable biomass and biomethane in sectors where electrification lags.(1)Directorate-General for Energy, “Renewable Energy Directive (RED III),” European Commission, ec.europa.eu
National biomass-heat incentive schemes
Germany’s 2024 biomass package improved CHP feed-in tariffs and cut red tape for biogas upgrading, while Finland exempts district-heat biomass from carbon tax, sustaining fuel-switch economics that favor forestry residues.(2) Federal Ministry for Economic Affairs and Climate Action, “Biomass Strategy 2024,” bmwk.de
EU-wide 35 bcm biomethane roadmap
REPowerEU aims to almost triple biomethane output to 35 bcm by 2030, calling for EUR 37 billion in anaerobic digesters, gas-cleaning units, and injection points, a tail-wind for the rapidly scaling agricultural-waste segment.
Corporate 24/7 renewable-heat sourcing pledges
Industrial heavyweights contract local biomass developers for continuous steam supply, ensuring Scope 2 compliance and underwriting long-tenor heat-offtake agreements that de-risk project finance.
Restraints Impact Analysis*
| Restraint | (~) % Impact on CAGR Forecast | Geographic Relevance | Impact Timeline |
|---|---|---|---|
| Sustainable feedstock & ILUC caps | -1.1 % | Germany, Netherlands | Medium term (2-4 years) |
| Pellet-import logistics & cost volatility | -0.8 % | UK, Netherlands, Belgium | Short term (≤ 2 years) |
| EU Deforestation-Free Regulation burden | -0.6 % | Import-dependent supply chains | Short term (≤ 2 years) |
| EV uptake diluting liquid-biofuel demand | -0.4 % | Nordic road-transport markets | Long term (≥ 4 years) |
| Source: Mordor Intelligence | |||
Sustainable feedstock & ILUC caps
Crop-based fuels are capped at 7 % of transport energy, pushing buyers toward pricier residues and making certification paperwork more rigorous and costly.(3)European Parliament, “Indirect Land-Use Change (ILUC) Regulation,” europarl.europa.eu
EU Deforestation-Free Regulation burden
Eighty-five percent of Europe’s pellets come from North America and face freight bottlenecks; compliance with EUDR adds EUR 15-25 per tonne for documentation and third-party audits.(4)European Pellet Council, “Pellet Import Statistics 2024,” pelletcouncil.eu
*Our forecasts treat driver/restraint impacts as directional, not additive. The impact forecasts reflect baseline growth, mix effects, and variable interactions.
Segment Analysis
By Type: Solid Biomass Dominance Faces Biogas Challenge
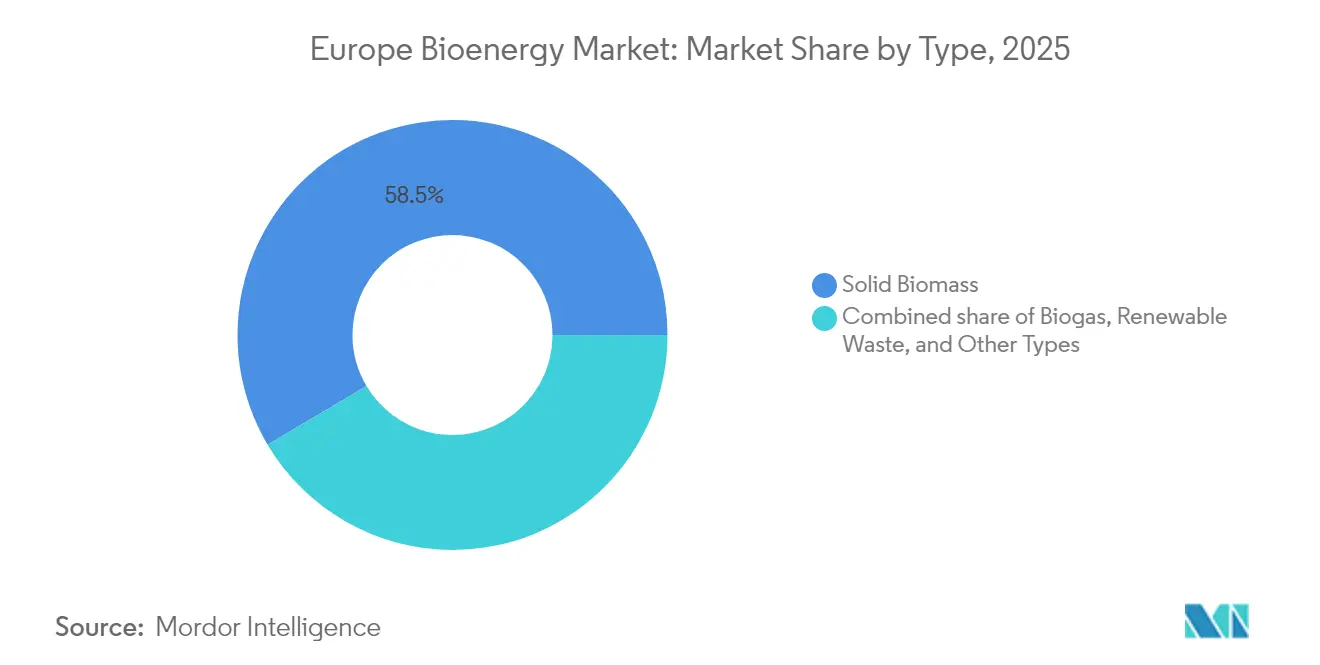
Solid biomass retains 58.52 % of Europe bioenergy market size in 2025 thanks to CHP ubiquity. Growth, however, moderates as EUDR increases paperwork and as some district-heat operators test heat-pump retrofits. Biogas races ahead at a 6.44 % CAGR through 2031 as anaerobic digestion converts manure, crop residues, and food waste into grid-grade gas injected via over 1,200 connection points. Renewable-waste streams also rise where tipping-fee income offsets feedstock costs, enhancing plant cash flow resilience.


By Feedstock: Agricultural Residues Gain on Forestry Leadership
Forestry residues maintain the lion’s share at 41.12 % but face traceability surcharges. Agricultural residues climb fastest at 6.02 % CAGR after mechanization slashes collection cost, while avoiding ILUC penalties. Energy crops remain niche due to land-use scrutiny, and municipal-solid-waste organics expand under EU landfill-diversion rules. Mechanization and logistics advances have trimmed agricultural-residue collection costs by up to 30%, opening price parity with imported pellets even before EUDR surcharge impacts.
Forest-residue dependence exposes operators to EUDR due-diligence fees estimated at EUR 15–25 per tonne, while sequential crops leverage local farms and existing grain-storage infrastructure for integrated supply. Organic and municipal waste streams also gain share under circular-economy legislation that obliges municipalities to divert biogenic waste from landfill, funneling feedstock into anaerobic digesters. Energy crops and algae remain in pilot phases but attract R&D subsidies for maritime and SAF feedstock diversification.
By Technology: Combustion Leadership Challenged by Innovation
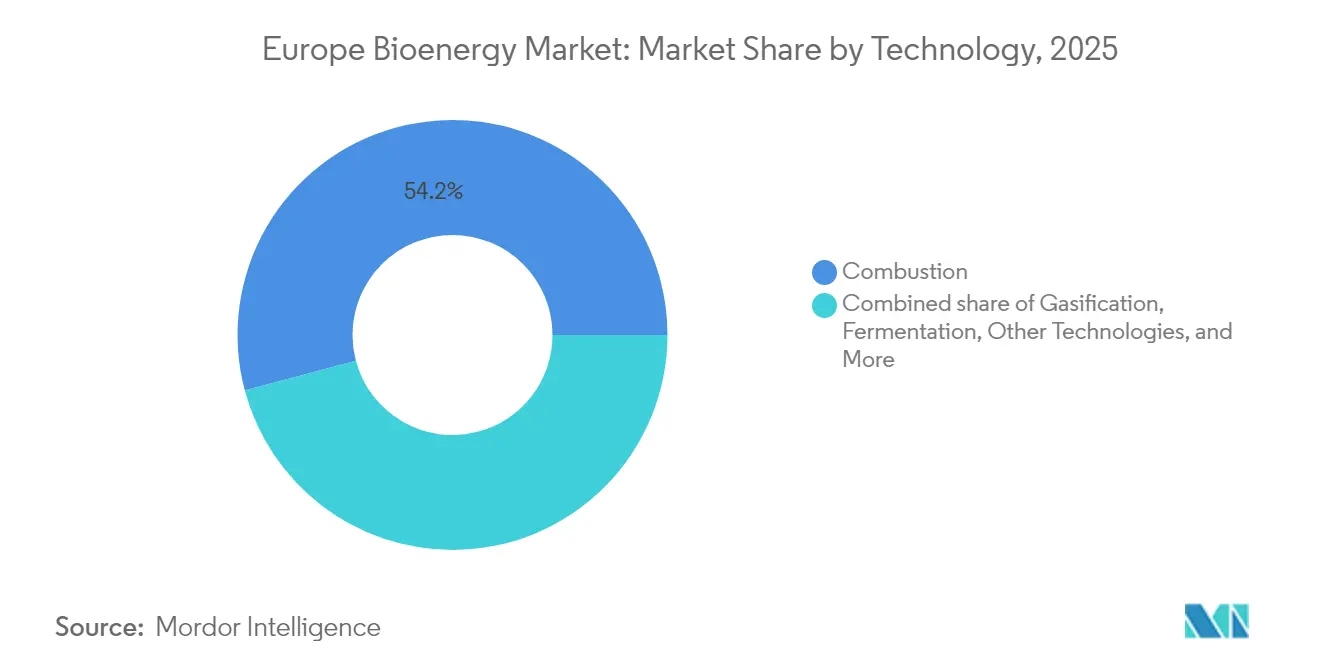
Combustion still underpins 54.15 % of delivered energy, valued for simplicity and existing boilers. Yet Other technologies (such as algal bioenergy, hydrothermal liquefaction, microbial processes) register an 7.66 % CAGR by unlocking higher thermal efficiency and producing syngas, bio-oil, or alcohols suited to aviation and maritime mandates. Anaerobic digestion benefits from dual revenue on gas and digestate fertilizers.
By Application: Transportation Fuel Accelerates Past Electricity
Electricity generation holds 44.05 % share but contends with cheaper wind and solar auctions. Transportation fuel demand increases at 6.63 % CAGR, propelled by the UK’s SAF blend floor rising from 2 % in 2025 to 22 % by 2040 and new EU maritime-fuel targets. Heat generation and CHP preserve stable demand where biomass supplies high-temperature steam beyond the reach of heat pumps.
Combined Heat and Power systems optimize energy efficiency through simultaneous electricity and heat production, achieving 85-90% fuel utilization rates compared to 35-45% for electricity-only generation, creating competitive advantages in industrial and commercial applications. The application mix demonstrates market evolution toward higher-value uses where bioenergy provides unique advantages over other renewable technologies, particularly in transport sectors facing electrification challenges and industrial processes requiring consistent high-temperature heat.
By End-User: Commercial Sector Drives Industrial Demand
Power utilities still buy half of output, yet margins narrow. Commercial and industrial buyers expand at 6.17 % CAGR, prioritizing turnkey biomass-heat contracts to hit net-zero goals across chemicals, food, and paper. Rural households stick with pellet stoves where heat-pump retrofits remain uneconomic.
Geography Analysis
Germany keeps a 22.03 % stake in the Europe bioenergy market, backed by tariff-top-ups for flexible biogas, a National Biomass Strategy that lifts residue utilization, and early BECCS grants. Finland leverages dense forest cover and carbon-tax exemptions to sustain wood-heat competitiveness while mapping 15 Mt CO₂ capture opportunities for its biomass fleet. France scales biomethane via 737 operational sites on track for 50 TWh by 2030 thanks to guaranteed offtake contracts. France focuses on pipeline-quality biomethane, rolling out streamlined permitting that shaves six to twelve months off plant development cycles. Guaranteed purchase agreements at index-linked prices remove volume risk for farmers and cooperatives.
Spain posts 6.95 % annual growth; the market reopened after years of uncertainty when Repsol injected capital into Genia Bioenergy. The resulting portfolio synergizes agricultural-waste sourcing with Spain’s high gas-distribution coverage, letting biomethane displace fossil gas without new infrastructure. Italy shares Spain’s waste-valorization thesis but relies more on industrial partnerships such as Edison-Kanadevia to co-locate digesters with food-processing clusters, leveraging waste-heat recovery for site efficiency.
The United Kingdom sits at a policy crossroads. A review of biomass subsidies clouds the economic outlook for legacy pellet plants, yet BECCS pilots draw Treasury backing as a net-zero linchpin. Drax, for instance, plans to install carbon capture at its 2.6 GW unit, potentially creating Europe’s largest biomass-BECCS hub. In the Netherlands, subsidy termination curbed large forest-biomass projects, but municipal-waste-to-biogas facilities continue under circular-economy targets. Operators here focus on small-scale digesters coupled with district-heat networks, avoiding political backlash over pellet imports.

Regulatory Landscape
The EU Renewable Energy Directive III (Directive (EU) 2023/2413) remains the anchor framework for bioenergy sustainability criteria and renewable-claim eligibility across electricity, heat, and transport, with stricter greenhouse-gas thresholds and a stronger emphasis on the cascading use principle for biomass. A near-term compliance milestone is Commission Delegated Directive (EU) 2024/1405, which updates Annex IX feedstock rules and requires transposition by 14 September 2025, shaping which biofuel and biogas pathways qualify for target counting and support schemes.
The Sustainable Biomass Program (SBP) was re-recognized under Commission Implementing Decision (EU) 2024/3191 from 19 December 2024, providing an accepted route to demonstrate RED compliance through 21 December 2029. In 2026, the European Commission advanced ILUC-related actions, including a delegated act trajectory to reduce the contribution of high ILUC-risk biofuels and biomass fuels through 2030 and a Commission review (COM(2026) 36) that reaffirmed the high ILUC-risk classification for oil palm. This shift is pushing procurement and contracting toward residues, wastes, and demonstrably low-ILUC feedstocks.
Competitive Landscape
The Europe bioenergy market is moderately fragmented, with integrated energy majors, diversified utilities, and specialized biomass players vying across distinct niches. Shell, BP, and TotalEnergies exploit entrenched fuel-supply chains to scale HVO and biomethane offerings, often through joint ventures with agricultural cooperatives. Pure-play operators such as Verbio (crop-residue biomethane), Enviva (pellets), and Neste (HVO) leverage technological depth to defend margins against larger competitors.
Vertical integration shapes strategy: Copenhagen Infrastructure Partners merges feedstock contracts with project-finance muscle to deliver greenfield biomethane hubs, while Drax and Vattenfall treat BECCS retrofits as options on future carbon-removal certificates. In transport fuels, Neste maintains first-mover advantage in HVO production, supplying both road fleets and SAF producers. The mid-market tier features dozens of regional biogas developers using modular digester kits to tap dispersed feedstock. This heterogeneity keeps price discovery local and stimulates M&A, exemplified by 1Vision Biogas’s 2024 acquisition of St1’s Nordic assets.
Europe Bioenergy Industry Leaders
Drax Group plc
ENGIE SA
Verbio SE
Shell plc
Vattenfall AB
- *Disclaimer: Major Players sorted in no particular order

Market Opportunities and Future Outlook
Biomethane scale-up and grid injection infrastructure are the clearest areas of whitespace across Europe, backed by REPowerEU policy direction and visible investment pipelines. This policy direction continues to support project pipeline formation, particularly around upgrading and network integration.
The 2026 Commission trajectory to phase out high ILUC-risk contributions through 2030, combined with RED III sustainability criteria, increases the value of residue-based supply chains, certified woody biomass, and robust mass-balance documentation. It also encourages investment in traceability systems, auditing, and logistics redesign. For existing operators, there is room to lift output from underutilized biomethane assets, making debottlenecking, gas-cleaning upgrades, and connection-point optimization a relatively quick route to additional certified supply for heat, industry, and transport end-users.
Recent Industry Developments
- April 2026: Drax Group plc completed the maiden transatlantic voyage of M.V. Ultra Yorkshire from Baton Rouge to the Port of Liverpool using B100 biofuel while delivering biomass pellets. The shipment highlights decarbonization of biomass logistics, as sustainability scrutiny moves from feedstock origins to supply-chain emissions.
- January 2026: ENGIE SA signed a 10-year biomethane purchase agreement with PepsiCo in the United Kingdom linked to a plant with about 60 GWh per year capacity in the North of England. The long-tenor offtake supports project financing and reflects rising corporate demand for certified renewable gas as an alternative to fossil heat and process energy.
- December 2024: European Energy acquired a Danish biogas-upgrading specialist to strengthen Nordic biomethane capability. The acquisition expands access to upgrading know-how and equipment, supporting the push toward higher shares of grid-quality biomethane and broader gas-network integration.


Research Methodology Framework and Report Scope
Market Definition and Coverage
For this study, the Europe bioenergy market is defined as energy generation capacity and output that comes from biological sources, where biomass, biogas, and biofuels are converted into usable power, heat, or transport energy within Europe.
Scope exclusions: This sizing excludes non-bio renewable sources (such as wind, solar, and hydro) and any fossil-based power capacity, even if it is used alongside bioenergy in the same site.
Segmentation Overview
- By Type
- Solid Biomass
- Biogas
- Renewable Waste
- Other Types
- By Feedstock
- Agricultural Residues
- Forestry Residues
- Energy Crops
- Municipal Solid Waste
- By Technology
- Combustion
- Gasification
- Fast Pyrolysis
- Anaerobic Digestion
- Fermentation
- Other Technologies
- By Application
- Electricity Generation
- Heat Generation
- Transportation Fuel
- Combined Heat and Power (CHP)
- By End-user
- Power Utilities
- Commercial and Industrial
- Residential
- By Country
- Germany
- United Kingdom
- France
- Italy
- Spain
- Finland
- Turkey
- Rest of Europe
Data Sources, Market Sizing, and Validation
Desk Research
We start by building a consistent fact base using energy supply, installed capacity, and policy targets across European countries. Public sources such as Eurostat energy balances, the European Commission energy and climate publications, the International Energy Agency datasets, and IRENA statistics help align definitions and track changes by fuel type. For solid biomass and heat, we also reference sector trackers such as EurObserv'ER barometers, which are used to sanity-check whether consumption and production trends are moving in the direction implied by the model.
To translate technical indicators into a market view that can be compared across countries, we review national energy agency releases, grid operator publications where relevant, and project announcements reported by reputed press. Company filings and investor presentations are then used to confirm commissioning timelines, operating status, and technology choices for major assets. In parallel, we use paid subscriptions for company financials and intelligence, patent databases, and import/export shipment-level signals to cross-check equipment activity and feedstock movement patterns. The sources named here are illustrative and not exhaustive, and several other references were used to collect data, validate assumptions, and clarify market dynamics.
Primary Interviews and Surveys
Primary work is used to stress-test assumptions that desk sources do not fully answer, especially around plant utilization, fuel switching behavior, and the practical impact of incentives. We speak with asset operators, project developers, equipment and service providers, fuel supply participants, utilities, and large industrial users across key European markets, and we then recheck outputs with a small set of independent experts when estimates show wide variance.
Distribution of primary research fieldwork respondents
| Company type | Respondent position | Region |
|---|---|---|
| Top tier: 36% | CXOs: 15% | |
| Mid tier: 46% | Functional/Unit leaders: 26% | |
| Smaller Players: 18% | Managers: 59% |
Market-Sizing & Forecasting
Our sizing logic uses a top-down and bottom-up blend, where country-level bioenergy capacity additions and retirements are reconstructed from energy statistics, policy-driven targets, and known project pipelines, then converted into market totals for Europe. Results are corroborated with selective bottom-up approximations, including sampled capacity by technology, typical capacity factor checks, and channel feedback on equipment demand, which are used to adjust outliers before finalizing totals.
A few inputs keep the model grounded in real operating conditions. Installed capacity by bioenergy route, plant load factors, feedstock availability signals, and commissioning lead times are used to avoid assuming that announced projects immediately become productive capacity. We also track policy variables like renewable heat and transport blending mandates, plus permitting speed and sustainability criteria, because these affect both what gets built and what runs at high utilization. For forecasting, scenario analysis is applied around policy continuity, feedstock pricing pressure, and grid constraints, then the final trajectory is aligned to the consensus view shared by primary respondents on what is realistic in the next five years. When data gaps exist by country or technology, we interpolate using nearby markets with similar policy settings and energy mix, and then revalidate the implied utilization with interview feedback.
Data Validation & Update Cycle
We validate outputs by triangulating across independent signals, including observed capacity movements, reported bioenergy production trends, and publicly stated national targets. If a country total looks unusually high or low versus these external checks, we revisit utilization, conversion assumptions, and the timing of additions, then re-contact selected interviewees when a mismatch persists.
Before sign-off, the model and narrative go through multiple analyst reviews so definitions stay consistent and arithmetic links across tables remain clean. The report is refreshed annually, and interim updates are made when material events occur, such as major policy changes, large plant closures, or shifts in the project pipeline. Right before delivery, we complete a final update pass so clients receive the latest view aligned with the newest publicly available datapoints.
Mordor Intelligence's Europe Bioenergy Market Size Measured Against Other Published Estimates
Published market sizes for Europe bioenergy can appear far apart because the market is sometimes measured in value terms and sometimes reported in energy units like capacity or output. Differences also show up when studies combine biofuels, biogas, and solid biomass in different ways, or when they use different country coverage within Europe.
By tracking capacity additions and utilization checks, Mordor Intelligence keeps the estimate tied to Europe bioenergy build-outs measured in gigawatts, and the gap widens when value-only models rely on price assumptions without aligning them to operating run rates and commissioning timing.
Benchmark comparison
| Source | Market Size | Gaps in Research Methodology |
|---|---|---|
| Mordor Intelligence | USD 47.50 B (2025) | |
| Trade Journal A | USD 43.09 B (2025) | This estimate is presented as a value number and tends to bundle bioenergy pathways with simplified pricing, which can shift totals when utilization and commissioning timing are not explicitly checked. |
| Industry Publisher B | USD 5.10 B (2025) | This figure appears to use a narrower definition that may focus on select applications and policy programs, which can exclude large parts of solid biomass heat and utility-scale assets included in broader Europe bioenergy scope. |
The table indicates that unit choice and scope boundaries are the main reasons for the spread, not a single demand assumption. When sizing is anchored to installed capacity, realistic load factors, and a dated project pipeline, the market total is easier to reproduce country by country. Our checks are also designed to catch timing mismatches, such as assets that are announced but not yet commissioned or running below expected rates.


Key Questions Answered in the Report
What is the 2026 valuation of the Europe bioenergy market?
The Europe bioenergy market size is estimated at 49.69 GW in 2026.
Which segment is growing fastest in the Europe bioenergy market?
Biogas leads with a projected 6.44% CAGR from 2026 to 2031.
Why are sequential crops gaining traction as a bioenergy feedstock?
They avoid ILUC penalties, improve soil health, and now match imported pellet costs after logistics improvements.
How will the EU Deforestation-Free Regulation affect biomass imports?
From December 2025, pellet importers must provide geolocation data and third-party verification, adding EUR 15–25 per tonne to compliance costs.
Which country holds the largest Europe bioenergy market share?
Germany leads with 22.03% of 2025 demand and maintains the highest project pipeline under its 2024 National Biomass Strategy.
What role does BECCS play in Europe’s bioenergy future?
Nordic and UK policies now price negative emissions, prompting utilities to design biomass plants that can retrofit carbon-capture units later in the decade.
Page last updated on:






