
Market Overview
| Study Period | 2021 - 2031 |
|---|---|
| Forecast Data Period | 2026 - 2031 |
| Base Year Market Size (2025) | USD 22.17 Billion |
| Market Size (2026) | USD 24.29 Billion |
| Market Size (2031) | USD 37.17 Billion |
| Growth Rate (2026 - 2031) | 8.88 % |
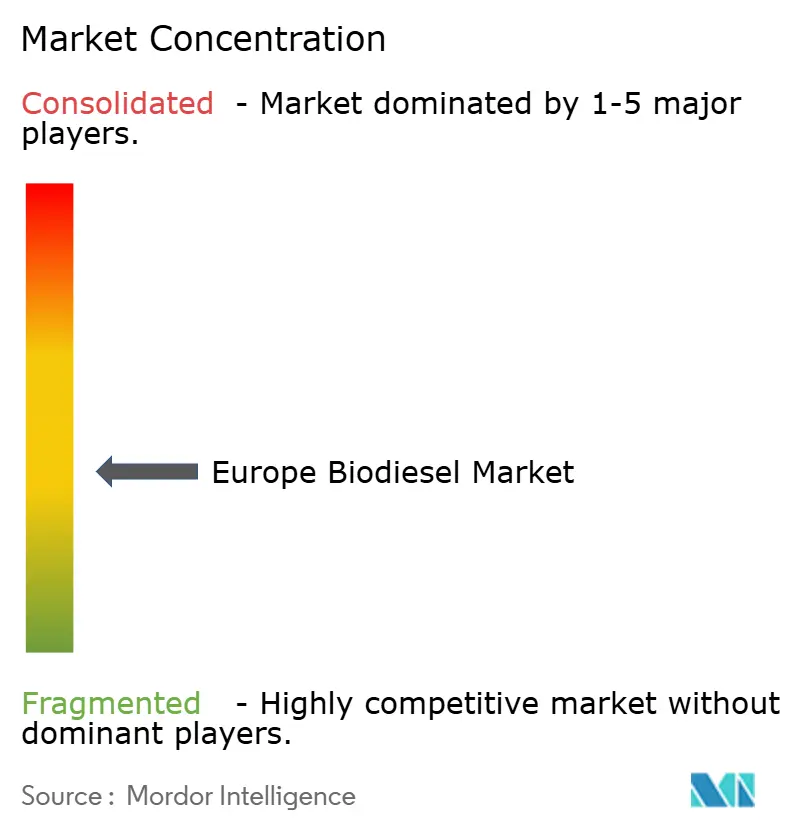
| Market Concentration | Medium |
Major Players *Disclaimer: Major Players sorted in no particular order Image © Mordor Intelligence. Reuse requires attribution under CC BY 4.0. | |
Europe Biodiesel Market Analysis by Mordor Intelligence
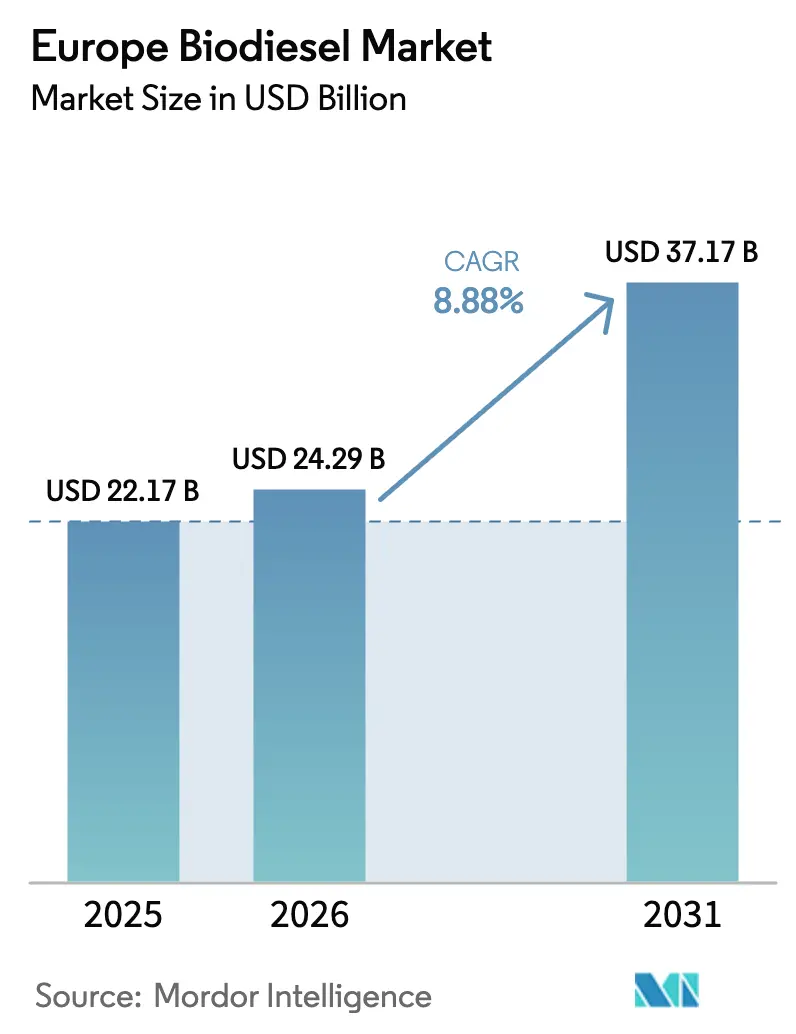
The Europe Biodiesel Market size is expected to grow from USD 22.17 billion in 2025 to USD 24.29 billion in 2026 and is forecast to reach USD 37.17 billion by 2031 at 8.88% CAGR over 2026-2031.
Demand growth is anchored in the Renewable Energy Directive III, which double-counts waste oils, and in FuelEU Maritime rules that open a bunker-fuel outlet for FAME and HVO blends. Rapeseed oil continues to dominate feedstock selection because its well-established crushing base in Germany and France keeps delivering costs below imports of soybean and palm oils.[1] At the same time, animal fats and used cooking oil (UCO) enjoy a regulatory premium that lifts their spot prices and draws new collection capacity, while OEM certifications for B30 and B100 engines are unlocking higher-blend demand from heavy-duty fleets.[2] Competitive conditions are shifting as integrated refiners retrofit petroleum units for co-processing, compressing margins for standalone plants, and accelerating consolidation in the European biodiesel market.
Key Report Takeaways
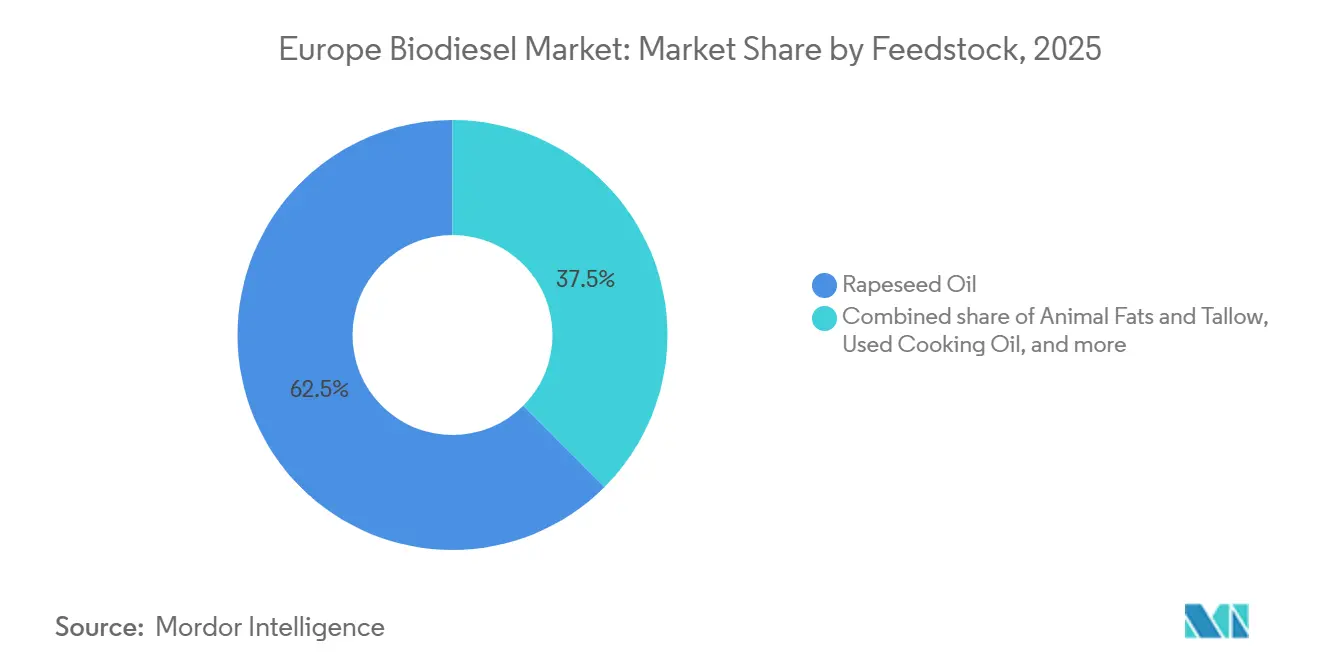
- By feedstock, rapeseed oil accounted for 62.5% of Europe's biodiesel market share in 2025, whereas animal fats and tallow are set to post the fastest expansion at a 12.5% CAGR through 2031.
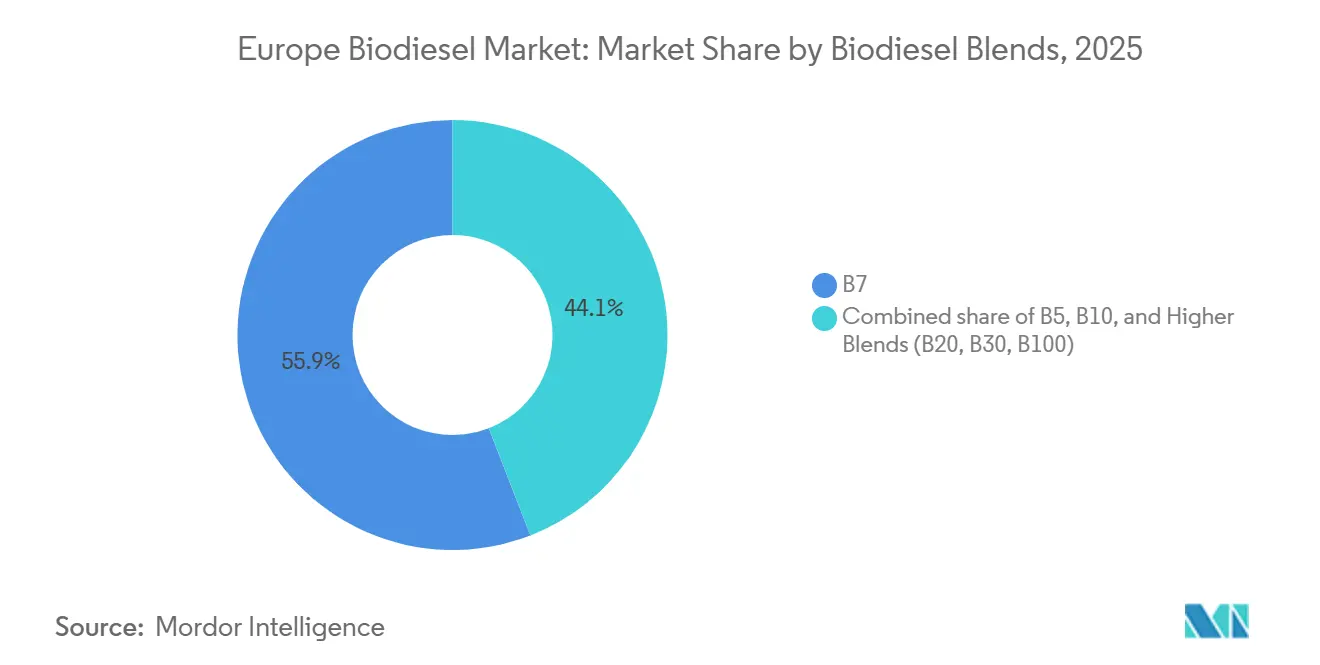
- By blend, B7 held 55.9% of consumption in 2025, but higher blends (B20, B30, B100) are forecast to rise at a 19.5% CAGR to 2031.
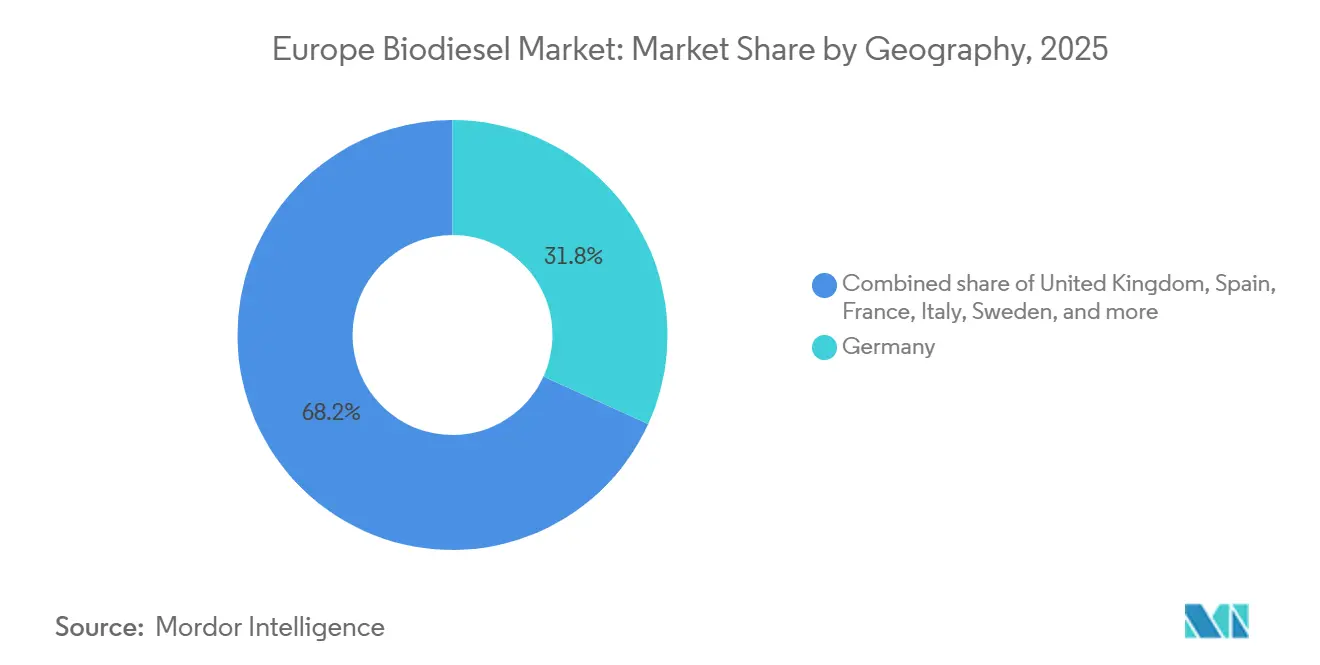
- By geography, Germany led with a 31.8% share in 2025, while the United Kingdom is projected to grow at a 14.1% CAGR over the same horizon.
Note: Market size and forecast figures in this report are generated using Mordor Intelligence’s proprietary estimation framework, updated with the latest available data and insights as of January 2026.
Europe Biodiesel Market Trends and Insights
Drivers Impact Analysis*
| Driver | (~) % Impact on CAGR Forecast | Geographic Relevance | Impact Timeline |
|---|---|---|---|
| Rapeseed-oil cost advantage versus competing low-carbon fuels | 1.20% | Germany, France, Poland, Central Europe | Medium term (2-4 years) |
| RED III double-counting that turbo-charges waste-oil demand | 2.10% | EU-wide, strongest in Netherlands, Spain, UK | Long term (≥ 4 years) |
| Record HVO capacity build-out across Spain, France & the Nordics | 1.80% | Spain, France, Finland, Sweden, Netherlands | Medium term (2-4 years) |
| Maritime FuelEU bunker demand for FAME/HVO blends | 0.90% | Netherlands, Spain, Italy, Greece | Long term (≥ 4 years) |
| Export arbitrage to the United States after the 2024 price crash | 0.60% | Germany, Netherlands, Belgium | Short term (≤ 2 years) |
| OEM pre-approval of B30/B100 truck engines for EU ETS-road compliance | 1.40% | Germany, France, Italy, Spain | Medium term (2-4 years) |
| Source: Mordor Intelligence | |||
Rapeseed-Oil Cost Advantage Versus Competing Low-Carbon Fuels
Rapeseed oil traded at EUR 580-620 per tonne in early 2026, a EUR 60-100 discount to landed soybean oil, giving refiners a structural edge when producing FAME that meets EN 14214 specs. Logistics from French and German farms to nearby plants keep freight low, and the feedstock avoids the deforestation risk premiums tied to palm-derived biodiesel under RED III.[3] The resulting cost cushion of EUR 0.08-0.12 per liter versus fossil diesel supports blending mandates without extra subsidies. Weather volatility narrowed that margin in 2024-2025, when drought and flooding cut yields below 3.2 tonnes per hectare and lifted rapeseed prices above EUR 620 per tonne, showing how agronomic shocks can rapidly erode a seemingly durable advantage. Refiners then turned to soybean oil, but higher carbon-intensity scores under FuelEU shrank profitability and reinforced the value of local rapeseed when harvests normalize.
RED III Double-Counting That Turbo-Charges Waste-Oil Demand
Since November 2023, waste oils and animal fats earn double compliance credits toward national transport targets, effectively doubling their economic value. Spot UCO prices climbed from EUR 850 per tonne in early 2024 to EUR 1,150 by mid-2025 as refiners competed for limited supply.[4] Investors responded by expanding collection networks across Spain, Italy, and Poland, regions previously underserved by structured pick-up systems. The incentive also spurred fraudulent imports, prompting mandatory ISCC PLUS audits on all non-EU waste-lipid cargoes from January 2026. While the rule accelerates feedstock diversification, it tightens supply for road biodiesel as aviation mandates rise, forcing producers to balance rapeseed reliance with compliance credit economics.
Record HVO Capacity Build-Out Across Spain, France & the Nordics
European HVO capacity grew from 3.2 million tpy in 2023 to 5.8 million tpy by end-2025, led by Neste, TotalEnergies, Cepsa, and Scandinavian refiners. HVO’s higher cetane number of 75-85 versus 51-55 for FAME makes it the preferred drop-in fuel for marine and aviation users, and its production economics improve when co-located with existing hydrogen and heat-recovery assets. Capital intensity averages EUR 150-200 million per 100,000 tpy, favoring integrated majors that retrofit petroleum units rather than build greenfield plants. By 2027, HVO facilities are expected to absorb 35-40% of Europe’s waste-lipid stream, up from 22% in 2024, shifting feedstock away from traditional FAME producers. This tilt alters pricing power in the European biodiesel market as standalone players scramble for supply or pivot toward specialty blends.
Maritime FuelEU Bunker Demand for FAME/HVO Blends
FuelEU Maritime imposed a 2% greenhouse-gas-intensity cut on fuels supplied to ships from January 2025, scaling to 6% by 2030. Roughly 11,000 European short-sea and ro-ro vessels lack the capital to switch to LNG or electricity, so operators have turned to bio-blends. Early contracts with Maersk, CMA CGM, and Stena Line secured 1.2 million tonnes of biodiesel bunkers for delivery by 2026. Storage hubs in Rotterdam, Antwerp, Barcelona, and Piraeus have installed dedicated bio-fuel lines to prevent contamination, broadening logistical reach. Because FuelEU’s well-to-wake accounting favors waste-derived inputs, UCO demand gains an independent anchor beyond road transport, adding a durable pull on limited feedstock pools in the European biodiesel market.
Restraints Impact Analysis*
| Restraint | (~) % Impact on CAGR Forecast | Geographic Relevance | Impact Timeline |
|---|---|---|---|
| Rapeseed supply crunch from 2024-2026 harvest deficits | -0.80% | France, Germany, Poland, Romania | Short term (≤ 2 years) |
| Fraudulent UCO imports triggering tighter traceability audits | -0.50% | EU-wide, focus in Germany, Netherlands | Medium term (2-4 years) |
| Fast-tracking of battery-electric vans under AFIR | -0.40% | Germany, France, Netherlands, UK | Long term (≥ 4 years) |
| SAF mandates cannibalizing waste-lipid pools from 2027 | -1.10% | EU-wide, acute in France, Netherlands | Long term (≥ 4 years) |
| Source: Mordor Intelligence | |||
Rapeseed Supply Crunch From 2024-2026 Harvest Deficits
Crop shortfalls cut European rapeseed output to 16.8 million tonnes in 2024-2025, versus 18.2 million tonnes two years earlier, lifting oil prices above EUR 620 per tonne. The squeeze forced refiners to import soybean oil that carries higher lifecycle emissions, reducing margin under RED III rules. Surpluses from Poland and Romania offset only part of the deficit. The episode underscored the need to diversify feedstocks and highlighted yield risk in a warming climate. Continued weather volatility is likely to keep rapeseed costs elevated into 2027, muting growth for the crop-based tier of the European biodiesel market.
SAF Mandates Cannibalizing Waste-Lipid Pools From 2027
The EU mandates a minimum 2% sustainable aviation fuel share in 2027, rising steeply thereafter, diverting an estimated 15-20% of waste-lipid volume away from road biodiesel. Airlines favor hydroprocessed esters that use the same UCO and tallow inputs prized by biodiesel refiners. Competition for feedstock is expected to widen price spreads and compress margins for road-fuel producers without captive supply. Refiners with integrated HVO capacity may pivot to aviation, while smaller FAME plants could face feedstock rationing. This redistribution is poised to reshape supply chains faster than refinery economics alone would suggest, adding volatility to the European biodiesel market.
*Our forecasts treat driver/restraint impacts as directional, not additive. The impact forecasts reflect baseline growth, mix effects, and variable interactions.
Segment Analysis
By Feedstock: Waste Lipids Gain Despite Rapeseed Dominance
Rapeseed retained 62.5% of the 2025 volume, equal to 13.8 million tonnes out of a 22 million tonne pool, underlining its entrenched position in the European biodiesel market for feedstocks. Yet animal fats and tallow are forecast to expand at a 12.5% CAGR through 2031, outpacing every other input. UCO sits second today but faces traceability scrutiny after customs uncovered adulterated imports in 2024. Soybean and palm oils together stay below 10% because carbon-intensity penalties and logistical costs blunt their appeal. Sunflower oil experienced a temporary bump during the rapeseed shortfall, though its high iodine number limits winter blending in northern Europe. Advanced lipids such as algae remain below 1%, confined to pilot plants that have yet to hit commercial scale.
Waste-lipid valuation has doubled since 2023 on RED III credits, sparking investment in collection fleets across southern and eastern Europe. However, the 2027 aviation mandate threatens to siphon 15-20% of that pool, tightening road-fuel supply and lifting volatility. Producers with vertically integrated waste-oil sourcing enjoy premium margins, while spot-market buyers face elevated credit risk. The tussle between rapeseed stability and waste-lipid incentives will determine the next phase of the European biodiesel market, with dual-feedstock flexibility emerging as a key competitive lever.

By Biodiesel Blends: Higher Concentrations Accelerate
B7 represented 55.9% of blended road diesel in 2025, maintaining its role as the standard tier within national mandates across much of the European biodiesel market size for blends. Higher blends (B20, B30, B100) are projected to rise at a 19.5% CAGR, powered by OEM warranties and looming EU ETS-road costs. Germany, France, and the Benelux region already support B10 retail pumps, and logistics firms such as DHL and DB Schenker have locked in B30 contracts to hedge carbon exposure.
OEM approvals issued in 2024-2025 eliminated warranty fears, enabling fleets to adopt B30 and, for captive depots, B100 that bypasses cold-flow constraints. FuelEU Maritime adds another outlet, with ro-ro operators choosing B20-B30 mixes to meet 2025 compliance at minimal capex. By 2028, higher blends could capture 20% of heavy-duty diesel demand, carving out a premium tier less sensitive to pump-price swings. This bifurcation splits the European biodiesel market into a commodity B7 segment and a value-added high-blend channel, each with distinct feedstock and pricing dynamics.
Geography Analysis
Germany captured 31.8% of the European biodiesel market in 2025, supported by 2.2 million tonnes of annual capacity and long-standing blending rules. Growth is slowing, though, because the crop-based cap nears its 7% ceiling and battery-electric vans erode B10 demand in cities. France and Spain are rising on the back of new HVO sites at La Mède and Huelva that serve both domestic mandates and export channels. Italy relies on Eni’s Venice and Gela co-processing hubs, which supply multi-feedstock diesel at lower cost than standalone FAME plants.
The United Kingdom is the fastest-growing market, heading for a 14.1% CAGR through 2031 as tighter RTFO rules boost demand for waste-based biodiesel and encourage investments in UCO import terminals at Immingham and Southampton. The Netherlands, while smaller, acts as Europe’s trading hub, with Rotterdam storing volumes that move into Germany, Belgium, and the UK. Poland’s rapeseed surplus underpins new crushing projects, while Sweden and Finland exploit forestry residues to produce tall-oil biodiesel that qualifies for RED III double-counting.
Diverging policy ambition is reshaping the map. Germany’s share may plateau as electrification in light vehicles advances, whereas the UK and Iberia could jointly rival Germany by 2030. Scandinavia, leveraging tall-oil and advanced feedstocks, supplies premium blends to marine and aviation users. Central and Eastern Europe grow in tandem with rapeseed yields and cross-border trade. Together, these shifts indicate a gradual diffusion of volume away from the historic German core toward a more balanced European biodiesel market.
Regulatory Landscape
The European biodiesel market is governed primarily by the Renewable Energy Directive III (RED III, Directive (EU) 2023/2413), which establishes an EU framework for transport decarbonization (29% renewable energy share in transport by 2030, or a 14.5% greenhouse-gas-intensity reduction). RED III also tightens sustainability and feedstock rules through caps and sub-targets, including a general maximum limit of 7% for food and feed-based biofuels (linked to member-state 2020 levels), a 1.7% cap for Annex IX Part B feedstocks, and an increasing combined sub-target for advanced biofuels (Annex IX Part A) and RFNBOs from 1% in 2025 to 5.5% in 2030, steering demand toward waste and advanced pathways.
Implementation and trade defense measures are near-term variables. As of early 2026, member-state transposition of RED III remains uneven (tracked by the European Biodiesel Board), which affects how blending obligations and eligible feedstocks are applied across Europe. On trade, the European Commission imposed definitive anti-dumping duties on biodiesel imports from China in April 2025 (Regulation (EU) 2025/261), reducing competitive pressure from low-priced imports and shifting procurement toward EU production and certified supply chains. Separately, the Commission progressed updates to the high ILUC-risk framework in 2026 through a report and draft amending measures linked to Commission Delegated Regulation (EU) 2019/807, reinforcing the phase-down trajectory for high ILUC-risk biofuels toward 2030.
Competitive Landscape
The top five suppliers, Neste, TotalEnergies, Eni, Repsol, and Cepsa, controlled roughly 40% of output in 2025, leaving the remaining 60% split among regional producers and trading houses. Integrated oil majors enjoy cost advantages by retrofitting existing hydrocrackers to co-process bio-feedstocks, reducing capital intensity to EUR 140 per tonne of annual capacity, about 30% below standalone builds. Neste’s 1.4 million tonne Rotterdam and Porvoo expansions typify this model, sharing hydrogen and utilities with adjacent fossil units for rapid scale-up.
Pure-play firms such as Verbio, Greenergy, and Argent Energy defend their share by signing long-term UCO contracts and adopting ISCC PLUS or REDcert systems to pass the stricter fraud audits introduced in 2026. Mid-tier players lacking feedstock integration face shrinking margins as waste-lipid prices rise and rapeseed supply tightens. White-space opportunities center on high-FFA pre-treatment, blockchain traceability, and modular HVO units licensed by technology houses like Honeywell UOP.
Patent filings in enzymatic transesterification and supercritical methanol rose 18% in 2024-2025, showing a race to improve yield and broaden feedstock options. Digital twins and AI-driven optimization help refiners tune processes to variable UCO quality, emerging as differentiators in a market where feedstock volatility is the chief risk. Consolidation is expected to continue as majors buy distressed assets or sign offtake contracts, further tightening the competitive field in the European biodiesel market.
Europe Biodiesel Industry Leaders
-
Neste Oyj
-
TotalEnergies SE
-
Eni S.p.A.
-
Greenergy International Ltd.
-
Verbio AG
- *Disclaimer: Major Players sorted in no particular order
Market Opportunities and Future Outlook
Opportunities center on compliance-grade feedstock security, auditing, and logistics as RED III shifts value toward waste and advanced inputs while tightening oversight. Mandatory ISCC PLUS-style auditing for non-EU waste-lipid cargoes from January 2026 (in response to fraudulent UCO imports) raises the need for traceability services, segregated storage, and pre-treatment that can handle variable-quality, high-FFA streams. This direction aligns with current capacity placement near secured waste-lipid pools, with ORLEN launching an HVO plant in Plock, Poland (300,000 tpy, June 2026) around domestic feedstocks and Repsol starting a renewable diesel plant in Puertollano, Spain (200,000 tpy, May 2026) using used cooking oil and agri-food waste.
A second opportunity lies in demand creation beyond conventional road blending, supported by maritime and corporate-fleet decarbonization channels that favor drop-in renewable diesel and high-blend biodiesel. FuelEU Maritime opened bunker demand for bio-blends from 2025, while storage hubs such as Rotterdam and Antwerp added dedicated biofuel handling. Corporate procurement agreements are also expanding end-use adoption, including Enilive (Eni) partnering with BMW Group in Italy (July 2026) to supply HVOlution for corporate fleets. Alongside this, the EU-27 produced 14.7 million metric tonnes of FAME and HVO in 2025 (EBB statistical reporting), while industry calls for clearer and more harmonized RED III transposition point to whitespace for standardized compliance implementation and more bankable offtake structures that can reduce country-to-country uncertainty.
Recent Industry Developments
- July 2026: Enilive (Eni) signed an agreement with BMW Group to supply HVOlution diesel biofuel for BMW corporate fleets in Italy. The partnership expands downstream pull for HVO in on-road applications beyond regulated blending, supporting incremental demand through corporate decarbonization procurement.
- April 2026: Eni and the European Investment Bank signed a EUR 500 million, 15-year loan agreement tied to converting units at the Sannazzaro de Burgondi site into a 550,000-tonne-capacity biorefinery. The financing strengthens long-cycle investment visibility for refinery-to-biorefineries conversions and supports additional HVO-type output capacity within Europe’s supply base.
- March 2024: Neste announced a EUR 120 million program to add 400,000 tpy of renewable diesel capacity at its Singapore site, with part of the output allocated to Europe’s bunker market. The move increases available renewable diesel volumes for European marine customers, reinforcing the role of global production hubs in supplying European compliance and bunker demand.
Research Methodology Framework and Report Scope
Market Definition and Coverage
For this report, the market is defined as the value of biodiesel supplied and consumed across Europe, covering common biodiesel blend use in road fuels and related demand in the region, and expressed in USD terms.
Scope exclusions: We exclude upstream farming activity and crude feedstock production value, and we also exclude non-biodiesel renewable fuels when they are marketed and priced as separate products.
Segmentation Overview
- By Feedstock
- Rapeseed Oil
- Used Cooking Oil (UCO)
- Soybean Oil
- Palm Oil
- Sunflower Oil
- Animal Fats and Tallow
- Algal and Other Advanced Feedstocks
- By Biodiesel Blends
- B5
- B7
- B10
- Higher Blends (B20, B30, B100)
- By Geography
- Germany
- France
- Spain
- United Kingdom
- Italy
- Netherlands
- Poland
- Sweden
- Finland
- Rest of Europe
Data Sources, Market Sizing, and Validation
Desk Research
Desk research helped us set the boundaries correctly and build the first demand and supply picture before any modeling was finalized. We used public datasets and policy references such as Eurostat energy statistics, the European Commission renewable energy and fuel quality documentation, and publications from agencies such as the International Energy Agency.
To translate volumes into value, we also reviewed signals that explain blending and price movement, which came from sources such as the European Biodiesel Board statistical releases, customs and trade statistics from UN Comtrade, and peer reviewed papers that discuss feedstock availability and conversion yields. Company annual reports, investor presentations, and reputable energy press were used to cross-check capacity announcements and operating changes. We also used a paid subscription database for shipment-level import and export screening, and a patent database where public detail was thin. The desk sources listed here are illustrative, and many other public and paid references were used to collect, confirm, and clarify data points.
Primary Interviews and Surveys
Primary work was used to stress-test the model where published data is delayed, aggregated, or inconsistent by country. We spoke with a mix of producers, distributors, blenders, and large end users, and we also included trade and regulatory-informed experts across key European demand centers to validate blending behavior, pricing pass-through, and realistic utilization assumptions.
Distribution of primary research fieldwork respondents
| Company type | Respondent position |
|---|---|
| Top tier: 36% | CXOs: 15% |
| Mid tier: 44% | Functional/Unit leaders: 29% |
| Smaller Players: 20% | Managers: 56% |
Market-Sizing & Forecasting
We sized the Europe biodiesel market by first reconstructing the demand pool using country-level fuel consumption and blending requirements, and then mapping how biodiesel volumes flow through blending into final use. That top-down and bottom-up logic was complemented by selective supplier roll-ups and channel checks so totals could be adjusted when the implied volumes or values did not match reality.
Key inputs used in the model included biodiesel blend mix (such as B5, B7, B10, and higher blends), country-level diesel demand trends, domestic production capacity and utilization ranges, net trade direction for biodiesel, and feedstock-related pricing pressure that influences achievable selling prices. For value conversion, average selling prices were built as a practical range by country groupings, and then weighted by blend mix and trade exposure so the final USD value did not rely on a single headline price. Where bottom-up evidence was missing for smaller countries, gaps were handled through peer-country proxies and then re-checked against regional totals.
For forecasting, scenario analysis was used to reflect policy and compliance-driven demand shifts, followed by smoothing on the underlying demand series to avoid overreacting to a single-year price spike. Assumptions on blend progression, utilization, and trade balance were reviewed with interview feedback, and then locked only after they aligned with what buyers and suppliers considered executable over the forecast window.
Data Validation & Update Cycle
Outputs were validated through triangulation, where the modeled value was compared with independent signals such as implied biodiesel volume from blending targets, trade direction checks, and capacity utilization realism by major producing countries. When large variances appeared, the driver was traced back to one of the core levers (blend mix, demand, price, or net trade), and the assumption was revisited and, if needed, verified again with respondents.
Before sign-off, the model and narrative go through a multi-step analyst review so unit consistency, currency treatment, and year alignment issues are caught early. The report is refreshed annually, and interim updates are triggered when material events occur, such as major mandate changes, sharp feedstock price shifts, or meaningful capacity moves. Right before delivery, we perform a fresh pass on key inputs so clients receive the most current view available at the time of purchase.
Mordor Intelligence's Europe Biodiesel Market Size Compared Against Other Published Estimates
Published market sizes for Europe biodiesel often differ, even when they appear to be describing the same thing, because the boundaries and timing choices are not always consistent. Differences typically come from what gets counted as biodiesel value, which year is treated as the base, and how prices are averaged when feedstock costs swing.
In practice, the biggest gaps come from refresh cadence and currency timing, along with whether a study uses a stable annual average selling price range versus a point-in-time price. When the latest regulatory changes and blend behavior are incorporated and then cross-checked against capacity and trade direction, the estimate stays anchored to what the market can actually supply and absorb, which is the refresh-led approach applied by Mordor Intelligence.
Benchmark comparison
| Source | Market Size | Gaps in Research Methodology |
|---|---|---|
| Mordor Intelligence | USD 22.17 B (2025) | |
| Trade Publisher A | USD 11.44 B (2024) | Uses an earlier base year and a narrower value capture in practice, and the price basis can reflect a different averaging window, which is important in years with high feedstock-driven volatility. |
| Industry Brief B | USD 10.84 B (2023) | The estimate is anchored to an older demand and pricing context, and it appears to use broader, less frequently refreshed assumptions around blending momentum and utilization, which can understate later-year value. |
The table shows that timing and price logic explain most of the spread, rather than a single disagreement about growth direction. By keeping the scope tied to biodiesel blend demand and by validating prices and volumes against trade and capacity signals, the resulting number is easier to trace and repeat when the market shifts.
Key Questions Answered in the Report
How large is the Europe biodiesel market in 2026?
The market is valued at USD 24.29 billion in 2026, tracking the 8.88% growth path toward USD 37.17 billion by 2031.
Which feedstock leads production volumes?
Rapeseed oil supplies 62.5% of 2025 output, benefiting from local crop supply and established crushing assets.
What blend level is expanding the fastest?
Higher blends such as B20, B30, and B100 are rising at a 19.5% CAGR thanks to new OEM engine certifications.
Why is the United Kingdom the fastest-growing national market?
Post-Brexit tightening of the Renewable Transport Fuel Obligation and new waste-oil import terminals drive a 14.1% CAGR.
How are integrated oil majors gaining cost advantage?
They retrofit existing hydrocrackers to co-process bio-feedstocks, sharing hydrogen and utilities to cut capital intensity by roughly 30%.
What impact will SAF mandates have after 2027?
Sustainable aviation fuel rules will divert up to 20% of waste-lipid feedstock, tightening supply for road biodiesel refiners.