
Market Overview
| Study Period | 2021 - 2031 |
|---|---|
| Forecast Data Period | 2026 - 2031 |
| Base Year Market Size (2025) | 168.77 kilotons |
| Market Volume (2026) | 207.67 kilotons |
| Market Volume (2031) | 610.05 kilotons |
| Growth Rate (2026 - 2031) | 24.05 % |
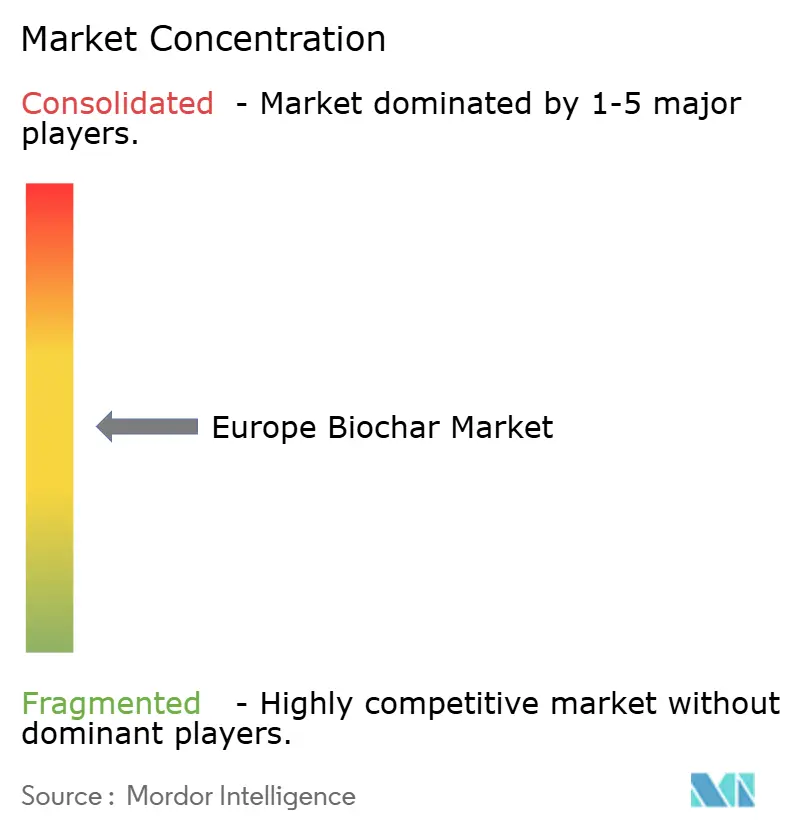
| Market Concentration | Medium |
Major Players *Disclaimer: Major Players sorted in no particular order Image © Mordor Intelligence. Reuse requires attribution under CC BY 4.0. | |
Europe Biochar Market Analysis by Mordor Intelligence
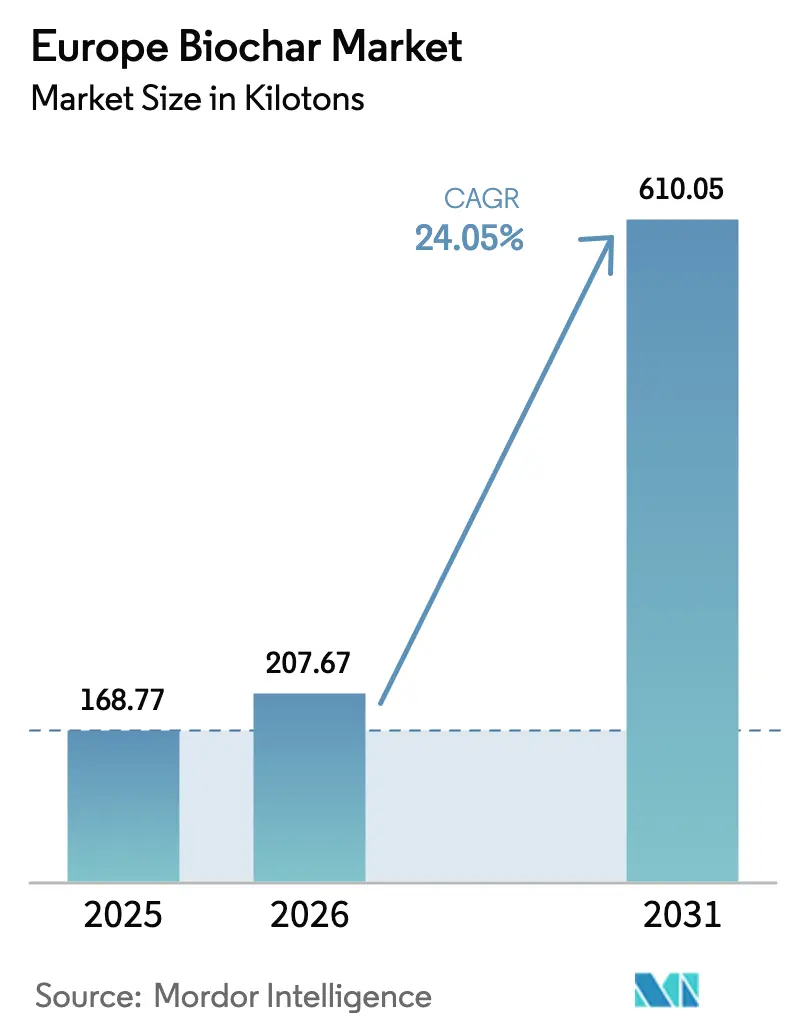
The Europe Biochar Market size was valued at 168.77 kilotons in 2025 and is estimated to grow from 207.67 kilotons in 2026 to reach 610.05 kilotons by 2031, at a CAGR of 24.05% during the forecast period (2026-2031). Market momentum is shifting from pilot projects to industrial deployment as the European Union’s carbon-removal mandates, the revised Emissions Trading System, and the inclusion of biochar in the EU Fertilising Products Regulation (CMC14) collectively formalize demand. Germany’s district-heating networks, the United Kingdom’s sewage-sludge valorization plans, and Nordic forestry residues anchor regional scale-up, while corporate prepaid carbon-credit deals de-risk new capacity. Technology choice is consolidating around modular pyrolysis reactors that integrate with existing biomass streams at lower capital intensity than gasifiers. Feed-additive use in livestock, cement and steel substitution, and phosphorus-rich char from municipal sludge diversify revenue, but fragmented biomass logistics and the absence of pan-EU agronomic field-rate guidance temper near-term adoption.
Key Report Takeaways
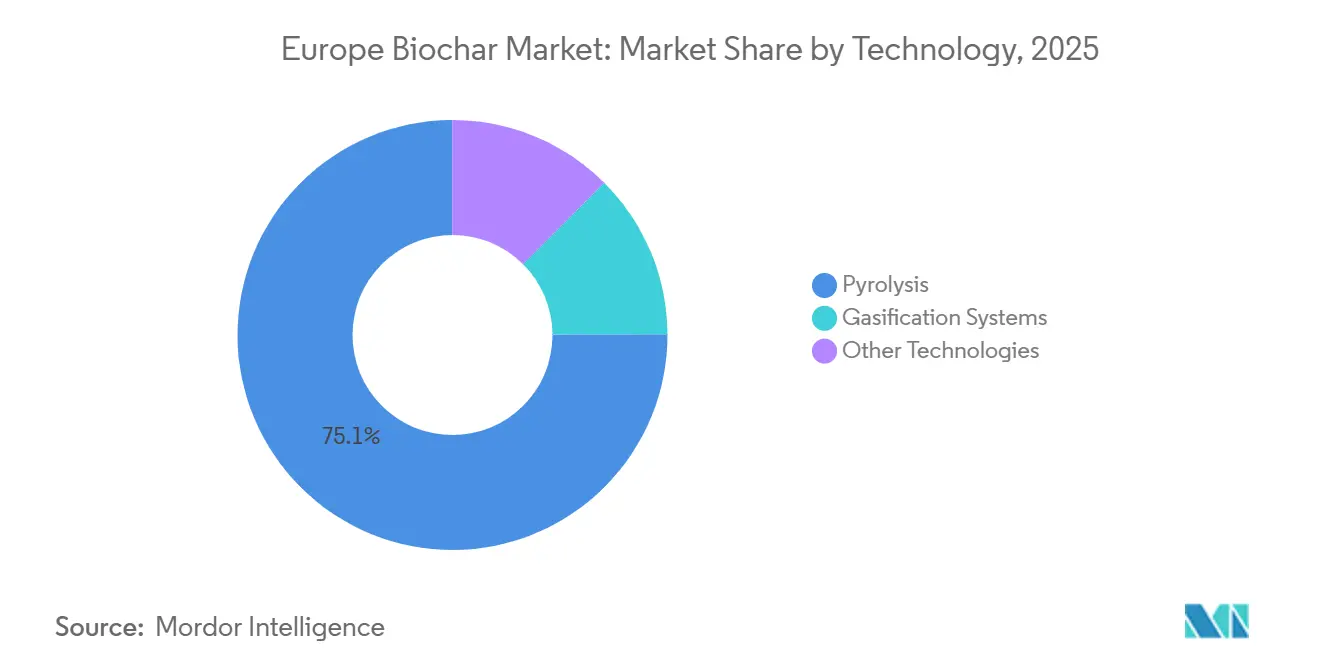
- By technology, pyrolysis held 75.06% of the Europe biochar market share in 2025 and is advancing at a 24.55% CAGR through 2031.
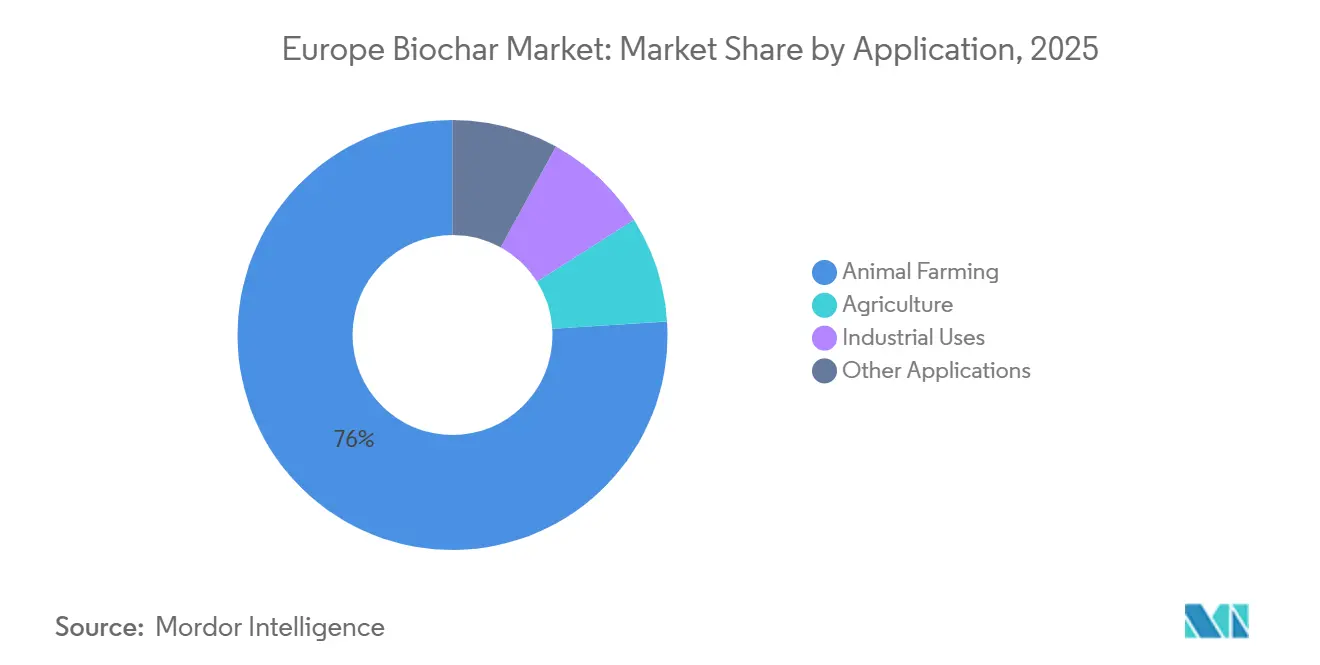
- By application, animal farming accounted for 75.99% of the Europe biochar market size in 2025, while industrial uses are projected to grow at a 26.10% CAGR to 2031.
- By geography, Germany led with 29.47% of the Europe biochar market share in 2025 and is forecast to rise at a 24.51% CAGR over the outlook period.
Note: Market size and forecast figures in this report are generated using Mordor Intelligence’s proprietary estimation framework, updated with the latest available data and insights as of 2026.
Market Trends and Insights
Drivers Impact Analysis of Europe Biochar Market*
| Driver | (~) % Impact on CAGR Forecast | Geographic Relevance | Impact Timeline |
|---|---|---|---|
| EU regenerative & organic-farming demand surge | +6.2% | Germany, France, Italy, Nordic countries | Medium term (2-4 years) |
| Scale-up of carbon-credit purchase agreements | +5.8% | Global, with concentration in Germany, UK, Nordic | Short term (≤ 2 years) |
| Inclusion of CMC14 biochar in EU Fertilising Products Regulation | +4.5% | Pan-European, early gains in Germany, France, Netherlands | Medium term (2-4 years) |
| Industrial heat-recovery economics from district-heating pyrolysis | +3.9% | Germany, Nordic countries, Austria | Long term (≥ 4 years) |
| Biochar-enabled phosphorus recycling from sewage-sludge streams | +2.7% | UK, Germany, Netherlands, Nordic municipalities | Long term (≥ 4 years) |
| Source: Mordor Intelligence | |||
EU Regenerative & Organic-Farming Demand Surge
Organic and regenerative agriculture programs funded under the EU Common Agricultural Policy allocate EUR 8.1 billion for 2023-2027, and biochar qualifies as a subsidized soil amendment under Eco-Schemes. France expanded organic acreage by 11% in 2024 and documented cereal and vineyard yield gains of 15%-22% when biochar was applied under drought stress, prompting its Ministry of Agriculture to embed biochar in the national soil-health roadmap[1]. Germany launched a EUR 50 million demonstration covering 500 farms in 2025 to validate sequestration and fine-tune field protocols. While subsidies pull demand forward, inconsistent agronomic guidelines on particle size, feedstock origin, and crop-specific rates create variable field results that slow mainstream adoption. Italy and Spain lag because biochar still carries an experimental classification until domestic law fully transposes EU Regulation 2019/2783.
Scale-Up of Carbon-Credit Purchase Agreements
Voluntary buyers procured 47,000 biochar removal certificates in 2024, up 161% year over year, at EUR 150-200 per t of CO₂e, as corporates such as Microsoft, Shopify, and Stripe prioritized durable removals[2]. NOVOCARBO locked a 10-year, 100,000-ton offtake with a Swiss reinsurer in 2025, securing EUR 18 million in advance revenue that financed a 12 kt plant in Brandenburg. European Biochar Certificate (EBC) audits now accompany 89% of issuances, tightening quality and permanence standards. Pricing remains volatile; spot values fell 22% in late 2025 amid scrutiny of durability claims, so producers without long-term contracts face margin pressure. Forthcoming EU Carbon Removal Certification, slated for 2026, is expected to raise monitoring and verification thresholds, advantaging integrated players with in-house analytics.
Inclusion of CMC14 Biochar in EU Fertilising Products Regulation
EU Regulation 2019/2783 allows biochar meeting carbon and contaminant limits to circulate freely across member states as CMC14 material. Germany clarified that char derived from forestry or green waste qualifies automatically, while treated wood or sludge feedstocks need extra dioxin tests. The Netherlands transposed CMC14 in early 2025, opening 1.8 million ha of arable land and triggering a 34% rise in imports from Germany and Austria. France and Italy lag in transposition, creating a two-speed market where certified biochar commands 30%-40% price premiums in early-adopter countries. Producers investing in blockchain-based traceability mitigate the risk of cross-border shipment rejection.
Industrial Heat-Recovery Economics from District-Heating Pyrolysis
District-heating networks retrofit pyrolysis units that convert forestry and agricultural residues into biochar while capturing high-grade heat for buildings, achieving system efficiencies above 80%. PYREG’s 3 kt plant in Dörth supplies 2.5 MWth to a local grid and generates EUR 1.2 million in annual heat sales in addition to biochar revenue. Finland’s Carbon Finland reports a 4.8-year payback for a comparable installation when sited within 5 km of heat demand. Germany’s Building Energy Act now requires new district heating to source at least 50% renewable energy by 2030, boosting project pipelines. Capital costs of EUR 3-5 million for a 2 kt unit with heat exchangers limit deployment to municipalities with investment-grade credit or EU cohesion funds.
Restraints Impact Analysis of Europe Biochar Market*
| Restraint | (~) % Impact on CAGR Forecast | Geographic Relevance | Impact Timeline |
|---|---|---|---|
| Fragmented EU biomass-waste logistics inflate feedstock costs | -3.80% | Pan-European, acute in Southern and Eastern regions (Spain, Italy, Poland) | Short term (≤ 2 years) |
| Absence of pan-EU agronomic guidelines for biochar field-rates | -2.10% | Germany, France, Italy, Spain, with spillover to Central Europe | Medium term (2-4 years) |
| Potential long-term PAH / heavy-metal liability for non-certified char | -1.90% | Pan-European, concentrated in markets with untreated wood or contaminated feedstocks | Long term (≥ 4 years) |
| Source: Mordor Intelligence | |||
Fragmented EU Biomass-Waste Logistics Inflate Feedstock Costs
Feedstock costs swing from EUR 35/t for Nordic forestry residues to EUR 90/t for Southern European agricultural waste because collection and drying infrastructure is patchy. Only 38% of German agricultural residues were utilized industrially in 2024, with the remainder burned or left in the field. Olive-pruning residues in Spain and Italy are scattered across smallholder farms, and transport beyond 80 km often renders biochar production uneconomic. Mobile pyrolysis units piloted by France’s INRAE in 2025 cut feedstock expense 42% but carry a EUR 1.8 million capex that suits only well-capitalized cooperatives. The EU Biomass Mobilisation Strategy will co-fund aggregation hubs from 2026, yet meaningful relief may not arrive until 2028.
Absence of Pan-EU Agronomic Guidelines for Biochar Field-Rates
Safety thresholds under CMC14 do not specify application rates or incorporation depth, forcing farmers to rely on inconsistent supplier advice. Germany’s Thünen Institute suggests 5-10 t/ha for sandy soils but lacks cross-climate validation. French trials show that above 15 t/ha biochar can immobilize nitrogen and cut first-year yields by 8%-12%. The UK’s 2025 calculator covers only 12 crop-soil combinations and remains un-peer-reviewed. Absent harmonized protocols, auditors add 20%-30% to monitoring costs, eroding net carbon-credit value and slowing uptake among risk-averse growers.
*Our forecasts treat driver/restraint impacts as directional, not additive. The impact forecasts reflect baseline growth, mix effects, and variable interactions.
Europe Biochar Market Segment Analysis
By Technology:
Pyrolysis Dominates on Modularity and Feedstock FlexibilityPyrolysis controlled 75.06% of the 2025 Europe biochar market share, and its portion of the Europe biochar market size is forecast to grow at a 24.55% CAGR through 2031. Continuous-feed reactors such as PYREG’s P500 and P1500 process moisture-tolerant mixed residues at lower oxygen and temperature control requirements than gasifiers, slashing installation timelines to nine months and dropping per-ton capex by 28% between 2022 and 2025.
Gasification systems remain niche but appeal to integrated pulp, paper, and sawmill sites where syngas co-production offsets higher capex; Bussme Energy’s downdraft units in Sweden attain 85% thermal efficiency and attract mills targeting fossil fuel substitution. Hydrothermal carbonization and microwave pyrolysis remain at pilot scale due to high energy demand and limited feedstock compatibility. Regulatory regimes are technology-neutral, but pyrolysis plants have captured 92% of EBC certifications because of superior feedstock tolerance and consistent carbon stability.

By Application:
Animal Farming Leads, Industrial Uses AccelerateAnimal farming absorbed 75.99% of the 2025 volume within the Europe biochar market, leveraging feed inclusion at 1%-3% to curb enteric methane by up to 18% in dairy herds. Subsidized trials under Germany’s Farm to Fork roadmap enrolled 14,000 cattle and 87,000 pigs during 2024-2025, validating emissions and gut-health benefits.
Industrial uses, though a smaller slice of the Europe biochar market size, are growing at 26.10% CAGR as cement and steel producers face embedded-carbon levies from the EU Carbon Border Adjustment Mechanism starting in 2026. Heidelberg Materials’ 2024 kiln test cut clinker CO₂ intensity by 9% without sacrificing compressive strength and is slated for replication at three plants in 2026. Agricultural soil-amendment demand is steadily rising in drought-prone viticulture and horticulture, but high upfront costs still deter broad arable uptake.
Geography Analysis
Germany Biochar Market
Germany anchors the Europe biochar market size at 29.47% of 2025 volume and is on track for a 24.51% CAGR through 2031, propelled by federal subsidies, dense district-heating grids, and leadership in EBC certification. Municipal utilities source forestry and green-waste feedstocks locally, keeping delivered costs below EUR 45/t and enabling sub-EUR 200/t biochar production.
United Kingdom Biochar Market
The United Kingdom is a fast adopter as water utilities convert sewage sludge into phosphorus-rich char and as corporate buyers such as Lloyds Banking Group lock long-term carbon-credit agreements. Volume from sludge char is forecast to jump when the expected 2028 phosphorus-recovery mandate takes effect, expanding the UK share of the Europe biochar market to the high teens by 2031.
Broader European Markets
Nordic countries leverage integrated forestry complexes that supply low-cost residues and district-heating off-take, keeping feedstock costs near EUR 35/t. France shows robust momentum in organic viticulture and Eco-Scheme-backed cereals, yet national transposition delays of CMC14 temper full commercial rollout. Italy and Spain lag amid fragmented residue aggregation, but pilot olive-pomace projects could unlock 50-70 kt of annual capacity if logistics hubs mature post-2028.
Regulatory Landscape
EU policy has moved biochar from voluntary claims toward formal carbon-removal and product-market rules. In February 2026, the European Commission adopted the first set of methodologies under the Carbon Removals and Carbon Farming (CRCF) framework (Regulation 2024/3012), creating a voluntary certification pathway that explicitly covers Biochar Carbon Removal (BCR) and increases the bar for monitoring and verification tied to credit issuance and corporate procurement.
On the product side, EU Fertilising Products Regulation pathways, including CMC14 for biochar, continue to shape cross-border trade by conditioning market access on contaminant limits and documentation. In practice, industry certification remains a key compliance proxy, with the European Biochar Certificate (EBC) still used as an audit and quality anchor across European supply. The UK has also signaled intent to align British Standards Institution (BSI) greenhouse gas removal standards with CRCF to reduce divergence for operators and buyers active across Europe.
Value Chain Analysis
The value chain starts with feedstock sourcing and preprocessing from forestry residues, agricultural byproducts, and selected municipal streams (including sewage sludge where permitted), followed by conversion dominated by modular pyrolysis systems. Technology and project developers integrate reactors with existing biomass handling at sawmills, farms, municipal sites, and district-heating networks, producing biochar alongside co-products such as renewable heat, and in some configurations bio-oil or syngas that improve site economics.
Downstream, producers and distributors route certified material into agriculture and animal farming, while a growing share moves into industrial formulations for cement, concrete, and asphalt, plus uses such as landscaping and landfill cover. Carbon removal credits add a parallel commercialization layer through MRV, registries, and certification bodies, which affects product specification, traceability, and contracting structures across the chain.
Competitive Landscape
The Europe Biochar market is moderately fragmented. Vertically integrated strategies dominate: PYREG manufactures reactors and offers toll production; NOVOCARBO secures long-dated municipal feedstock contracts and co-locates at biomass power plants; Carbofex pairs pyrolysis with Finnish pulp-mill residues to lock sub-EUR 180/t costs. Smaller entrants leverage prepaid carbon-credit revenue to scale. The Europe biochar industry balances a maturing core of integrated incumbents, a pipeline of specialty-technology challengers, and a long tail of regional batch units confronting rising certification and feedstock reliability hurdles.
Europe Biochar Industry Leaders
-
Airex Energy
-
Carbofex Ltd
-
NOVOCARBO GMBH
-
PYREG GmbH
-
Sonnenerde GmbH
- *Disclaimer: Major Players sorted in no particular order
Europe Biochar Market Companies Covered in this Report
- Airex Energy
- Bussme Energy AB
- Carbofex Ltd
- Carbon Centric
- Carbon Finland Oy
- Carbon Gold Ltd
- CARBUNA
- CharLine GmbH
- Circular Carbon GmbH
- EGoS GmbH
- EOC Energy Ocean
- LUCRAT GmbH
- Nettenergy BV
- NOVOCARBO GMBH
- PYREG GmbH
- Sonnenerde GmbH
- Verora AG
Market Opportunities and Future Outlook
A near-term opportunity is scaling standardized, certifiable supply that can serve both agronomic demand and durable carbon-removal procurement. The CRCF methodologies adopted by the European Commission in February 2026 create a clearer compliance lane for Biochar Carbon Removal and strengthen incentives for producers that can document feedstock, process conditions, and end-use storage, which supports EBC-aligned production and traceability investment.
There is also visible whitespace in distributed production models that reduce biomass logistics penalties across fragmented residue regions. EU-funded demonstration activity supports this direction, including the EMBEDED project (active as of April 2026), which showcases modular biochar production using agricultural and forestry waste across Portugal, Ireland, Spain, and the Czech Republic. Industry capacity build-out adds another scale-up reference point, with Biochar Europe reporting 205 operational biochar production plants by end-2025 and total capacity of 361,000 tonnes, indicating room for developers to add local aggregation, mobile processing, and industrial off-take structures around heat, materials, and carbon-credit revenue stacking.
Recent Industry Developments in Europe Biochar Market
- June 2026: The European Commission adopted the first CRCF methodologies covering permanent carbon removals, including Biochar Carbon Removal, creating an EU-level voluntary certification framework. The requirements for monitoring and verification were elevated, encouraging suppliers to align production and documentation to recognized methodologies, which can influence project bankability and buyer procurement rules across Europe.
- May 2025: SUEZ and Airex Energy inaugurated the Carbonity industrial-scale biochar plant in Canada as a joint effort to convert residual biomass into biochar for soil regeneration and carbon sequestration. Although outside Europe, the commissioning highlights scale-up execution by a major European environmental services group and a technology partner tied to certification pathways, supporting credibility for comparable industrial deployments and offtake structures in European projects.
- May 2024: The International Biochar Initiative and the European-based Certified Sustainable Biochar Initiative merged their certification standards to align quality requirements across regions. Harmonized criteria reduce friction for producers selling into multiple markets and improve buyer confidence by narrowing specification variability for biochar used in agriculture, livestock, and industrial formulations.
Europe Biochar Market Report Scope and Research Methodology
Market Definition and Coverage
This market covers the volume of biochar supplied and used across Europe, counted as finished biochar output from commercial production and measured in tons for the stated year.
Scope exclusions: We exclude carbon credit prices, carbon removal certificate revenues, and the value of byproducts from pyrolysis units unless they are sold as biochar.
Segments Covered in This Report
- Technology
- Pyrolysis
- Gasification Systems
- Other Technologies
- Application
- Agriculture
- Animal Farming
- Industrial Uses
- Other Applications
- Geography
- Germany
- United Kingdom
- France
- Italy
- Spain
- Nordic Countries
- Turkey
- Russia
- Rest of Europe
Data Sources, Market Sizing, and Validation
Desk Research
For desk research, we ground the model in public data on where feedstock comes from, how much biomass is available, and what rules shape use in agriculture and industry. Core inputs include Eurostat (agriculture, forestry, waste, and energy statistics), European Commission and ECHA publications, European Biochar Certificate program materials, and the FAO database for regional biomass context.
In parallel, we review company annual reports, investor presentations, and reputable press coverage to track plant announcements, commissioning timelines, and typical production ranges. Where available, we also use paid subscriptions that provide standardized company financials and patent-intelligence to cross-check capacity claims and the stated technology focus. These desk sources are not exhaustive, and we used other public documents and datasets to validate assumptions and clarify gaps.
Primary Interviews and Surveys
Primary work was used to pressure-test desk assumptions on production yield, sellable biochar grades, and how volumes split across major end uses in Europe. We spoke with a mix of producers, equipment stakeholders, distributors, and large users, including agriculture input channels and industrial buyers, then re-checked country-level patterns through follow-up questions when responses did not align on output volumes or application types.
Distribution of primary research fieldwork respondents
| Company type | Respondent position |
|---|---|
| Top tier: 35% | CXOs: 16% |
| Mid tier: 48% | Functional/Unit leaders: 32% |
| Smaller Players: 17% | Managers: 52% |
Market-Sizing & Forecasting
Sizing starts with a top-down reconstruction of Europe biochar supply, where plant counts, nameplate capacity, and realistic utilization are translated into annual sellable output, then reconciled with observed demand pull. To keep the model practical, we run selective bottom-up checks, including sampling typical tons per plant by technology and comparing those results with channel feedback on volumes placed into key applications.
Market inputs include operating and announced plant capacity, feedstock availability by major residue types, yield ranges for pyrolysis outputs, the share of biochar meeting recognized quality standards, and adoption signals for application channels (for example, agricultural use tied to soil-improvement programs). For forecasting, we apply scenario analysis supported by short trend models, since additions depend heavily on commissioning timing and policy clarity, and experts help us choose realistic ramp-up curves rather than straight-line growth. Where plant-level details are missing, gaps are handled through conservative utilization bands that are tightened after interview validation and cross-checks against publicly reported capacity milestones.
Data Validation & Update Cycle
Outputs are checked through triangulation across independent signals, including installed capacity, commissioning news, and implied demand from main application areas. When a country-level result looks out of range, we review inputs, re-check unit conversions, and run variance checks against prior-year trends before sign-off.
Reports refresh annually, and interim updates are made when a material event changes model inputs, such as a large plant coming online or a regulation affecting agricultural use. Before delivery, an analyst performs a fresh pass on the latest public releases so clients receive an updated view that still follows the same repeatable steps.
Mordor Intelligence's Europe Biochar Market Sizing Compared With Other Published Estimates
Published biochar figures for Europe often do not match because some sources describe plant capacity, others focus on carbon removal volumes, and some report market value instead of physical output. Differences also arise when the base year shifts, when exchange rates are applied differently, or when average selling price assumptions are mixed into a volume model.
In a refresh-led workflow, year labels and conversions are re-checked close to release. Validation relies on capacity and utilization checks that keep the count tied to sellable biochar output, which is how Mordor Intelligence reports this market.
Benchmark comparison
| Source | Market Size | Gaps in Research Methodology |
|---|---|---|
| Mordor Intelligence | USD 168.77 M (2025) | |
| Industry Association A | USD 361.00 M (2025) | This figure is presented as combined production capacity and is not the produced and sold volume in the year, so it can read higher than an output-based market size. |
| Trade Journal B | USD 40.00 M (2040) | This estimate is a long-range scenario for durable carbon removal and is not a near-term market measure, so the scope and time horizon are not comparable. |
The comparison shows that the main spread comes from mixing capacity or long-term carbon removal scenarios with annual market output. By keeping the measurement basis consistent and by reconciling production assumptions with real-world operating signals, the final number stays traceable to clear variables that can be reviewed and updated year after year.
Key Questions Answered in the Report
How fast is the Europe biochar market expected to grow to 2031?
It is forecast to expand from 207.67 kilotons in 2026 to 610.05 kilotons in 2031 at a 24.05% CAGR.
Which technology leads current production?
Modular pyrolysis reactors held 75.06% of 2025 volume due to feedstock flexibility and faster installation.
Why does animal farming dominate demand?
Livestock producers use biochar feed additives to cut methane up to 18% and qualify for carbon credits, accounting for 75.99% of 2025 volume.
Which countries are scaling the fastest?
Germany remains largest, while the United Kingdom and Nordic nations show the highest near-term growth as they deploy sewage-sludge and forestry-linked projects.
What restrains wider agricultural use today?
High feedstock logistics costs and the lack of EU-wide agronomic field-rate guidelines both increase risk for conventional crop farmers.