
Market Overview
| Study Period | 2021 - 2031 |
|---|---|
| Forecast Data Period | 2026 - 2031 |
| Base Year Market Size (2025) | USD 20.69 Billion |
| Market Size (2026) | USD 24.22 Billion |
| Market Size (2031) | USD 52.72 Billion |
| Growth Rate (2026 - 2031) | 16.84 % |
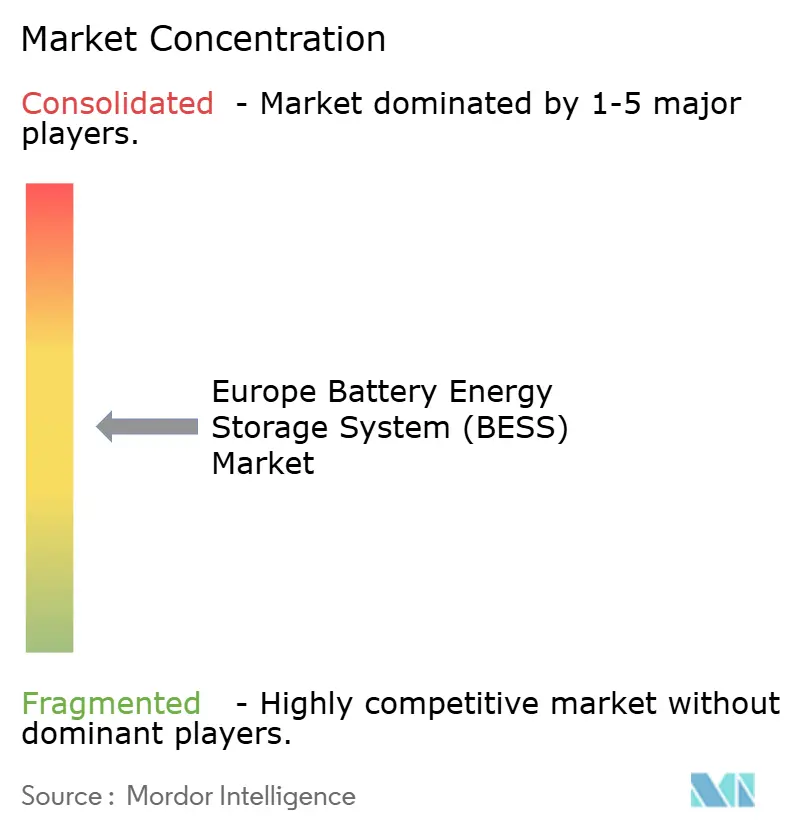
| Market Concentration | Medium |
Major Players *Disclaimer: Major Players sorted in no particular order Image © Mordor Intelligence. Reuse requires attribution under CC BY 4.0. | |
Europe Battery Energy Storage System (BESS) Market Analysis by Mordor Intelligence
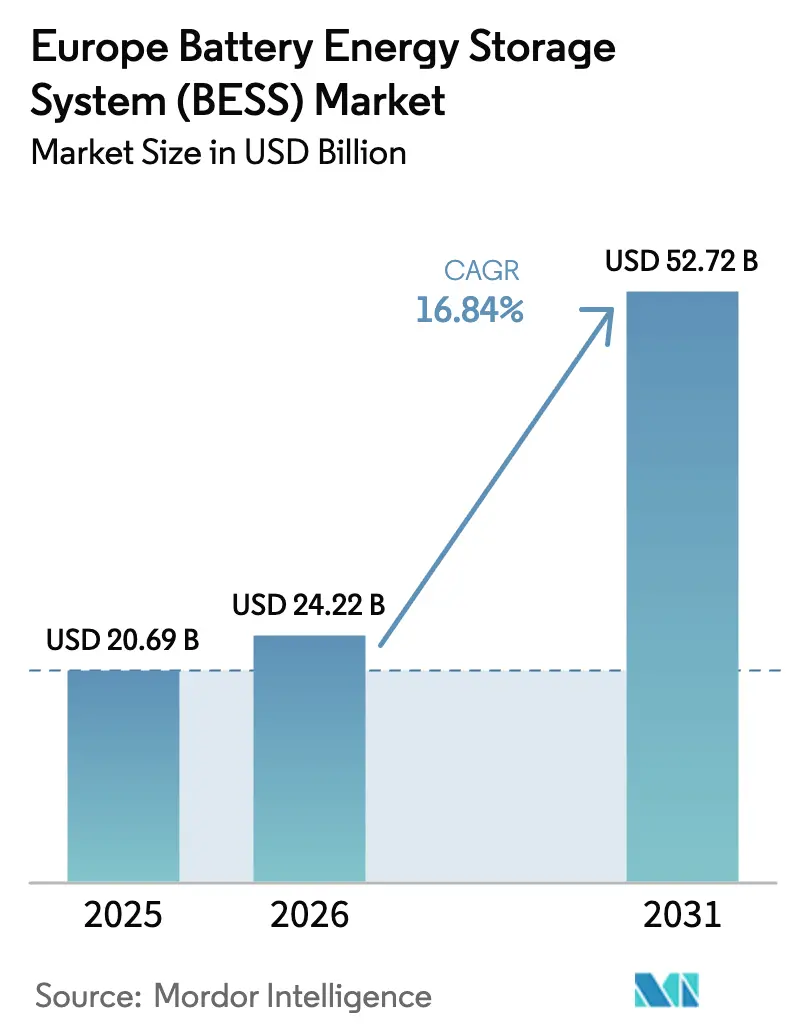
The Europe Battery Energy Storage System (BESS) market size is projected to expand from USD 20.69 billion in 2025 and USD 24.22 billion in 2026 to USD 52.72 billion by 2031, reflecting a 16.84% CAGR and confirming investor confidence in long-duration grid flexibility solutions. This growth curve aligns with the European Commission mandate that 30% of balancing reserves must come from non-fossil assets by 2030, encouraging utilities to substitute gas peakers with batteries.[1] Revenue certainty has improved as competitive capacity and fast-reserve auctions in the United Kingdom and Italy compress payback periods below seven years, drawing pension funds and infrastructure specialists into the European Battery Energy Storage Systems market. Technology mix continues to favor lithium-iron-phosphate cells thanks to cycle-life advantages, although flow chemistries are gaining traction where duration exceeds four hours. Industrial clusters in Germany, Spain, and the Nordic countries are deploying hybrid solar-plus-storage projects to hedge against grid-connection delays that now average 36 months, while residential prosumers monetize time-of-use spreads that widened to EUR 0.26–0.36 per kWh in late 2025.
Key Report Takeaways
- By battery type, lithium-ion commanded 87.8% of the European Battery Energy Storage Systems market share in 2025; flow batteries are forecast to expand at a 28.3% CAGR through 2031.
- By connection type, on-grid installations accounted for 85.5% of the European Battery Energy Storage Systems market size in 2025, while off-grid systems are projected to grow at 28.9% to 2031.
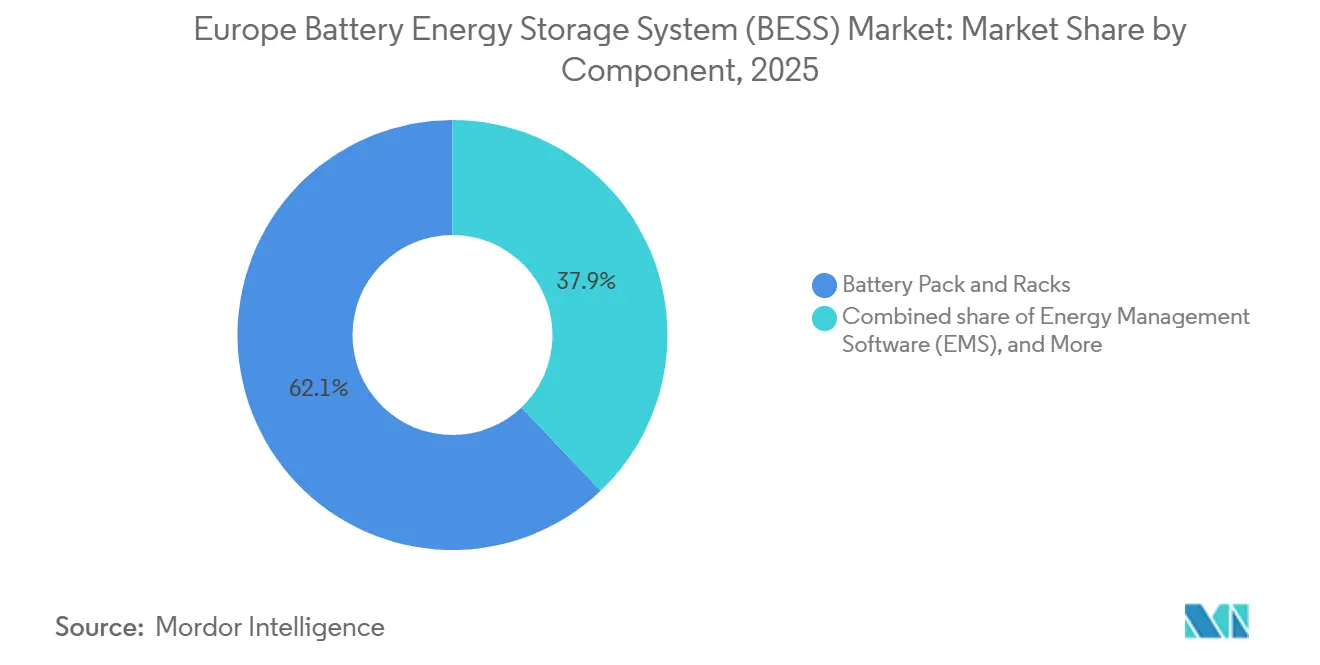
- By component, battery packs and racks represented 62.1% of total system value in 2025; energy-management software is advancing at a 31.4% CAGR through 2031.
- By energy capacity, systems in the 10–100 MWh band held 47.3% of deployments in 2025, whereas projects above 500 MWh will expand at a 30.1% CAGR through 2031.
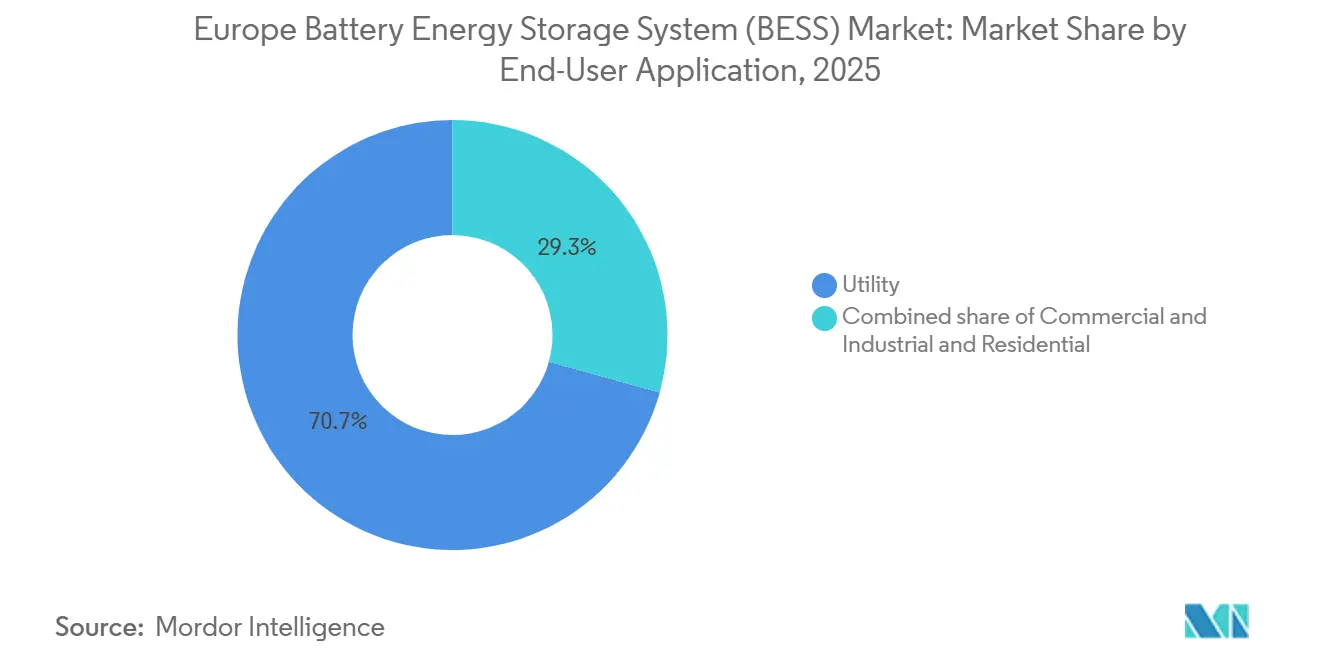
- By end-user, utilities captured 70.7% of demand in 2025; commercial and industrial users are forecast to post a 29.5% CAGR to 2031.
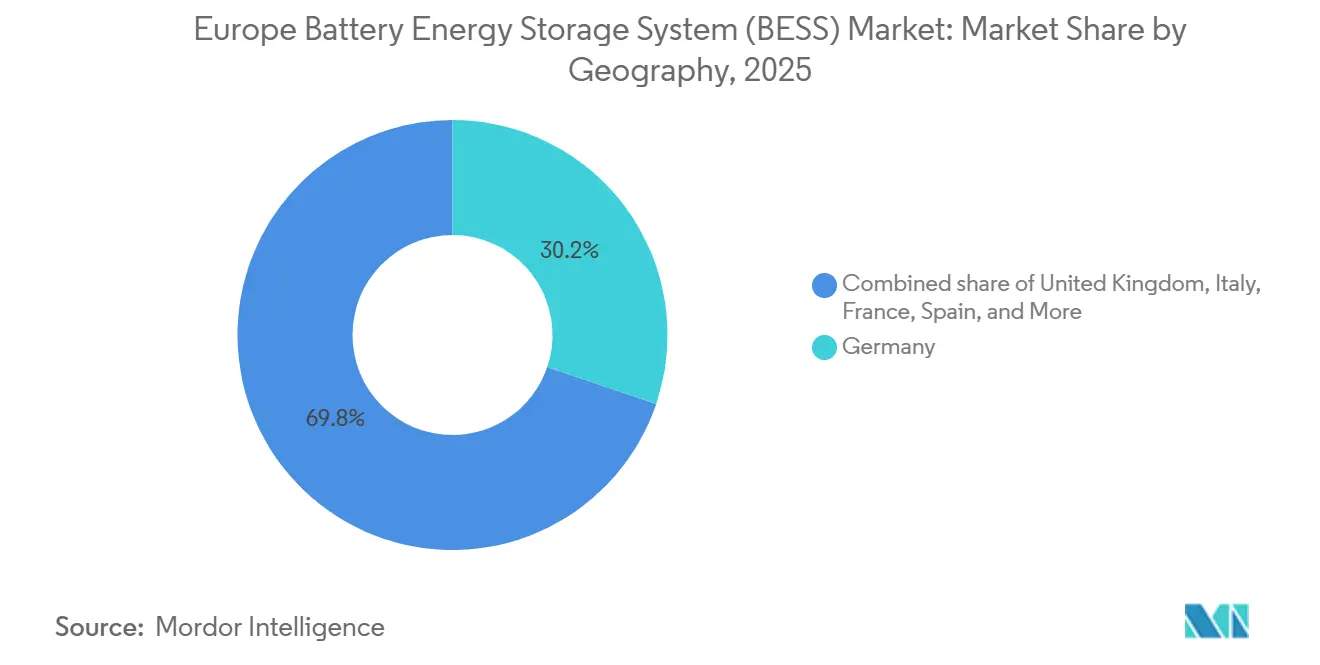
- By geography, Germany led with a 30.2% share of the European Battery Energy Storage Systems market in 2025, while the United Kingdom is expected to grow at a 22.2% CAGR through 2031.
Note: Market size and forecast figures in this report are generated using Mordor Intelligence’s proprietary estimation framework, updated with the latest available data and insights as of January 2026.
Europe Battery Energy Storage System (BESS) Market Trends and Insights
Drivers Impact Analysis*
| Driver | (~) % Impact on CAGR Forecast | Geographic Relevance | Impact Timeline |
|---|---|---|---|
| EU-wide Fit-for-55 Flexibility Mandates Accelerating BESS Procurement | 3.2% | EU-wide, strongest in Germany, Netherlands, Belgium | Medium term (2-4 years) |
| Residential Prosumer Tariff-Arbitrage Amid Record-High Retail Prices | 2.8% | Germany, Denmark, Belgium, Ireland | Short term (≤ 2 years) |
| National Capacity & Fast-Reserve Auctions Creating Bankable Revenue Stacks | 3.5% | United Kingdom, Italy, France | Medium term (2-4 years) |
| Germany's Smart-Meter Roll-out Unlocking Behind-the-Meter Aggregation | 2.1% | Germany, with spillover to Austria, Switzerland | Long term (≥ 4 years) |
| Corporate PPA Boom Driving Co-located BESS with Utility-Scale Renewables | 2.9% | Spain, Nordic countries, Poland | Medium term (2-4 years) |
| Accelerated De-Risking of Li-ion Supply via EU Battery Passport & Critical-Mineral Acts | 1.9% | EU-wide, manufacturing hubs in France, Germany, Sweden | Long term (≥ 4 years) |
| Source: Mordor Intelligence | |||
EU-Wide Fit-for-55 Flexibility Mandates Accelerating BESS Procurement
The directive requires each member state to source at least 30% of balancing reserves from non-fossil resources by 2030, providing a structural demand floor for the European Battery Energy Storage Systems market. Battery projects now pre-qualify for automatic frequency restoration tenders that formerly went to hydro and gas assets, shortening payback periods below seven years in Germany and the Netherlands.[2] Developers are racing to secure connection agreements ahead of expected queue reforms, while transmission operators add interim targets that further pull forward investment decisions.
Residential Prosumer Tariff-Arbitrage Amid Record-High Retail Prices
Retail electricity prices averaged EUR 0.41 per kWh in late 2025 in Germany, creating a spread of EUR 0.26–0.36 versus day-ahead wholesale prices.[3] This margin underpins eight-to-ten-year payback periods for 10 kWh home systems even without feed-in tariffs. More than 60% of German residential batteries now use algorithms that charge during negative-price hours, which occurred 300 times in 2025, and discharge during evening peaks.
National Capacity & Fast-Reserve Auctions Creating Bankable Revenue Stacks
The February 2025 U.K. Capacity Market awarded 1.8 GW of battery contracts at GBP 63 per kW per year, while National Grid committed to 4.5 GW of exclusive battery fast-reserve procurement by 2028.[4] Italy and France introduced similar mechanisms, enabling lenders to underwrite 12% blended IRRs on multi-layered revenue stacks.
Germany’s Smart-Meter Roll-out Unlocking Aggregation of Behind-the-Meter Storage
Mandatory smart meters for high-consumption households allow aggregators to pool residential batteries into virtual power plants, providing real-time telemetry that meets market participation rules. Platforms operated by Next Kraftwerke and Sonnen already offer over 50,000 aggregated batteries to day-ahead and balancing markets.
Restraints Impact Analysis*
| Restraint | (~) % Impact on CAGR Forecast | Geographic Relevance | Impact Timeline |
|---|---|---|---|
| Grid-Connection Queues and Limited Interconnection Capacity | -2.7% | Germany, Spain, United Kingdom | Short term (≤ 2 years) |
| Volatile Ancillary-Service Prices Undermining Project IRRs | -1.9% | Germany, Netherlands, Nordic countries | Medium term (2-4 years) |
| Fire-Safety & Urban-Zoning Rules Raising Capex for Dense Cities | -1.4% | Germany, United Kingdom, France (urban cores) | Long term (≥ 4 years) |
| Reliance on Chinese Cell Imports Exposing Projects to FX & Trade-Policy Risk | -1.6% | EU-wide, acute in Southern and Eastern Europe | Medium term (2-4 years) |
| Source: Mordor Intelligence | |||
Grid-Connection Queues and Limited Interconnection Capacity
Germany’s queue exceeded 100 GW by end-2025, stretching wait times to 36 months and eroding project NPVs by up to 20%. Spain and the United Kingdom face similar constraints, prompting the U.K. grid operator to adopt a first-ready approach that favors shovel-ready applications.
Volatile Ancillary-Service Prices Undermining Project IRRs
Germany’s frequency containment reserve prices fell from EUR 8,500 per MW per month in early 2024 to EUR 3,200 by mid-2025 as 3 GW of new batteries saturated a 600 MW market. Comparable swings in the Netherlands and Nordic zones force developers to hedge revenues with more complex contracts, raising transaction costs.
*Our forecasts treat driver/restraint impacts as directional, not additive. The impact forecasts reflect baseline growth, mix effects, and variable interactions.
Segment Analysis
By Battery Type: Flow Chemistries Gain Duration Edge
Lithium-ion held 87.8% of installed capacity in 2025, giving the segment the dominant Europe Battery Energy Storage Systems market share. Flow batteries, expanding at a 28.3% CAGR, appeal to grid operators that need 6–10 hour discharge profiles and wish to avoid lithium cost escalations. Sodium-ion and lithium titanate technologies are entering pilot phases for specific resilience or temperature-tolerant applications. Overall, chemistry diversification is likely to cap lithium’s share below 80% by 2031, even as absolute lithium volume continues to rise.
The European Battery Energy Storage Systems market size for flow chemistries is expected to surpass USD 4 billion by 2031, supported by vendor-financed warranties exceeding 20 years. Utility preference for multi-hour assets aligns with interconnection upgrades that favor fewer, longer-duration systems, while corporate buyers value the environmental credentials embedded in vanadium recycling chains.


By Connection Type: Off-Grid Surge Offsets On-Grid Dominance
On-grid assets accounted for 85.5% of capacity in 2025, reflecting mature grid-service revenue models. Off-grid and hybrid microgrids will advance at a 28.9% CAGR, carving new demand pools inside industrial campuses and island communities. The European Battery Energy Storage Systems market size tied to off-grid mining operations already exceeds USD 1 billion, highlighted by Wärtsilä’s 10 MW Swedish microgrid that delivered 40% savings in 2025.
As grid queues lengthen, data-center operators and chemical producers are securing off-grid permits that bypass transmission interconnection. Hybrid plants capable of islanding during outages support resilience mandates and reduce network charges that can reach EUR 150 per kW yearly in Germany.
By Component: Software Emerges as Value Driver
Battery packs captured 62.1% of system cost in 2025, yet price competition among Asian cell makers is squeezing margins and shifting value toward control software. Energy-management platforms are growing at 31.4% as asset owners seek to optimize hourly bids across multiple markets, lifting revenue by as much as 25% relative to static dispatch. The European Battery Energy Storage Systems market share attributable to software and analytics is poised to double by 2031.
Fire-safety and HVAC subsystems now add EUR 50–80 per kWh in dense urban jobs because of Germany’s VDE-AR-E 2510-50 and the United Kingdom’s BS 5839-1 standards. Vendors that can integrate these requirements into factory-built enclosures gain schedule and cost advantages.
By Energy Capacity Range: Bigger Blocks, Lower Unit Cost
Systems between 10 and 100 MWh held a 47.3% share in 2025, favored for permitting agility. However, assets above 500 MWh will expand at 30.1% through 2031 as transmission operators prefer fewer interconnection nodes that simplify grid-code compliance. Fluence’s 500 MWh Schleswig-Holstein plant illustrates how large-scale systems can stack frequency, capacity, and arbitrage income under a single grid agreement.
In contrast, sub-10 MWh residential and small-commercial units will keep growing where retail-wholesale spreads exceed 3:1. This bifurcation creates unique service niches for integrators specializing either in distributed fleets or in giga-scale turnkey projects.
By End-User Application: C&I Momentum Builds
Utilities dominated demand with a 70.7% share in 2025, but commercial and industrial buyers are growing at 29.5% on the back of Scope 2 reporting rules and demand-charge pressures. The Europe Battery Energy Storage Systems market size linked to data centers will climb sharply as Amazon and other hyperscalers commit to 24/7 carbon-free energy targets.
Industrial companies in chemicals, steel, and cement deploy behind-the-meter batteries to shave peak-network fees and participate in demand response. Residential uptake remains strongest in Germany, Belgium, and Denmark, where time-of-use tariffs favor daily cycling.
Geography Analysis
Germany held a 30.2% share of the European Battery Energy Storage Systems market in 2025, underpinned by EUR 0.41 per kWh retail tariffs and a 2 GW annual auction schedule that provides long-term revenue visibility. Smart-meter mandates enable aggregators to pull household batteries into wholesale and balancing markets, yet grid-connection queues above 100 GW extend commissioning times beyond three years, eroding returns.
The United Kingdom is the fastest expanding market with a 22.2% forecast CAGR to 2031, powered by 15-year Capacity Market contracts and National Grid’s 4.5 GW battery fast-reserve target. Italy follows as Terna reserves 2 GW of ultra-fast frequency response for storage, offering EUR 12,000 per MW per month payments that layer onto wholesale arbitrage.
France and Spain scale deployments alongside solar and wind pipelines. Spain’s 8 GW solar-storage queue is concentrated in Extremadura and Andalusia, where corporate PPAs pre-contract the majority of output, mitigating merchant risk. Nordic countries adopt hybrid wind-battery assets that lower balancing costs by 40% and suit cold-weather sodium-ion trials, while Poland emerges with a 3 GW pipeline aimed at manufacturing off-takers.
Regulatory Landscape
The EU Battery Regulation (EU) 2023/1542 continues to define core compliance requirements for stationary storage placed on the EU market, covering sustainability, labeling, and end-of-life obligations. In November 2025, Implementing Regulation (EU) 2025/2289 further standardized waste-battery data reporting, which raises traceability and documentation demands for integrators, EPCs, and operators.
Beyond product compliance, the European Commission has reinforced flexibility policy, including the mandate that 30% of balancing reserves must come from non-fossil assets by 2030, supporting batteries as eligible resources in balancing procurement. Grid integration and technical requirements are also tightening as transmission-system operators prepare for higher shares of inverter-based resources. ENTSO-E published a Phase II technical report on grid-forming requirements in November 2025, feeding into evolving European network-code work (NC RfG 2.0) that would require storage modules to provide grid-forming capability in both infeed and consumption modes, which raises the bar for PCS and control-software specifications. On permitting and deployment frictions, the European Commission issued guidance in January 2026 linked to Article 15e of the Renewable Energy Directive to facilitate designated areas and streamline environmental permitting for grid and storage infrastructure. Battery due-diligence timelines were updated via Regulation (EU) 2025/1561, with certain provisions applying from 26 July 2026.
Competitive Landscape
The top five integrators, Fluence, Tesla, Wärtsilä, BYD, and Hitachi Energy, controlled roughly 48% of contracted gigawatt-hours in 2025, positioning the European Battery Energy Storage Systems market at moderate concentration. Fluence leverages its Mosaic optimizer to raise asset revenues by up to 25%, embedding long-term service agreements that stabilize cash flow. Tesla benefits from vertically integrated Megapack manufacturing at its Berlin-Brandenburg site, lowering capex and pairing Autobidder software with lithium-iron-phosphate cells.
Wärtsilä competes in off-grid mining and island microgrids, offering black-start capability that commands premium pricing. BYD opened a Rotterdam hub in 2025 to ship 5 GWh annually under 15-year warranties, while Hitachi Energy integrates digital twins for grid-forming inverters. Niche providers such as Invinity focus on durations beyond six hours using vanadium flow technology, and aggregators like Next Kraftwerke monetize residential fleets without owning hardware.
Price pressure intensifies as Chinese cell suppliers move downstream into turnkey EPC, while new European gigafactories from Northvolt and ACC supply low-carbon cells that qualify projects for sustainable finance. Patent filings around thermal-management and fire-suppression modules are rising, reflecting tougher urban safety rules that add EUR 50–80 per kWh in dense city projects.
Europe Battery Energy Storage System (BESS) Industry Leaders
-
Fluence Energy Inc.
-
Tesla Inc.
-
BYD Co. Ltd.
-
LG Energy Solution Ltd.
-
Wärtsilä Oyj Abp
- *Disclaimer: Major Players sorted in no particular order
Market Opportunities and Future Outlook
Utility-scale projects are shifting toward larger multi-hundred-megawatt blocks and multi-year offtake structures, creating clearer opportunities for turnkey delivery, grid-forming capable PCS, and long-term O&M and optimization software. The 2026 project pipeline in Europe shows both scale and diversification, including the Klostermansfeld 1,000 MW/5,700 MWh project in Germany entering execution in July 2026, the Green Turtle 700 MW/2,800 MWh project in Belgium securing EUR 450 million in financing in July 2026, and the Vopak 200 MW/800 MWh project in Oosterhout, Netherlands advancing toward formal FID in July 2026.
Policy mechanisms are also creating financing pathways. The Battery Booster Facility, established by the European Commission via Decision (EU) 2026/1283 in June 2026, creates investable routes to de-risk supply chains and support sustainable finance access for European projects. Vendors that can certify compliant inverter controls and deliver validated grid-service performance are well placed to win tenders and framework agreements that favor repeatable, large-scale deployments.
Recent Industry Developments
- July 2026: Greenvolt Power signed an agreement with BYD Energy Storage for the 600 MW/2.4 GWh Siedlce BESS project in Poland. The deal ties a large European IPP pipeline to a major battery supplier for a single-site project sized for capacity-market participation and grid services. It also underscores the shift toward long-duration (multiple-hour) configurations in Central and Eastern Europe as flexibility needs expand.
- June 2026: European Commission established the Battery Booster Facility via Decision (EU) 2026/1283 to support battery cell manufacturing ramp-up. The program complements efforts to reduce supply-chain risk for European projects and to improve access to sustainable finance.
- May 2025: Switzerland authorized an 800 MW/1,600 MWh redox-flow plant in Laufenburg, marking a record-scale approval for the technology. The decision provided a high-visibility reference point for non-lithium long-duration storage in Europe and supports bankability discussions around multi-hour discharge applications.
Research Methodology Framework and Report Scope
Market Definition and Coverage
For this study, the Europe battery energy storage system market covers revenues from stationary battery-based systems installed to store electricity and discharge it later for grid services or on-site backup, including the main system components and related controls.
Scope exclusions: We exclude traction batteries used in vehicles and non-battery storage such as pumped hydro.
Segmentation Overview
- By Battery Type
- Lithium-ion (Lithium Iron Phosphate (LFP), Nickel-Manganese-Cobalt (NMC), Lithium Titanate (LTO))
- Lead-acid
- Flow Battery (Vanadium Redox, Zinc-Bromine)
- Sodium-ion
- Other Battery Technologies (NiCd, Hybrid Super-capacitors)
- By Connection Type
- On-Grid (Utility Interconnected)
- Off-Grid (Micro-Grid, Hybrid)
- By Component
- Battery Pack and Racks
- Power Conversion System (PCS)
- Energy Management Software (EMS)
- Balance-of-Plant and Services
- By Energy Capacity Range
- Below 10 MWh
- 10 to 100 MWh
- 100 to 500 MWh
- Above 500 MWh
- By End-user Application
- Utility
- Commercial and Industrial
- Residential
- By Geography
- Germany
- United Kingdom
- Italy
- France
- Spain
- Nordic Countries (Norway, Sweden, Denmark, Finland)
- Rest of Europe
Data Sources, Market Sizing, and Validation
Desk Research
Desk research was used to establish the factual base for the model, and then it was used again to check whether country-level trends were internally consistent. We reviewed public energy statistics and policy signals that influence storage demand, including publications from the International Energy Agency (IEA), Eurostat, and the European Commission. Grid and power-system context was taken from sources such as ENTSO-E, and clean-energy deployment context was checked using sources such as IRENA.
To translate the story into a usable market model, we also used public company reports such as annual reports, presentations, and project announcements, supported by reputable press coverage and association websites. Patent databases were referenced in a limited way to understand technology direction and cost trajectories. We also used a paid subscription source for company financials and intelligence to standardize revenue mapping and reduce missing data for private participants. These desk sources are illustrative, and many other public documents were reviewed to collect, validate, and clarify data points.
Primary Interviews and Surveys
Primary work was used to pressure-test the desk assumptions and to correct gaps where public data is not detailed enough, particularly around system pricing, project timelines, and how revenues get booked across integrators and component suppliers. We spoke with a mix of utilities, storage project developers, EPC and system integration teams, and battery supply chain functions, then validated the findings across key European markets and the wider region to avoid over-weighting any single country's buildout pattern.
Distribution of primary research fieldwork respondents
| Company type | Respondent position |
|---|---|
| Top tier: 34% | CXOs: 12% |
| Mid tier: 51% | Functional/Unit leaders: 36% |
| Smaller Players: 15% | Managers: 52% |
Market-Sizing & Forecasting
Market size was built using a top-down reconstruction that starts from the regional storage buildout and grid-flexibility needs, then converts those signals into annual system revenues using price and mix assumptions. The model is anchored on country-level deployment momentum, and totals are checked against selective bottom-up views such as sampled project pricing, known project pipelines, and supplier and integrator revenue indicators, so the overall number stays realistic.
Inputs that were tracked (illustrative) include annual BESS additions by application (front-of-the-meter and behind-the-meter), average system pricing per kWh and per kW, installed duration mix (for example, 1 to 2 hour versus longer duration), battery chemistry preference shifts, and interconnection and market rule changes that affect project bankability. Where direct price series were not consistently available, ranges from interviews were used and then normalized to a single currency timing for the base year.
Forecasts were produced using scenario analysis, since grid-services revenues, permitting pace, and renewable buildout can change quickly due to policy and wholesale price signals. In each scenario, the same variable set is advanced forward, and expert feedback is used to keep adoption rates and price declines aligned with what buyers and suppliers are reporting. Any gaps in country coverage were handled by using comparable market proxies based on power demand, renewable penetration, and announced storage targets, followed by a final sanity check at the regional level.
Data Validation & Update Cycle
Results are validated through triangulation across demand signals, supply-side revenue indicators, and market rule realities, then key assumptions are rechecked before sign-off. We look for anomalies such as sudden price jumps, deployment spikes that do not align with permitting and grid-connection capacity, or country totals that conflict with published energy statistics, and these are reviewed in a second analyst pass.
Reports are refreshed annually, and interim updates are triggered when material events occur, such as major policy revisions, a sharp change in battery prices, or large auction outcomes that alter near-term deployments. Before delivery, a final review is completed so the dataset and narrative reflect the latest publicly available signals and any recent expert feedback.
Mordor Intelligence's Europe Battery Energy Storage System Market Size Compared Against Other Published Estimates
It is normal to see different published market sizes for Europe battery energy storage systems, even when the topic sounds similar. The differences usually come from what is counted as a system, how geographies are treated as Europe, and whether the numbers reflect only new installations or also include broader supply chain revenues.
Some published figures fold in non-battery energy storage technologies or count EV battery demand as part of the storage opportunity, which pushes the total upward. In Mordor Intelligence, the count is limited to stationary, grid-connected battery energy storage system revenues in Europe, and it is validated using deployment signals, application mix (front-of-the-meter versus behind-the-meter), and interview-based pricing ranges that are refreshed with current-year currency timing.
Benchmark comparison
| Source | Market Size | Gaps in Research Methodology |
|---|---|---|
| Mordor Intelligence | USD 24.22 B (2026) | |
| Industry Advisory A | USD 58.00 B (2025) | Uses a broader energy storage definition that appears to include non-battery storage and additional value chain revenues, which inflates the market compared with system-only counting. |
| Research Publisher B | USD 25.00 B (2024) | Uses an earlier base year and commonly mixes booked revenues with announced pipeline value, and it can apply different average system price assumptions by application. |
Taken together, the spread is mainly explained by scope and timing. When technology types outside BESS or adjacent battery demand streams are included, totals rise quickly, and when pipeline value is blended into realized sales, the jump can look even larger. By keeping the model tied to clear deployment and pricing inputs that can be rechecked each year, the estimate stays easier to follow and repeat.
Key Questions Answered in the Report
How large is the Europe Battery Energy Storage Systems market in 2026?
The market is valued at USD 24.22 billion in 2026 and is forecast to reach USD 52.72 billion by 2031.
What CAGR is expected for battery storage deployments in Europe to 2031?
The market is projected to grow at a 16.84% CAGR over the 2026-2031 period.
Which battery chemistry leads European deployments?
Lithium-ion dominates with 87.8% installed share in 2025, though flow batteries are the fastest growing.
Why are corporate PPAs important for storage growth?
35% of European corporate PPAs now require co-located batteries to guarantee minimum delivery factors and manage imbalance risk.
What challenges do developers face when connecting new projects?
Grid-connection queues above 100 GW in major markets and evolving safety standards add delays and extra capex.
Which country is the fastest growing European battery market?
The United Kingdom is projected to expand at 22.2% through 2031, driven by long-term capacity and fast-reserve contracts.