
Europe Amusement Park Market Size and Share
Market Overview
| Study Period | 2020 - 2031 |
|---|---|
| Forecast Data Period | 2026 - 2031 |
| Base Year Market Size (2025) | USD 27.09 Billion |
| Market Size (2026) | USD 28.33 Billion |
| Market Size (2031) | USD 35.47 Billion |
| Growth Rate (2026 - 2031) | 4.58 % |
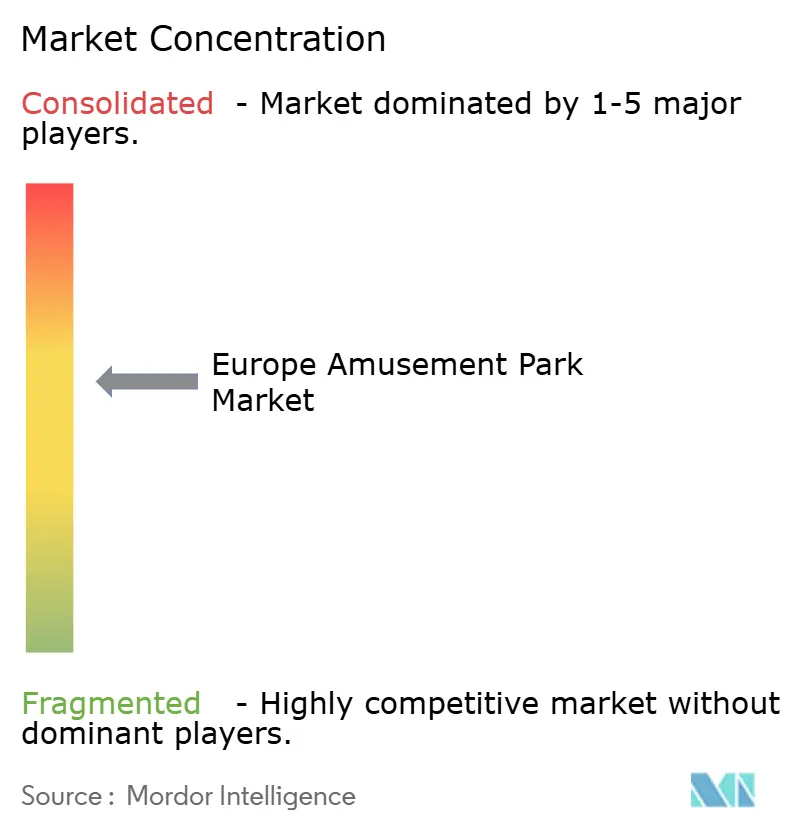
| Market Concentration | Medium |
Major Players *Disclaimer: Major Players sorted in no particular order Image © Mordor Intelligence. Reuse requires attribution under CC BY 4.0. | |
Europe Amusement Park Market Analysis by Mordor Intelligence
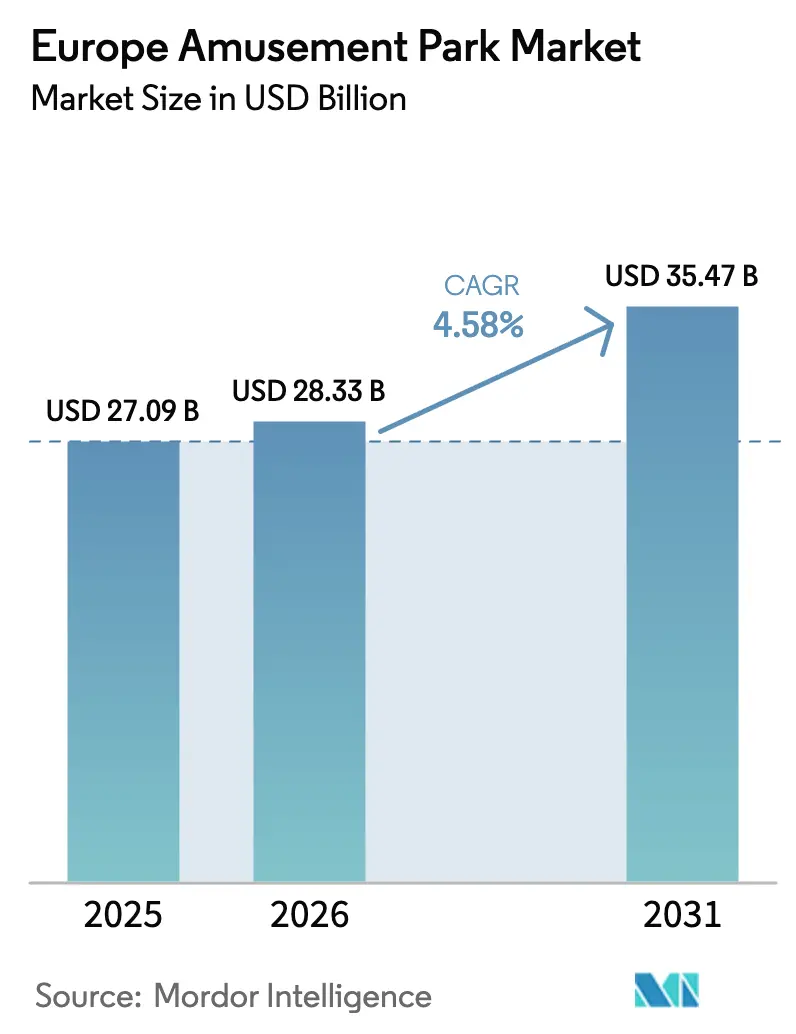
The Europe amusement park market size is expected to grow from USD 27.09 billion in 2025 to USD 28.33 billion in 2026 and is forecast to reach USD 35.47 billion by 2031 at 4.58% CAGR over 2026-2031. Recovery momentum reflects higher household leisure budgets, the steady return of long-haul tourists, and park operators’ rapid embrace of immersive intellectual-property (IP) theming that commands premium pricing [1]. E-ticketing, AI-based queue management, and 5G-enabled interactive content are further raising per-capita spending while lowering crowd-flow bottlenecks, allowing the Europe amusement park market to grow without proportionate capacity additions. Mechanical rides still headline marketing campaigns, but operators are expanding water attractions, themed hotels, and indoor “retail-tainment” micro-parks to hedge weather risk and seasonality. Competitive intensity is moderate: the top five groups control roughly 60% revenue, yet expansion by Universal in the United Kingdom and Disney in France is set to raise capital requirements and favor scale players. Regulatory costs tied to carbon reduction and insurance premiums remain headwinds, but the Europe amusement park market continues to benefit from experiential tourism, dynamic pricing systems, and multi-day destination strategies that diversify revenue.
Key Report Takeaways
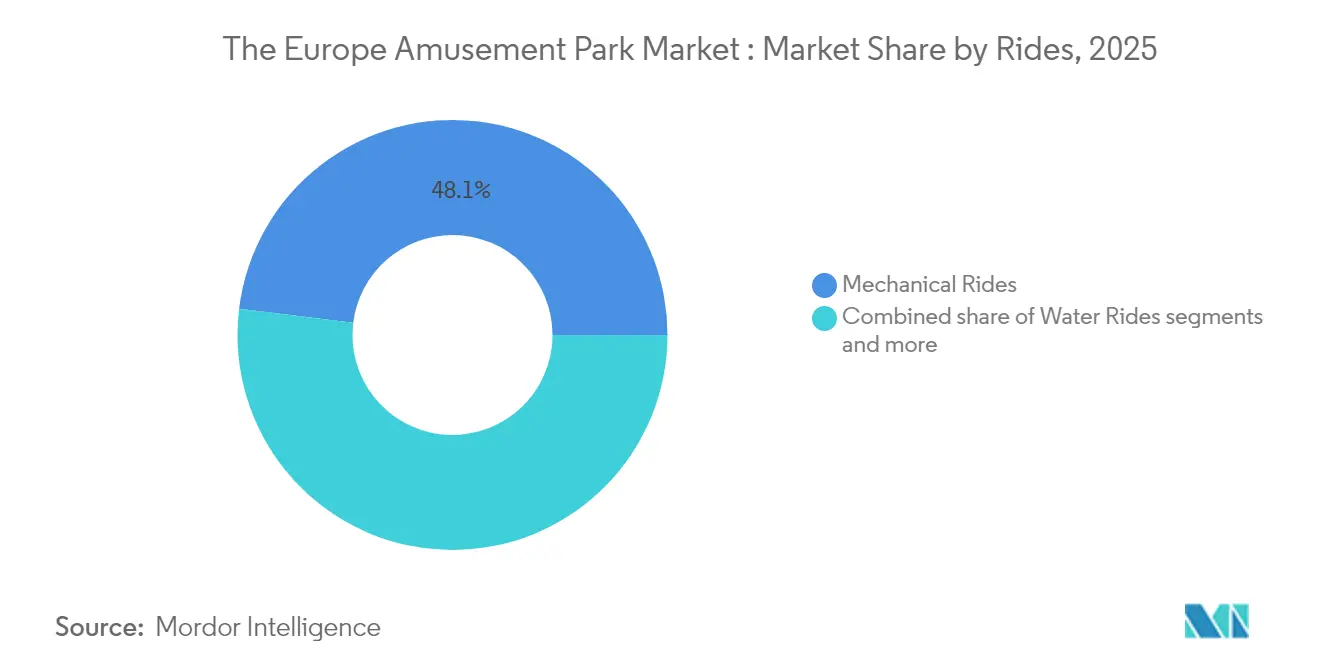
- By rides, mechanical attractions led with 48.05% of Europe amusement park market share in 2025, water attractions are projected to advance at a 7.12% CAGR through 2031.
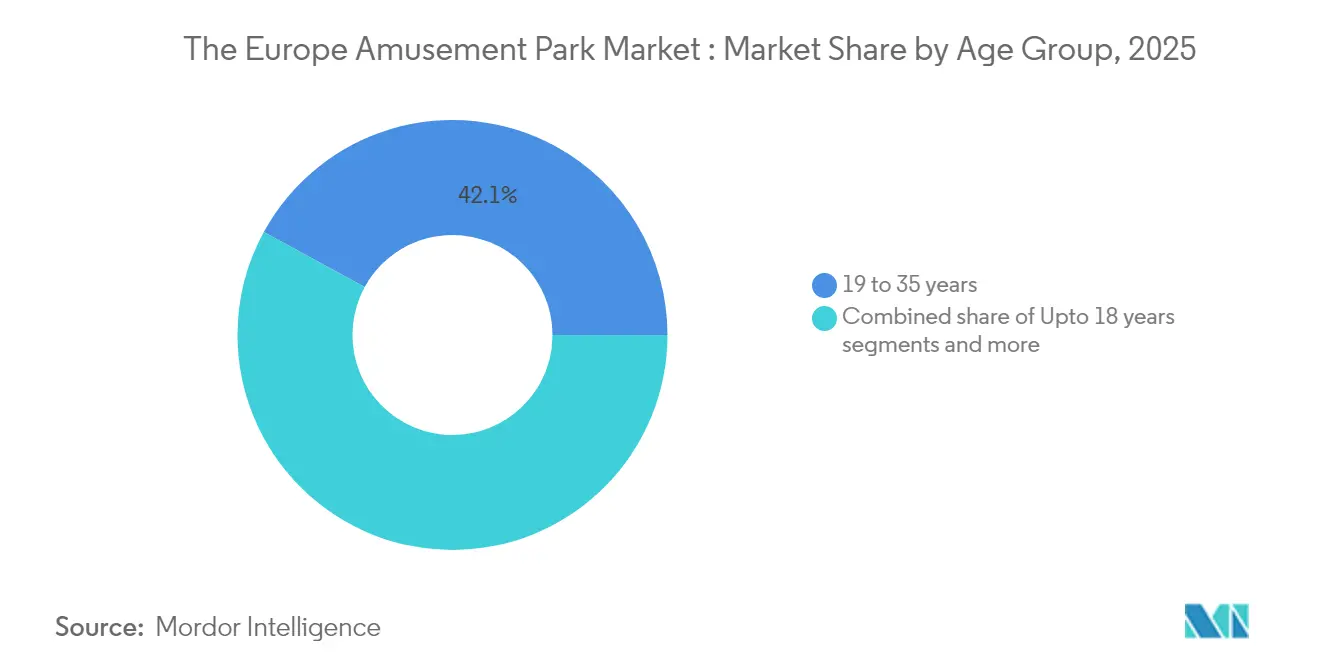
- By age group, visitors aged 19-35 years held 42.05% of Europe amusement park market size in 2025 and the up-to-18 segment is forecast to grow at a 6.74% CAGR to 2031.
- By revenue source, tickets captured 54.85% of Europe amusement park market share in 2025 and hotels and resorts are poised to post a 9.98% CAGR over the same period.
- By country, Germany accounted for 17.29% of Europe amusement park market share; Spain is expected to expand at a 6.98% CAGR to 2031.
Note: Market size and forecast figures in this report are generated using Mordor Intelligence’s proprietary estimation framework, updated with the latest available data and insights as of 2026.
Europe contributes to a system defined not by any single geography but by the interaction of many. The global amusement parks market data by Mordor Intelligence represents that combined structure.
Europe Amusement Park Market Trends and Insights
Drivers Impact Analysis*
| Driver | (~) % Impact on CAGR Forecast | Geographic Relevance | Impact Timeline |
|---|---|---|---|
| Surge in experiential tourism | +1.2% | Western Europe core, Mediterranean spillover | Medium term (2–4 years) |
| Increasing integration of IP-based attractions | +0.9% | United Kingdom, France, Germany | Long term (≥ 4 years) |
| Advancements in ride-safety technology | +0.6% | EU-wide, Nordic leadership | Short term (≤ 2 years) |
| Growing adoption of dynamic pricing systems | +0.8% | Western Europe, selective Eastern Europe | Medium term (2–4 years) |
| Rise of hybrid retail-tainment park formats | +0.4% | Urban centers, mall-integrated venues | Long term (≥ 4 years) |
| Deployment of 5G/edge-enabled experiences | +0.3% | Nordic and DACH early adopters | Long term (≥ 4 years) |
| Source: Mordor Intelligence | |||
Surge in Experiential Tourism
A sharp consumer pivot toward experience-over-possession spending has lifted attendance, with guests paying higher prices for immersive storytelling and shareable attractions. Operators report per-capita spend rising faster than footfall as upgraded food, merchandising, and premium queue-skipping packages gain traction. Social-media reach amplifies word-of-mouth, particularly among 19–35-year-old visitors who generate viral content that markets parks at minimal cost. IP-driven expansions, such as Universal’s planned Bedford resort, underscore how the Europe amusement park market leverages experiential pull rather than ride count alone to attract travelers. The trend extends to older demographics, as baby boomers seek quality service and accessibility that make multigenerational trips appealing. Experiential differentiation is now central to pricing power, shielding operators from inflationary input costs. The driver is expected to sustain medium-term growth by reinforcing destination appeal and boosting average length of stay.
Increasing Integration of IP-Based Attractions
Licensing blockbuster franchises has moved from ornamentation to core strategy: Merlin Entertainments’ 2024 acquisition of global Minecraft rights illustrates how IP secures younger audiences and drives merchandise sales. Parques Reunidos’ Paramount partnerships demonstrate similar economics: branded universes yield higher ticket prices, longer dwell times, and cross-channel marketing efficiencies. Multi-year contracts also create content refresh cycles that maintain repeat visitation without full-scale ride replacements. As intellectual-property owners demand premium fees, only well-capitalized groups can compete, reinforcing moderate concentration within the Europe amusement park market. The long-term payoff includes lower promotional spend because brand equity comes built-in. IP theming also unlocks film-studio collaborations on seasonal events and streaming tie-ins that extend visitor engagement beyond park gates. Over the forecast period, IP integration will continue to widen the performance gap between tier-one parks and regional independents.
Growing Adoption of Dynamic Pricing & Revenue-Management Systems
Algorithmic pricing tools have matured into mission-critical infrastructure, as seen at Europa-Park, which blends weather, hotel occupancy, and historical booking data to calibrate ticket prices hourly [2]. Yield management raises weekday utilization while capping holiday crowding, improving both revenue and guest satisfaction. Parks gain visibility into demand elasticities that inform marketing spend and add-on bundling. Sustained adoption should lift the Europe amusement park market CAGR by 0.8 percentage points, primarily through higher average transaction values. The systems also support personalized offers that deepen loyalty-program engagement and spur incremental visitation. Revenue managers increasingly integrate ancillary streams such as parking, dining, and VR experiences into a single yield platform.
Deployment of 5G/Edge-Enabled Immersive Experiences
EU funding worth EUR 142 million (USD 152.65 million) is accelerating 5G and edge-cloud infrastructure, permitting real-time augmented-reality games and personalized ride content [3]. Early adopters can monetize premium AR overlays, in-app micro-transactions, and location-based storytelling that adapts to guest profiles. Low-latency networks enable synchronized group experiences, raising satisfaction scores and social-media exposure. Investment costs are falling as telcos co-finance deployments in return for data traffic and branding rights. The technology also supports advanced crowd analytics that optimize staffing and concession placement. Although network rollout is uneven, Nordic and DACH parks are positioned to set consumer expectations that ripple across the Europe amusement park market.
Restraints Impact Analysis*
| Restraint | (~) % Impact on CAGR Forecast | Geographic Relevance | Impact Timeline |
|---|---|---|---|
| High CAPEX & long ROI cycles | -1.8% | EU-wide, acute in Eastern Europe | Long term (≥ 4 years) |
| Escalating liability-insurance premiums | -0.7% | Western Europe entertainment sector | Medium term (2–4 years) |
| Tightening environmental-impact regulations | -0.9% | EU Green Deal compliance regions | Long term (≥ 4 years) |
| Aging demographic in Western Europe | -0.5% | Western Europe, Nordic concentration | Long term (≥ 4 years) |
| Source: Mordor Intelligence | |||
High CAPEX & Long ROI Cycles
New gate parks require EUR 100–200 million (USD 107.5–215 million) and can take 7–10 years to recoup cash outlays, discouraging entrants and slowing expansion in Central and Eastern Europe where financing costs are higher. Even evergreen brands like Euro Disneyland originally struggled to meet debt covenants, illustrating structural capital risk. Large parks must fund infrastructure, utilities, and road connections that magnify payback horizons. Government incentives mitigate risk but add political complexity. Existing groups with diversified lodging and IP licensing revenues enjoy lower cost of capital, widening the gap with local independents. This barrier reinforces the moderate concentration already characterizing the Europe amusement park market. Over the long term, only projects backed by multinational operators or public-private partnerships are likely to break ground.
Escalating Liability-Insurance Premiums
The post-pandemic insurance market remains tight: entertainment premium rates rose 7.5–10% in early 2025, and umbrella coverage for high-intensity rides attracts high deductibles. Casualty lines have stabilized, yet specialized leisure policies lag, raising operating costs by up to 5% of revenue, with liability components consuming the bulk. Underwriters demand granular safety data, incentivizing adoption of predictive maintenance but also increasing compliance workloads. Smaller parks lacking robust incident logs pay disproportionate surcharges or face reduced coverage limits. Medium-term financial strain could accelerate M&A as independents seek economies of scale in insurance purchasing. Operators offset cost pressure through dynamic pricing, but margin compression remains a headwind for growth.
*Our forecasts treat driver/restraint impacts as directional, not additive. The impact forecasts reflect baseline growth, mix effects, and variable interactions.
Segment Analysis
By Rides: Water Attractions Gain Momentum
Water attractions generated a 7.12% CAGR forecast well above the Europe amusement park industry average by leveraging climate-controlled facilities that extend seasonal windows and tap wellness tourism demand. Mechanical rides still accounted for 48.05% of Europe amusement park market share in 2025, anchoring park identities with signature coasters and drop towers. Yet indoor water complexes such as Therme Erding are demonstrating how spa-entertainment hybrids can boost dwell time and daily spend, yielding superior revenue per square meter. Mechanical ride designers now weave interactive elements and IP theming to maintain relevance against water-based competition. Specialty attractions, including VR-driven experiences, fill niche positioning but face frequent content-refresh costs. The expanding water segment diversifies guest profiles, drawing multigenerational families and wellness seekers who historically bypassed thrill-centric parks. Operators that bundle mechanical icons with indoor water offerings are positioned to capture a wider visitor mix and smooth revenue seasonality.
Guest surveys reveal that water attractions also achieve higher repeat visitation, aided by lower height restrictions that include younger children and older adults. Developers integrate surf lagoons and thermal pools into resort hotels, cross-selling spa treatments and night tickets. This bundling pushes average length of stay beyond two nights, further lifting Europe amusement park market size for resorts with water features. Mechanical rides will retain marketing spotlight, but their absolute share is expected to erode marginally as capital shifts toward versatile hybrid facilities. Investors now evaluate projects on resilience to weather volatility and demographic breadth, metrics where water parks score strongly. Strategic focus is therefore tilting toward experiential zones that combine slides, wave pools, and relaxation areas coupled with dining and retail micro-districts.

By Age Group: Under-18 Visits Accelerate
Visitors aged 19-35 captured 42.05% of 2025 spending, solidifying their status as the Europe amusement park market’s core group. However, the up-to-18 cohort is on track for a 6.74% CAGR through 2031, powered by parental preference for experiential gifts and rising school-trip demand. Millennial parents, now in their mid-30s, allocate leisure budgets to family travel that bonds generations and yields social-media content. Parks tailored with edutainment zones and age-specific IP from Peppa Pig to Minecraft are outperforming broad-brush attractions. Operators also introduce flexible ticket bundles that let caregivers combine toddler playlands with thrill-ride access for older siblings, creating holistic family value propositions.
Demography poses both opportunities and limits: Europe’s fertility rate fell to 1.38 births per woman in 2023, yet later parenthood means households possess higher discretionary funds once children reach park-going age . Parks respond by integrating stroller-friendly paths, sensory-sensitive experiences, and upgraded childcare facilities, enabling longer stays. Cross-generational design also appeals to grandparents who join family trips, subtly offsetting the aging-population restraint. Youth-centric digital engagement via gaming IP and AR scavenger hunts deepens loyalty that can last decades. Although 36-65 year-old segments deliver steady volumes, the fastest-growing under-18 visitor base anchors future demand curves and shapes ride investment pipelines toward gentle thrills and interactive play.
By Revenue Source: Lodging Lifts Margins
Tickets contributed 54.85% of 2025 revenue, underscoring their historical primacy, but hotels and resorts are forecast for a 9.98% CAGR the highest among all streams. Multi-day visitors typically spend 3–4 times more than day guests, making lodging expansion a key profit lever. Europa-Park’s six-hotel campus and PortAventura’s integrated resort model illustrate how on-site rooms can double average guest outlays while capturing in-park food, beverage, and merchandise sales. Dynamic packaging bundles tickets, meals, and themed events, boosting yield and smoothing occupancy across weekdays.
Food-and-beverage programs are evolving into immersive culinary shows aligned with park IP, commanding premium pricing. Merchandise revenue faces e-commerce competition, but exclusive park-only products and personalization technologies extend spending. Hotels also provide hedges against weather disruptions: visitors with prepaid packages are less likely to cancel. Operators channel profits into new attractions, reinforcing the Europe amusement park market growth loop. Over the forecast horizon, resort development will remain the strategic priority for groups seeking to diversify revenue beyond gate receipts and increase share-of-wallet.
Geography Analysis
Germany retained 17.29% of 2025 revenue, buoyed by central geography, robust domestic tourism, and flagship parks such as Europa-Park that pull cross-border visitors. Its regulatory stability and transport infrastructure further cement leadership. Spain, however, is the growth champion, projected at a 6.98% CAGR to 2031 as Mediterranean climate and aggressive resort investments transform it into a year-round destination. PortAventura’s three-park complex and forthcoming indoor water expansion exemplify Spain’s push toward multi-day stays that appeal to Northern Europeans craving winter sunshine.
France and the United Kingdom represent mature markets. France benefits from Disney’s EUR 2 billion (USD 2.15 billion) park overhaul that adds Frozen and Lion King lands, reinforcing Paris’s stature as Europe’s most visited tourist city. The United Kingdom anticipates Universal’s Bedford resort, which could recalibrate domestic tourism flows once operational. Italy maintains consistent performance via Gardaland and regional independents, while BENELUX and Nordic regions excel in per-capita spending thanks to high household incomes and premium pricing acceptance. Central and Eastern Europe remain under-penetrated; however, rising disposable income and EU funds for infrastructure hint at long-term upside if financing barriers ease.
The amusement parks market is analyzed by Mordor Intelligence across multiple other geographies, with in-depth regional assessments available for North America, Asia, and Middle East.
Regulatory Landscape
Europe amusement parks operate under a mix of EU harmonized standards and country-level rules that cover ride design, conformity assessment, inspections, and operational safety. These requirements affect capex and maintenance cycles for both mechanical and water attractions. In 2026, the European Committee for Standardization (CEN) released EN 13814:2026 for amusement rides and devices, introducing more stringent engineering and monitoring expectations, with a mandatory compliance deadline set for January 1, 2027. That schedule pushes operators and OEMs to plan re-certification and fleet upgrades.
National regimes continue to tighten alongside EU standards. On July 1, 2026, the Netherlands notified the European Commission of a draft revision to its Commodities Act Decree on Attraction and Playground Equipment 2023, widening the regulatory net around active equipment such as ziplines and go-kart tracks. Separately, EN 15330-2:2026 took effect as mandatory on July 1, 2026 for outdoor rides, requiring CE certification and functional safety validation (ISO 13849-1) at the PLd level. That raises documentation and safety-system requirements for suppliers and park operators.
Value Chain Analysis
The Europe amusement park value chain starts with concept and financing, which often links to IP licensing and resort master planning. It then moves through ride engineering and manufacturing, theming and construction, and technology integration across ticketing, payments, queue management, and guest apps, before reaching operations across parks, lodging, and ancillary spend categories. Branded content owners and experience designers increasingly influence early-stage decisions, since immersive IP-driven lands and accommodations shape both attendance and per-capita spend. At the same time, operators standardize procurement and governance to manage multi-country footprints, including Merlin Entertainments implementing a regional operating model by the end of 2025 to streamline oversight and execution.
On the supply side, compliance and sustainability increasingly shape procurement decisions. Standards such as EN 13814:2026 and EN 15330-2:2026 add certification workload for ride OEMs, control-system suppliers, and maintenance providers, which reinforces the role of specialized notified bodies and inspection partners in the downstream chain. Industry platforms also help coordinate supplier ecosystems and operating practices. IAAPA Expo Europe 2026 is positioned as a major sourcing and partnership venue, and it is certified as a sustainable event by Greentime (76% score), reflecting operator demand for vendor accountability around energy efficiency, materials, and operational impacts.
Competitive Landscape
The market shows moderate concentration, with Merlin Entertainments holding the leading position, followed by Parques Reunidos. Other key players include Compagnie des Alpes, along with the Disney and Universal divisions that each operate single-brand resorts. Consolidation trends favor companies with access to intellectual property, data analytics, and diversified lodging portfolios, as rising guest expectations for seamless, omnichannel experiences increase capital expenditure requirements. Recent investments, such as Universal’s planned resort in Bedford and Disney’s reinvestment in Paris, reflect growing competition for the international tourist’s share-of-wallet. Meanwhile, Compagnie des Alpes has strengthened its position in Germany with the acquisition of Belantis, while Parques Reunidos is shifting capital toward IP-rich attractions.
Merlin’s licensing of the Minecraft brand highlights a broader strategy to attract younger, digitally native audiences through globally recognized gaming franchises. Technology has become a key differentiator for market leaders, with tools like AI-driven queue management, cashless ecosystems, and augmented reality experiences improving guest satisfaction and enabling personalized upselling. Additionally, rising insurance costs highlight the value of scale, as larger operators secure better group policies and more favorable premiums. In contrast, start-ups are carving out niches with urban micro-parks like UNO Parks’ indoor adventure centers, which require less capital and allow for rapid content rotation. These developments suggest a diverse range of growth strategies across the competitive landscape.
Despite these shifts, competitive barriers remain moderate, allowing regional independents to maintain strong local followings through culturally relevant themes and deep community ties. However, from 2025 to 2030, mergers and acquisitions are expected to accelerate as fragmented players seek strategic partnerships. These collaborations will likely be aimed at financing technological upgrades and mitigating the rising costs associated with regulatory compliance. As the market evolves, access to IP, technological capabilities, and operational scale will increasingly determine competitive advantage. Overall, the sector is poised for dynamic transformation driven by both innovation and consolidation.
Europe Amusement Park Industry Leaders
-
Merlin Entertainments
-
Parques Reunidos
-
Compagnie des Alpes
-
Europa-Park GmbH & Co Mack KG
-
Looping Group
- *Disclaimer: Major Players sorted in no particular order
Market Opportunities and Future Outlook
IP-led expansions and multi-day destination formats create room for higher-yield revenue mixes, especially where lodging and premium experiences can be bundled with attractions. Merlin Entertainments has outlined an IP-driven pipeline that includes Minecraft and Harry Potter themed accommodations, highlighting how park-adjacent hotels and themed rooms add capacity without requiring proportional increases in ride footprint. Europa-Park has also communicated a themed land project targeted for 2028 in partnership with the European Space Agency, indicating continued appetite for differentiated, story-led placemaking that can support premium pricing and longer stays.
A second opportunity area centers on supplier-led modernization across safety, certification, and digitalization as EU standards tighten and ride systems become more software-intensive. The 2026 update cycle for EN 13814 and the July 2026 effective date for EN 15330-2:2026 increase demand for re-engineering, controls upgrades, monitoring, and documentation services across installed bases. That benefits OEMs and technology providers that can package functional safety validation, predictive maintenance, and guest-flow tools into integrated offerings. IAAPA Expo Europe 2026 in London, with 800+ exhibitors and 22,000 square meters of exhibition space, provides a near-term channel for these solutions, while also showing how operators are translating compliance, sustainability, and guest experience needs into consolidated capex plans.
Recent Industry Developments
- June 2026: Parques Reunidos launched Kilauea attraction at Aquopolis Villanueva de la Canada as part of broader investment in the Comunidad de Madrid region. The Madrid-region expansion increases per-capita spending potential. The move strengthens regional portfolio and Madrid footprint; reinforces urban/leisure cluster strategy.
- June 2026: Compagnie des Alpes confirmed expansion of Travelski Night Express train services to Benelux routes for 2026/2027 season. The cross-border ski-tourism connectivity supports multi-day destination appeal. The initiative improves cross-country visitation to the Alpine portfolio; leverages integrated travel-experience strategy.
- May 2026: Parques Reunidos announced expansion and upgrade of Aquasplash Antibes (14,000 sqm, four new attractions). Large-scale upgrade in a key French Riviera water park. It enhances premium family destination mix; expands experiential/attractions portfolio.
Research Methodology Framework and Report Scope
Market Definition and Coverage
For this report, the market is defined as the revenue generated by amusement parks operating across Europe, captured from visitor-facing income streams and measured in USD for the stated years.
Scope exclusions: We exclude broader out-of-home entertainment categories that are not park-based operations, along with general tourism spending that does not directly accrue to amusement park operators.
Segmentation Overview
- By Rides
- Mechanical Rides
- Water Rides
- Other Rides
- By Age
- Upto 18 years
- 19 to 35 years
- 36 to 50 years
- 51 to 65 years
- More than 65 years
- By Revenue Source
- Tickets
- Food & Beverages
- Merchandise
- Hotels/Resorts
- Others
- By Country
- United Kingdom
- Germany
- France
- Spain
- Italy
- BENELUX (Belgium, Netherlands, Luxembourg)
- NORDICS (Denmark, Finland, Iceland, Norway, Sweden)
- Rest of Europe
Data Sources, Market Sizing, and Validation
Desk Research
Desk research was used to map the operating landscape across major European countries and to build a clean set of reference indicators before assumptions were finalized. We relied on public, non-paywalled sources such as Eurostat for tourism and household spend direction, national statistics offices for visitor and leisure indicators, and national tourism boards for travel seasonality context.
We also reviewed operator annual reports and investor presentations to understand revenue mix and site level growth drivers, followed by association websites and reputed press coverage for openings, refurbishments, and attendance signals. Where needed, paid subscriptions were used for company financial intelligence, news and financials screening, and patent lookups related to ride systems, which helped check timelines and investment cycles. The sources listed here are illustrative only, and many other public documents and data points were also used for collection, cross-checking, and clarification.
Primary Interviews and Surveys
Primary work focused on validating what sits inside the revenue pool and how it shifts by season and country, so we are not overcounting tourism or undercounting on-site spend. We spoke with a mix of park operators, suppliers linked to ride and guest-experience upgrades, and channel-side stakeholders, and then we used those inputs to confirm assumptions for major geographies across Europe and to close gaps that desk research could not resolve.
Distribution of primary research fieldwork respondents
| Company type | Respondent position |
|---|---|
| Top tier: 31% | CXOs: 13% |
| Mid tier: 47% | Functional/Unit leaders: 32% |
| Smaller Players: 22% | Managers: 55% |
Market-Sizing & Forecasting
Sizing starts from a top-down build where tourism and leisure activity indicators help reconstruct the demand pool by country, which is then translated into park revenue using observed ticketing and in-park spend patterns. To keep the totals grounded, we corroborate the output using selective bottom-up approximations, such as sampled operator revenues, sanity checks on attendance times average spend, and channel checks around pricing changes.
Key inputs used in the model include seasonal attendance patterns, ticket price progression, per-capita in-park spend (food, beverage, merchandise), capacity additions tied to new rides and expansions, and the pace of international visitor recovery in key destinations. Where data was thin for smaller countries, values were bridged using nearby market behavior and then corrected through interview feedback. For forecasting, scenario analysis was used to reflect different demand outcomes, and it was anchored to variables that primary respondents consistently pointed to, especially travel sentiment, pricing tolerance, and planned capex cycles.
Data Validation & Update Cycle
Validation is done through a set of cross-checks that compare modeled results against independent signals, and then exceptions are investigated before numbers are finalized. We review country totals for sudden jumps, verify that price and attendance assumptions move in a realistic way, and re-check outliers against public disclosures and recent news.
Before sign-off, the model and assumptions go through multi-step internal reviews so calculation logic, unit consistency, and currency timing are aligned across years. If material events occur, such as major park openings, closures, or sharp tourism disruptions, respondents are re-contacted and assumptions are refreshed. Reports are refreshed annually, and a final pre-delivery review is completed so clients receive the latest updated view at the time of access.
Mordor Intelligence's Europe Amusement Parks Market Sizing Compared With Other Published Estimates
Published market values for European amusement parks can vary because different studies do not always count the same revenue streams, and the year labeling can also shift between base year and current year reporting. The table helps make that spread easier to interpret by lining up the year and the number.
The benchmark table shows a noticeable difference that mainly comes from scope and measurement choices. In Mordor Intelligence's model, the value is tied to amusement park operator revenues across Europe and is validated with country-level demand signals, while some other estimates blend in broader out-of-home entertainment or mix reported capacity with realized attendance and spend.
Benchmark comparison
| Source | Market Size | Gaps in Research Methodology |
|---|---|---|
| Mordor Intelligence | USD 27.09 B (2025) | |
| Trade Journal A | USD 35.30 B (2025) | Often aligns to a broader classification that can include arcades or adjacent paid attractions, which inflates the addressable revenue beyond park operators. |
| Regional Consultancy B | USD 22.75 B (2024) | Uses an earlier year with conservative recovery assumptions and lighter validation of ticket price and in-park spend progression by country. |
Taken together, the comparison suggests the biggest drivers are what is included in the revenue pool and how the demand checks are applied year by year. By keeping the steps traceable to attendance and spend logic, and then pressure-testing with operator and channel feedback, the final number stays practical to replicate and update.
Key Questions Answered in the Report
What is the current value of the Europe amusement park market in 2026?
It stands at USD 28.33 billion, reflecting steady recovery after pandemic headwinds.
How fast will the market grow through 2031?
The forecast CAGR is 4.58%, taking revenue to USD 35.47 billion by 2031.
Which ride category is expanding the quickest?
Water attractions lead with a 7.12% CAGR thanks to climate-controlled indoor developments.
Why are hotels and resorts critical for operators?
Lodging lifts per-guest outlays as multi-day stays can generate three to four times the spend of day visits.
Which country offers the fastest growth outlook?
Spain is projected to advance at a 6.98% CAGR, underpinned by Mediterranean climate and integrated resorts.