| Study Period | 2017 - 2030 |
| Base Year For Estimation | 2024 |
| Forecast Data Period | 2025 - 2030 |
| Market Size (2025) | USD 10.12 Billion |
| Market Size (2030) | USD 15.36 Billion |
| CAGR (2025 - 2030) | 8.69 % |
| Market Concentration | Low |
Major Players*Disclaimer: Major Players sorted in no particular order |

Europe Agricultural Biologicals Market Analysis
The Europe Agricultural Biologicals Market size is estimated at 10.12 billion USD in 2025, and is expected to reach 15.36 billion USD by 2030, growing at a CAGR of 8.69% during the forecast period (2025-2030).
The European agricultural biologicals market is undergoing a significant transformation driven by increasing environmental concerns and regulatory pressures. The manufacturing of synthetic fertilizers currently accounts for over 40% of agricultural emissions in the European Union, prompting a shift toward more sustainable agricultural practices. The European Green Deal and Farm to Fork Strategy have established ambitious targets to reduce fertilizer consumption by at least 20% and nutrient losses by 50% by 2030, while maintaining soil fertility. These initiatives are reshaping the agricultural landscape and driving innovation in biological alternatives to conventional farming inputs.
The organic farming sector has emerged as a cornerstone of European agriculture's sustainable future, with significant growth in both production and market demand. The region has witnessed a substantial increase in organic farming area, expanding from 4.9 million hectares in 2017 to 6.9 million hectares in 2022, demonstrating the sector's robust growth trajectory. The European Union has set an ambitious target of converting 25% of its agricultural land to organic farming by 2030, reflecting its commitment to sustainable agriculture and creating opportunities for organic farming inputs.
Consumer awareness and demand for sustainably produced food products are driving market growth across Europe. Germany stands as a testament to this trend, with organic product demand reaching USD 6.3 billion in 2021, representing approximately 10% of global demand. This shift in consumer preferences has encouraged farmers to adopt biological alternatives to conventional agricultural inputs, leading to increased investment in research and development of innovative agricultural bio products.
The industry is experiencing rapid technological advancement and innovation in biological product development. European agricultural biologicals manufacturers are focusing on developing more effective and targeted solutions, including enhanced biofertilizers, biopesticides, and biostimulants. The presence of approximately 330,000 organic farmers in Europe, accounting for up to 20% of the farming area in Member States, has created a strong foundation for the adoption of agricultural biologicals. This extensive network of organic producers serves as a catalyst for innovation and development in the biological agricultural inputs sector, driving both product development and market expansion.
Europe Agricultural Biologicals Market Trends
European green deal is majorly contributing for increasing organic cultivation across the region
- European countries are increasingly promoting organic farming, and the amount of land categorized as organic has significantly increased over the last 10 years. In March 2021, the European Commission launched an organic action plan to achieve the European Green Deal target of ensuring that 25% of agricultural land is under organic farming by 2030. Austria, Italy, Spain, and Germany are among the leading countries for organic cultivation in the European region. Italy has 15.0% of its agricultural area under organic farming, which is higher than the EU average of 7.5%.
- In 2021, organic land in the European Union was recorded at 14.7 million hectares. The agricultural production area is divided into three main types of use: arable land crops (mainly cereals, root crops, and fresh vegetables), permanent grassland, and permanent crops. The area of organic arable land was 6.5 million hectares in 2021, the equivalent of 46% of the European Union's total organic agricultural area.
- The organic cultivation area of cereals, oilseeds, protein crops, and pulses in the European Union increased by 32.6% between 2017 and 2021, amounting to more than 1.6 million hectares. With 1.3 million hectares in production, perennial crops accounted for 15% of the organic land in 2020. Olives, grapes, almonds, and citrus fruits are a few examples of crops in this group. Spain, Italy, and Greece are significant growers of organic olive trees, with 197,000, 179,000, and 47,000 hectares, respectively, in recent years. Both olives and grapes are crucial for the European agricultural industry because they can be turned into specialty products that are in demand locally and globally. The increasing organic acreage in the region is expected to strengthen the organic agricultural industry in Europe.

Understand The Key Trends Shaping This Market
Download PDF
Growing demand and rising the per capita spending on organic products in the region
- European consumers are increasingly purchasing goods made using natural materials and methods. Even though organic food still only makes up a fraction of the European Union's overall agricultural production, it is no longer a niche industry. The European Union represents the second-largest single market for organic goods internationally, with an average per capita spending of USD 74.8 annually. The per capita spending on organic food in Europe has doubled in the last decade. In 2020, Swiss and Danish consumers spent the most on organic food (USD 494.09 and USD 453.90 per capita, respectively).
- Germany is the largest organic food market in Europe and the second largest market in the world after the United States, with a market size of USD 6.3 billion in 2021 and a per capita consumption of USD 75.6, as per Global Organic Trade data. The country accounted for 10.0% of the global organic food demand and is estimated to record a CAGR of 2.7% between 2021 and 2026.
- The organic food market in France witnessed strong growth, with a 12.6% rise in retail sales in 2021. The country's per capita spending on organic food was recorded at USD 88.8 in 2021, as per Global Organic Trade data. In 2018, as recorded by the Agence BIO/Spirit Insight Barometer, 88% of French people declared having consumed organic products. The preservation of health, environment, and animal welfare are the primary justifications for consuming organic foods in France. The organic market has begun to grow in several other nations, including Spain, the Netherlands, and Sweden, with the opening of organic stores. Organic food sales grew during and post the COVID-19 pandemic as consumers began paying more attention to health issues and learned the adverse effects of conventionally grown food.

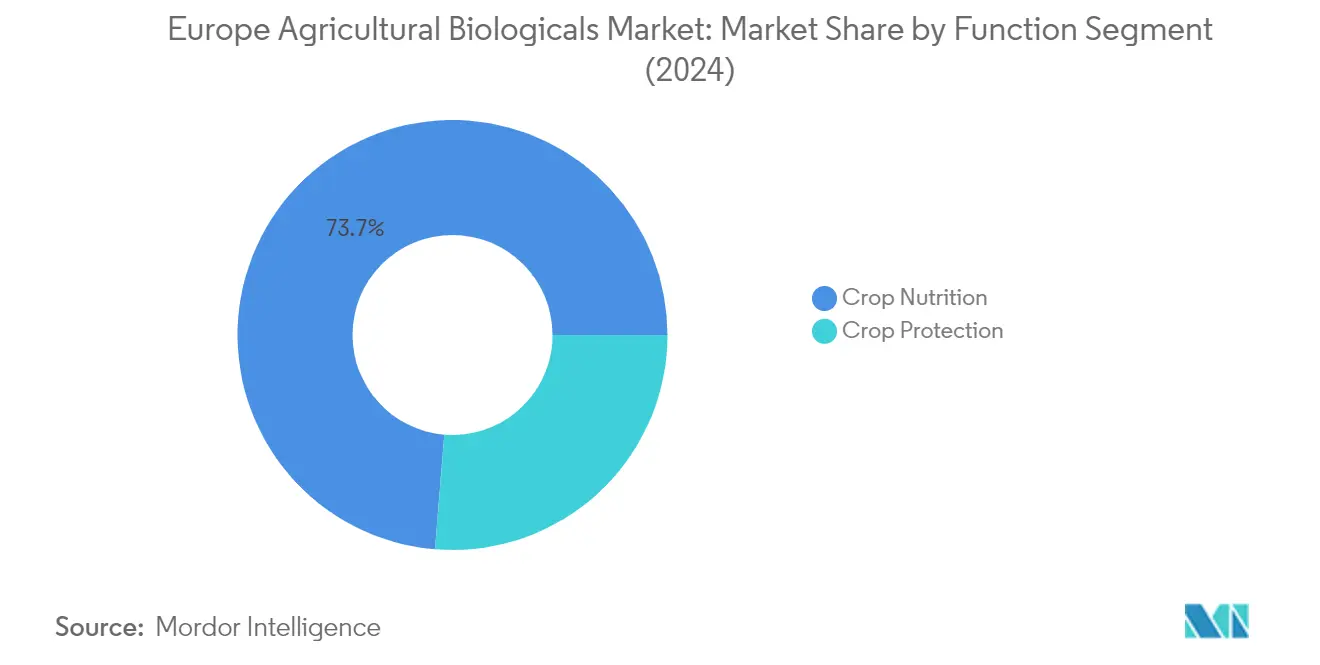
Segment Analysis: Function
Crop Nutrition Segment in Europe Agricultural Biologicals Market
The crop nutrition segment dominates the European agricultural biologicals market, accounting for approximately 74% of the total market value in 2024. This segment's prominence is driven by the increasing adoption of biofertilizers, biostimulants, and organic fertilizers across the region. The European Union's Green Deal initiative, announced in 2021, presents significant opportunities for manufacturers in this segment by promoting sustainable agriculture with a low-carbon economy. Field crops occupy the largest share within this segment, followed by horticultural crops, reflecting the European Union's significant position in global grain production, accounting for 4.3% of the global grain production area. The segment's growth is further supported by the rising awareness among consumers regarding the harmful impacts of synthetic fertilizers, which has increased the demand for organic produce at both international and domestic levels.
Crop Protection Segment in Europe Agricultural Biologicals Market
The crop protection segment is emerging as the fastest-growing segment in the European agricultural biologicals market, projected to expand at approximately 10% between 2024 and 2029. This remarkable growth is primarily driven by the European Green Deal's ambitious goal of reducing chemical pesticide use and risk by 50% by 2030. The segment encompasses biocontrol agents and biopesticides, with biopesticides dominating the market share. The growth is further supported by the increasing adoption of Integrated Pest Management (IPM) programs across Europe, which promote the use of biological crop protection methods. The segment's expansion is particularly notable in row crops, where various biological solutions are being implemented to combat pests and diseases while maintaining environmental sustainability.
Segment Analysis: Crop Type
Row Crops Segment in Europe Agricultural Biologicals Market
Row crops dominate the European agricultural biologicals market, accounting for approximately 78% of the overall market value in 2024. The segment's prominence is primarily attributed to the extensive cultivation area of row crops like wheat, maize, corn, barley, and oats across Europe. The implementation of various European Commission initiatives has enhanced the use of agricultural biologicals in row crops, particularly following the launch of the organic action plan that aims to achieve the European Green Deal target of 25% agricultural land under organic farming by 2030. Studies have demonstrated that biofertilizers can increase maize yield by around 15% in field conditions and 18% in greenhouse studies using field soil. The segment's strong performance is further supported by the increasing adoption of sustainable farming practices and the growing demand for organic cereals and oilseeds in the region.
Horticultural Crops Segment in Europe Agricultural Biologicals Market
The horticultural crops segment is experiencing the fastest growth in the European agricultural biologicals market, projected to expand at approximately 9% between 2024 and 2029. This robust growth is driven by several factors, including the increasing trend in overall horticultural crop area and the rising demand for organic fruits and vegetables. The segment's growth is particularly notable in southern Europe, where climate conditions are ideal for growing mangos, avocados, and other tropical fruits. Environmental consciousness among European farmers has led to the creation of the tropiterranean movement as a brand to differentiate their organic tropical fruits. The adoption of various biofertilizers, including those based on Glomus fasciculatum, Glomus mosseae, Azospirillum, Azotobacter, and PSB, has become increasingly common in fruit cultivation, while VAM fungi are gaining popularity for enhancing the absorption of mobile nutrients like P, Ca, S, Zn, Mg, and Cu from the rhizosphere.
Remaining Segments in Crop Type Segmentation
The cash crops segment, while smaller in market share, plays a vital role in the European agricultural biologicals market, particularly in organic tea and tobacco cultivation. Turkey has emerged as a significant player in this segment, with dedicated organic farming areas for tea cultivation. The segment benefits from the application of organic fertilizers, which have shown effectiveness in preventing soil degradation and managing fungal diseases in tobacco plants. Animal-origin manure has proven particularly beneficial in continuous cropping tobacco fields. The segment also sees significant usage of biopesticides, especially in tea cultivation, where environmental safety and biodegradability are crucial factors in pest management programs.
Europe Agricultural Biologicals Market Geography Segment Analysis
Europe Agricultural Biologicals Market in France
France stands as the powerhouse in Europe's agricultural biologicals market, commanding approximately 17% of the market share in 2024. The country's dominance is reinforced by its impressive growth trajectory, with projections indicating a robust growth rate of nearly 9% from 2024 to 2029. This remarkable performance is underpinned by France's position as one of the largest organic crop producers in Europe, with over 1.1 million hectares dedicated to organic cultivation. The country's agricultural biologicals landscape is predominantly shaped by field crops, which account for more than three-quarters of the market value. The strong market position is further strengthened by the country's comprehensive crop nutrition segment, particularly in biofertilizers, which demonstrates the market's maturity and sophistication. The increasing awareness among French farmers about the detrimental effects of chemical fertilizers, coupled with growing consumer demand for organic products, continues to drive market expansion.
Europe Agricultural Biologicals Market in Spain
Spain has emerged as a pivotal player in Europe's agricultural biologicals market, particularly notable for its diverse agricultural portfolio. The country's strength lies in its balanced approach between field crops and horticultural crops, with field crops dominating slightly over 56% of the market value. Spain's position is particularly strong in the organic citrus market, being one of the largest producers of fresh market citrus worldwide, including oranges, mandarins, and lemons. The country has shown remarkable progress in sustainable farming practices, with farmers increasingly transitioning from chemical inputs to biological crop protection alternatives. This shift is largely driven by growing consumer awareness and scrutiny of food safety and quality. The Spanish market is further characterized by its strong presence in organic olive oil production and fruits and vegetables, which has created a robust demand for agricultural biologicals. The country's agricultural sector benefits from increasing farmer awareness and adoption of sustainable farming practices, supported by strong consumer demand for organic products.
Europe Agricultural Biologicals Market in Germany
Germany's position in the agricultural biologicals market is characterized by its sophisticated approach to organic farming and strong consumer demand for organic products. The country's market is predominantly driven by row crops, which account for over 90% of the market value, reflecting the country's extensive agricultural landscape. The German market demonstrates a strong preference for crop nutrition products, particularly biofertilizers, which have become integral to both conventional and organic farming practices. The country's agricultural ministry's ambitious target to achieve 30% organic food in German supermarkets by 2030 has created a strong foundation for market growth. The market is further strengthened by increasing awareness among farmers about sustainable agricultural practices and growing consumer demand for organic products. Germany's approach to agricultural biologicals is marked by a strong focus on innovation and sustainability, supported by robust distribution networks and technical expertise.
Europe Agricultural Biologicals Market in Italy
Italy has established itself as a significant force in the European agricultural biologicals market, with a strong focus on organic farming practices. The country's market is characterized by its diverse agricultural landscape, with particular strength in organic olive production and horticultural crops. The Italian approach to agricultural biologicals is marked by a strong domestic production base, with most organic products consumed within the country being produced locally. The market benefits from well-established organic farming associations and a robust value chain that supports both production and distribution. Italian farmers have shown increasing interest in adopting agricultural microbials solutions, particularly in regions known for specialty crops and traditional farming practices. The country's agricultural biologicals sector is further strengthened by growing consumer awareness and preference for organic products, supported by various initiatives promoting sustainable agriculture.
Europe Agricultural Biologicals Market in Other Countries
The agricultural biologicals market across other European countries, including the Netherlands, Russia, Turkey, and the United Kingdom, demonstrates varying levels of market maturity and adoption rates. These markets are characterized by their unique agricultural priorities and challenges, with each country developing distinct approaches to biological solutions. The Netherlands, despite its smaller size, shows significant potential in greenhouse cultivation and innovative farming techniques. Russia's vast agricultural landscape presents unique opportunities for biological solutions, particularly in field crops. Turkey's strong export-oriented organic sector continues to drive demand for biopesticides, while the United Kingdom's post-Brexit regulatory environment has created new dynamics in the market. These countries collectively contribute to the diverse and evolving landscape of Europe's agricultural biologicals market, each bringing unique strengths and opportunities to the sector.
Get Analysis on Important Geographic Markets
Download PDF
Europe Agricultural Biologicals Industry Overview
Top Companies in Europe Agricultural Biologicals Market
The European agricultural biologicals market is characterized by companies actively pursuing product innovation and development initiatives. Companies are focusing on developing novel biostimulants, biopesticides, and organic fertilizers to meet the growing demand for sustainable agricultural solutions. Operational agility is demonstrated through customized solutions based on agronomic analysis and technical insights, while maintaining strong distribution networks across multiple countries. Strategic moves include investments in research and development facilities, particularly in biofertilizer production and testing capabilities. Companies are expanding their presence through subsidiaries and representative offices, with many establishing production units in key markets like Spain and France. The emphasis on digital transformation and technical support teams further strengthens market positioning and customer relationships.
Fragmented Market with Diverse Player Base
The European agricultural biologicals market exhibits a highly fragmented structure with a mix of global and regional players. The top five market players hold a relatively small portion of the market share, indicating low market concentration and high competition. Local specialists with deep regional expertise compete alongside multinational conglomerates that leverage their extensive research capabilities and distribution networks. Many small players operate in the market due to limited regulation, though this is expected to change with the implementation of stricter regulatory frameworks.
The market is characterized by companies specializing in specific segments such as biostimulants, biopesticides, or organic fertilizers, rather than offering comprehensive biological solutions. While mergers and acquisitions activity remains moderate, companies are increasingly forming strategic partnerships and collaborations to enhance their product portfolios and expand geographical reach. The presence of numerous small-scale manufacturers and the growing entry of conventional agrochemical companies into the biologicals space further intensifies market competition.
Innovation and Sustainability Drive Future Growth
Success in the European agricultural biologicals market increasingly depends on companies' ability to develop effective, sustainable solutions while maintaining competitive pricing. Incumbents are strengthening their position through investments in research and development, focusing on enhanced product efficacy and broader application ranges. Market leaders are also expanding their distribution networks and technical support services while developing integrated solutions that combine multiple biological products. Building strong relationships with farmers through demonstration trials and education programs has become crucial for market success.
For contenders looking to gain market share, specialization in niche segments and focus on specific crop types or regional markets offers opportunities for growth. The increasing adoption of organic farming practices and stringent regulations on chemical pesticides create favorable conditions for new entrants with innovative biological solutions. Success factors include developing products that complement existing farming practices, establishing robust quality control systems, and building credibility through scientific validation. Companies must also consider potential regulatory changes, particularly regarding product registration and labeling requirements, while maintaining flexibility to adapt to evolving market demands.
Europe Agricultural Biologicals Market Leaders
-
Agronutrition
-
Biolchim SpA
-
Koppert Biological Systems Inc.
-
Symborg Inc.
-
Trade Corporation International
- *Disclaimer: Major Players sorted in no particular order

Need More Details on Market Players and Competitors?
Download PDF
Europe Agricultural Biologicals Market News
- March 2021: Symborg opened a new hydrolysis plant in Spain, with a total investment of USD 28.0 million. The plant is designed for manufacturing sustainable agriculture products, such as biofertilizers, biostimulants, and biocontrol solutions imported to the US market.
- February 2021: Koppert developed a biofertilizer product called VICI MYCO D, which is a product based on microorganisms. It contributes to the start and development of the roots of plants as soon as crops are planted. It helps in exploiting mineral resources and improves tolerance to abiotic stresses.
- January 2021: Atlántica Agrícola’s developed Micomix, a biostimulant composed primarily of mycorrhizal fungi, rhizobacteria, and chelated micronutrients. The presence and development of these microorganisms in the rhizosphere create a symbiotic relationship with the plant that favors the absorption of water and mineral nutrients and increases its tolerance to water and salt stress.
Free With This Report
Along with the report, We also offer a comprehensive and exhaustive data pack on Areas under organic cultivation, one of the key trends that affect the market size of agricultural biologicals. This data pack also includes areas under cultivation by crop types, such as Row Crops (Cereals, Pulses, and Oilseeds), Horticultural Crops (Fruits and Vegetables), and Cash Crops in North America, Europe, Asia-Pacific, South America and Africa.


Europe Agricultural Biologicals Market Report - Table of Contents
1. EXECUTIVE SUMMARY & KEY FINDINGS
2. REPORT OFFERS
3. INTRODUCTION
- 3.1 Study Assumptions & Market Definition
- 3.2 Scope of the Study
- 3.3 Research Methodology
4. KEY INDUSTRY TRENDS
- 4.1 Area Under Organic Cultivation
- 4.2 Per Capita Spending On Organic Products
-
4.3 Regulatory Framework
- 4.3.1 France
- 4.3.2 Germany
- 4.3.3 Italy
- 4.3.4 Netherlands
- 4.3.5 Russia
- 4.3.6 Spain
- 4.3.7 Turkey
- 4.3.8 United Kingdom
- 4.4 Value Chain & Distribution Channel Analysis
5. MARKET SEGMENTATION (includes market size in Value in USD and Volume, Forecasts up to 2030 and analysis of growth prospects)
-
5.1 Function
- 5.1.1 Crop Nutrition
- 5.1.1.1 Biofertilizer
- 5.1.1.1.1 Azospirillum
- 5.1.1.1.2 Azotobacter
- 5.1.1.1.3 Mycorrhiza
- 5.1.1.1.4 Phosphate Solubilizing Bacteria
- 5.1.1.1.5 Rhizobium
- 5.1.1.1.6 Other Biofertilizers
- 5.1.1.2 Biostimulants
- 5.1.1.2.1 Amino Acids
- 5.1.1.2.2 Fulvic Acid
- 5.1.1.2.3 Humic Acid
- 5.1.1.2.4 Protein Hydrolysates
- 5.1.1.2.5 Seaweed Extracts
- 5.1.1.2.6 Other Biostimulants
- 5.1.1.3 Organic Fertilizer
- 5.1.1.3.1 Manure
- 5.1.1.3.2 Meal Based Fertilizers
- 5.1.1.3.3 Oilcakes
- 5.1.1.3.4 Other Organic Fertilizers
- 5.1.2 Crop Protection
- 5.1.2.1 Biocontrol Agents
- 5.1.2.1.1 Macrobials
- 5.1.2.1.2 Microbials
- 5.1.2.2 Biopesticides
- 5.1.2.2.1 Biofungicides
- 5.1.2.2.2 Bioherbicides
- 5.1.2.2.3 Bioinsecticides
- 5.1.2.2.4 Other Biopesticides
-
5.2 Crop Type
- 5.2.1 Cash Crops
- 5.2.2 Horticultural Crops
- 5.2.3 Row Crops
-
5.3 Country
- 5.3.1 France
- 5.3.2 Germany
- 5.3.3 Italy
- 5.3.4 Netherlands
- 5.3.5 Russia
- 5.3.6 Spain
- 5.3.7 Turkey
- 5.3.8 United Kingdom
- 5.3.9 Rest of Europe
6. COMPETITIVE LANDSCAPE
- 6.1 Key Strategic Moves
- 6.2 Market Share Analysis
- 6.3 Company Landscape
-
6.4 Company Profiles (includes Global Level Overview, Market Level Overview, Core Business Segments, Financials, Headcount, Key Information, Market Rank, Market Share, Products and Services, and Analysis of Recent Developments).
- 6.4.1 Agronutrition
- 6.4.2 Andermatt Group AG
- 6.4.3 Atlántica Agrícola
- 6.4.4 Biolchim SpA
- 6.4.5 Bionema
- 6.4.6 Koppert Biological Systems Inc.
- 6.4.7 Lallemand Inc.
- 6.4.8 Suståne Natural Fertilizer, Inc
- 6.4.9 Symborg Inc.
- 6.4.10 Trade Corporation International
7. KEY STRATEGIC QUESTIONS FOR AGRICULTURAL BIOLOGICALS CEOS
8. APPENDIX
-
8.1 Global Overview
- 8.1.1 Overview
- 8.1.2 Porter’s Five Forces Framework
- 8.1.3 Global Value Chain Analysis
- 8.1.4 Market Dynamics (DROs)
- 8.2 Sources & References
- 8.3 List of Tables & Figures
- 8.4 Primary Insights
- 8.5 Data Pack
- 8.6 Glossary of Terms
You Can Purchase Parts Of This Report. Check Out Prices For Specific Sections
Get Price Break-up Now
List of Tables & Figures
- Figure 1:
- AREA UNDER ORGANIC CULTIVATION IN HECTARES, EUROPE, 2017 - 2022
- Figure 2:
- PER CAPITA SPENDING ON ORGANIC PRODUCTS IN USD, EUROPE, 2017 - 2022
- Figure 3:
- EUROPE AGRICULTURAL BIOLOGICALS MARKET, VOLUME, METRIC TON, 2017 - 2029
- Figure 4:
- EUROPE AGRICULTURAL BIOLOGICALS MARKET, VALUE, USD, 2017 - 2029
- Figure 5:
- AGRICULTURAL BIOLOGICALS CONSUMPTION IN METRIC TON, EUROPE, 2017 - 2029
- Figure 6:
- AGRICULTURAL BIOLOGICALS CONSUMPTION IN USD, EUROPE, 2017 - 2029
- Figure 7:
- AGRICULTURAL BIOLOGICALS CONSUMPTION VOLUME BY FUNCTION IN %, EUROPE, 2017 VS 2023 VS 2029
- Figure 8:
- AGRICULTURAL BIOLOGICALS CONSUMPTION VALUE BY FUNCTION IN %, EUROPE, 2017 VS 2023 VS 2029
- Figure 9:
- CROP NUTRITION CONSUMPTION BY TYPE IN METRIC TON, EUROPE, 2017 - 2029
- Figure 10:
- CROP NUTRITION CONSUMPTION BY TYPE IN USD, EUROPE, 2017 - 2029
- Figure 11:
- CROP NUTRITION CONSUMPTION VOLUME BY TYPE IN %, EUROPE, 2017 VS 2023 VS 2029
- Figure 12:
- CROP NUTRITION CONSUMPTION VALUE BY TYPE IN %, EUROPE, 2017 VS 2023 VS 2029
- Figure 13:
- BIOFERTILIZER CONSUMPTION IN METRIC TON, EUROPE, 2017 - 2029
- Figure 14:
- BIOFERTILIZER CONSUMPTION IN USD, EUROPE, 2017 - 2029
- Figure 15:
- BIOFERTILIZER CONSUMPTION VOLUME BY FORM IN %, EUROPE, 2017 VS 2023 VS 2029
- Figure 16:
- BIOFERTILIZER CONSUMPTION VALUE BY FORM IN %, EUROPE, 2017 VS 2023 VS 2029
- Figure 17:
- AZOSPIRILLUM CONSUMPTION IN METRIC TON, EUROPE, 2017 - 2029
- Figure 18:
- AZOSPIRILLUM CONSUMPTION IN USD, EUROPE, 2017 - 2029
- Figure 19:
- AZOSPIRILLUM CONSUMPTION VALUE BY CROP TYPE IN %, EUROPE, 2022 VS 2029
- Figure 20:
- AZOTOBACTER CONSUMPTION IN METRIC TON, EUROPE, 2017 - 2029
- Figure 21:
- AZOTOBACTER CONSUMPTION IN USD, EUROPE, 2017 - 2029
- Figure 22:
- AZOTOBACTER CONSUMPTION VALUE BY CROP TYPE IN %, EUROPE, 2022 VS 2029
- Figure 23:
- MYCORRHIZA CONSUMPTION IN METRIC TON, EUROPE, 2017 - 2029
- Figure 24:
- MYCORRHIZA CONSUMPTION IN USD, EUROPE, 2017 - 2029
- Figure 25:
- MYCORRHIZA CONSUMPTION VALUE BY CROP TYPE IN %, EUROPE, 2022 VS 2029
- Figure 26:
- PHOSPHATE SOLUBILIZING BACTERIA CONSUMPTION IN METRIC TON, EUROPE, 2017 - 2029
- Figure 27:
- PHOSPHATE SOLUBILIZING BACTERIA CONSUMPTION IN USD, EUROPE, 2017 - 2029
- Figure 28:
- PHOSPHATE SOLUBILIZING BACTERIA CONSUMPTION VALUE BY CROP TYPE IN %, EUROPE, 2022 VS 2029
- Figure 29:
- RHIZOBIUM CONSUMPTION IN METRIC TON, EUROPE, 2017 - 2029
- Figure 30:
- RHIZOBIUM CONSUMPTION IN USD, EUROPE, 2017 - 2029
- Figure 31:
- RHIZOBIUM CONSUMPTION VALUE BY CROP TYPE IN %, EUROPE, 2022 VS 2029
- Figure 32:
- OTHER BIOFERTILIZERS CONSUMPTION IN METRIC TON, EUROPE, 2017 - 2029
- Figure 33:
- OTHER BIOFERTILIZERS CONSUMPTION IN USD, EUROPE, 2017 - 2029
- Figure 34:
- OTHER BIOFERTILIZERS CONSUMPTION VALUE BY CROP TYPE IN %, EUROPE, 2022 VS 2029
- Figure 35:
- BIOSTIMULANTS CONSUMPTION IN METRIC TON, EUROPE, 2017 - 2029
- Figure 36:
- BIOSTIMULANTS CONSUMPTION IN USD, EUROPE, 2017 - 2029
- Figure 37:
- BIOSTIMULANTS CONSUMPTION VOLUME BY FORM IN %, EUROPE, 2017 VS 2023 VS 2029
- Figure 38:
- BIOSTIMULANTS CONSUMPTION VALUE BY FORM IN %, EUROPE, 2017 VS 2023 VS 2029
- Figure 39:
- AMINO ACIDS CONSUMPTION IN METRIC TON, EUROPE, 2017 - 2029
- Figure 40:
- AMINO ACIDS CONSUMPTION IN USD, EUROPE, 2017 - 2029
- Figure 41:
- AMINO ACIDS CONSUMPTION VALUE BY CROP TYPE IN %, EUROPE, 2022 VS 2029
- Figure 42:
- FULVIC ACID CONSUMPTION IN METRIC TON, EUROPE, 2017 - 2029
- Figure 43:
- FULVIC ACID CONSUMPTION IN USD, EUROPE, 2017 - 2029
- Figure 44:
- FULVIC ACID CONSUMPTION VALUE BY CROP TYPE IN %, EUROPE, 2022 VS 2029
- Figure 45:
- HUMIC ACID CONSUMPTION IN METRIC TON, EUROPE, 2017 - 2029
- Figure 46:
- HUMIC ACID CONSUMPTION IN USD, EUROPE, 2017 - 2029
- Figure 47:
- HUMIC ACID CONSUMPTION VALUE BY CROP TYPE IN %, EUROPE, 2022 VS 2029
- Figure 48:
- PROTEIN HYDROLYSATES CONSUMPTION IN METRIC TON, EUROPE, 2017 - 2029
- Figure 49:
- PROTEIN HYDROLYSATES CONSUMPTION IN USD, EUROPE, 2017 - 2029
- Figure 50:
- PROTEIN HYDROLYSATES CONSUMPTION VALUE BY CROP TYPE IN %, EUROPE, 2022 VS 2029
- Figure 51:
- SEAWEED EXTRACTS CONSUMPTION IN METRIC TON, EUROPE, 2017 - 2029
- Figure 52:
- SEAWEED EXTRACTS CONSUMPTION IN USD, EUROPE, 2017 - 2029
- Figure 53:
- SEAWEED EXTRACTS CONSUMPTION VALUE BY CROP TYPE IN %, EUROPE, 2022 VS 2029
- Figure 54:
- OTHER BIOSTIMULANTS CONSUMPTION IN METRIC TON, EUROPE, 2017 - 2029
- Figure 55:
- OTHER BIOSTIMULANTS CONSUMPTION IN USD, EUROPE, 2017 - 2029
- Figure 56:
- OTHER BIOSTIMULANTS CONSUMPTION VALUE BY CROP TYPE IN %, EUROPE, 2022 VS 2029
- Figure 57:
- ORGANIC FERTILIZER CONSUMPTION IN METRIC TON, EUROPE, 2017 - 2029
- Figure 58:
- ORGANIC FERTILIZER CONSUMPTION IN USD, EUROPE, 2017 - 2029
- Figure 59:
- ORGANIC FERTILIZER CONSUMPTION VOLUME BY FORM IN %, EUROPE, 2017 VS 2023 VS 2029
- Figure 60:
- ORGANIC FERTILIZER CONSUMPTION VALUE BY FORM IN %, EUROPE, 2017 VS 2023 VS 2029
- Figure 61:
- MANURE CONSUMPTION IN METRIC TON, EUROPE, 2017 - 2029
- Figure 62:
- MANURE CONSUMPTION IN USD, EUROPE, 2017 - 2029
- Figure 63:
- MANURE CONSUMPTION VALUE BY CROP TYPE IN %, EUROPE, 2022 VS 2029
- Figure 64:
- MEAL BASED FERTILIZERS CONSUMPTION IN METRIC TON, EUROPE, 2017 - 2029
- Figure 65:
- MEAL BASED FERTILIZERS CONSUMPTION IN USD, EUROPE, 2017 - 2029
- Figure 66:
- MEAL BASED FERTILIZERS CONSUMPTION VALUE BY CROP TYPE IN %, EUROPE, 2022 VS 2029
- Figure 67:
- OILCAKES CONSUMPTION IN METRIC TON, EUROPE, 2017 - 2029
- Figure 68:
- OILCAKES CONSUMPTION IN USD, EUROPE, 2017 - 2029
- Figure 69:
- OILCAKES CONSUMPTION VALUE BY CROP TYPE IN %, EUROPE, 2022 VS 2029
- Figure 70:
- OTHER ORGANIC FERTILIZERS CONSUMPTION IN METRIC TON, EUROPE, 2017 - 2029
- Figure 71:
- OTHER ORGANIC FERTILIZERS CONSUMPTION IN USD, EUROPE, 2017 - 2029
- Figure 72:
- OTHER ORGANIC FERTILIZERS CONSUMPTION VALUE BY CROP TYPE IN %, EUROPE, 2022 VS 2029
- Figure 73:
- CROP PROTECTION CONSUMPTION BY TYPE IN METRIC TON, EUROPE, 2017 - 2029
- Figure 74:
- CROP PROTECTION CONSUMPTION BY TYPE IN USD, EUROPE, 2017 - 2029
- Figure 75:
- CROP PROTECTION CONSUMPTION VOLUME BY TYPE IN %, EUROPE, 2017 VS 2023 VS 2029
- Figure 76:
- CROP PROTECTION CONSUMPTION VALUE BY TYPE IN %, EUROPE, 2017 VS 2023 VS 2029
- Figure 77:
- BIOCONTROL AGENTS CONSUMPTION IN GRAM, EUROPE, 2017 - 2029
- Figure 78:
- BIOCONTROL AGENTS CONSUMPTION IN USD, EUROPE, 2017 - 2029
- Figure 79:
- BIOCONTROL AGENTS CONSUMPTION VOLUME BY FORM IN %, EUROPE, 2017 VS 2023 VS 2029
- Figure 80:
- BIOCONTROL AGENTS CONSUMPTION VALUE BY FORM IN %, EUROPE, 2017 VS 2023 VS 2029
- Figure 81:
- MACROBIALS CONSUMPTION IN GRAM, EUROPE, 2017 - 2029
- Figure 82:
- MACROBIALS CONSUMPTION IN USD, EUROPE, 2017 - 2029
- Figure 83:
- MACROBIALS CONSUMPTION VALUE BY CROP TYPE IN %, EUROPE, 2022 VS 2029
- Figure 84:
- MICROBIALS CONSUMPTION IN GRAM, EUROPE, 2017 - 2029
- Figure 85:
- MICROBIALS CONSUMPTION IN USD, EUROPE, 2017 - 2029
- Figure 86:
- MICROBIALS CONSUMPTION VALUE BY CROP TYPE IN %, EUROPE, 2022 VS 2029
- Figure 87:
- BIOPESTICIDES CONSUMPTION IN METRIC TON, EUROPE, 2017 - 2029
- Figure 88:
- BIOPESTICIDES CONSUMPTION IN USD, EUROPE, 2017 - 2029
- Figure 89:
- BIOPESTICIDES CONSUMPTION VOLUME BY FORM IN %, EUROPE, 2017 VS 2023 VS 2029
- Figure 90:
- BIOPESTICIDES CONSUMPTION VALUE BY FORM IN %, EUROPE, 2017 VS 2023 VS 2029
- Figure 91:
- BIOFUNGICIDES CONSUMPTION IN METRIC TON, EUROPE, 2017 - 2029
- Figure 92:
- BIOFUNGICIDES CONSUMPTION IN USD, EUROPE, 2017 - 2029
- Figure 93:
- BIOFUNGICIDES CONSUMPTION VALUE BY CROP TYPE IN %, EUROPE, 2022 VS 2029
- Figure 94:
- BIOHERBICIDES CONSUMPTION IN METRIC TON, EUROPE, 2017 - 2029
- Figure 95:
- BIOHERBICIDES CONSUMPTION IN USD, EUROPE, 2017 - 2029
- Figure 96:
- BIOHERBICIDES CONSUMPTION VALUE BY CROP TYPE IN %, EUROPE, 2022 VS 2029
- Figure 97:
- BIOINSECTICIDES CONSUMPTION IN METRIC TON, EUROPE, 2017 - 2029
- Figure 98:
- BIOINSECTICIDES CONSUMPTION IN USD, EUROPE, 2017 - 2029
- Figure 99:
- BIOINSECTICIDES CONSUMPTION VALUE BY CROP TYPE IN %, EUROPE, 2022 VS 2029
- Figure 100:
- OTHER BIOPESTICIDES CONSUMPTION IN METRIC TON, EUROPE, 2017 - 2029
- Figure 101:
- OTHER BIOPESTICIDES CONSUMPTION IN USD, EUROPE, 2017 - 2029
- Figure 102:
- OTHER BIOPESTICIDES CONSUMPTION VALUE BY CROP TYPE IN %, EUROPE, 2022 VS 2029
- Figure 103:
- ORGANIC FERTILIZER CONSUMPTION IN METRIC TON, EUROPE, 2017 - 2029
- Figure 104:
- ORGANIC FERTILIZER CONSUMPTION IN USD, EUROPE, 2017 - 2029
- Figure 105:
- ORGANIC FERTILIZER CONSUMPTION VOLUME BY CROP TYPE IN %, EUROPE, 2017 VS 2023 VS 2029
- Figure 106:
- ORGANIC FERTILIZER CONSUMPTION VALUE BY CROP TYPE IN %, EUROPE, 2017 VS 2023 VS 2029
- Figure 107:
- ORGANIC FERTILIZER CONSUMPTION BY CASH CROPS IN METRIC TON, EUROPE, 2017 - 2029
- Figure 108:
- ORGANIC FERTILIZER CONSUMPTION BY CASH CROPS IN USD, EUROPE, 2017 - 2029
- Figure 109:
- ORGANIC FERTILIZER CONSUMPTION VALUE BY FUNCTION IN %, EUROPE, 2022 VS 2029
- Figure 110:
- ORGANIC FERTILIZER CONSUMPTION BY HORTICULTURAL CROPS IN METRIC TON, EUROPE, 2017 - 2029
- Figure 111:
- ORGANIC FERTILIZER CONSUMPTION BY HORTICULTURAL CROPS IN USD, EUROPE, 2017 - 2029
- Figure 112:
- ORGANIC FERTILIZER CONSUMPTION VALUE BY FUNCTION IN %, EUROPE, 2022 VS 2029
- Figure 113:
- ORGANIC FERTILIZER CONSUMPTION BY ROW CROPS IN METRIC TON, EUROPE, 2017 - 2029
- Figure 114:
- ORGANIC FERTILIZER CONSUMPTION BY ROW CROPS IN USD, EUROPE, 2017 - 2029
- Figure 115:
- ORGANIC FERTILIZER CONSUMPTION VALUE BY FUNCTION IN %, EUROPE, 2022 VS 2029
- Figure 116:
- ORGANIC FERTILIZER CONSUMPTION IN METRIC TON, EUROPE, 2017 - 2029
- Figure 117:
- ORGANIC FERTILIZER CONSUMPTION IN USD, EUROPE, 2017 - 2029
- Figure 118:
- ORGANIC FERTILIZER CONSUMPTION VOLUME BY COUNTRY IN %, EUROPE, 2017 VS 2023 VS 2029
- Figure 119:
- ORGANIC FERTILIZER CONSUMPTION VALUE BY COUNTRY IN %, EUROPE, 2017 VS 2023 VS 2029
- Figure 120:
- ORGANIC FERTILIZER CONSUMPTION IN METRIC TON, FRANCE, 2017 - 2029
- Figure 121:
- ORGANIC FERTILIZER CONSUMPTION IN USD, FRANCE, 2017 - 2029
- Figure 122:
- ORGANIC FERTILIZER CONSUMPTION VALUE BY FUNCTION IN %, FRANCE, 2022 VS 2029
- Figure 123:
- ORGANIC FERTILIZER CONSUMPTION IN METRIC TON, GERMANY, 2017 - 2029
- Figure 124:
- ORGANIC FERTILIZER CONSUMPTION IN USD, GERMANY, 2017 - 2029
- Figure 125:
- ORGANIC FERTILIZER CONSUMPTION VALUE BY FUNCTION IN %, GERMANY, 2022 VS 2029
- Figure 126:
- ORGANIC FERTILIZER CONSUMPTION IN METRIC TON, ITALY, 2017 - 2029
- Figure 127:
- ORGANIC FERTILIZER CONSUMPTION IN USD, ITALY, 2017 - 2029
- Figure 128:
- ORGANIC FERTILIZER CONSUMPTION VALUE BY FUNCTION IN %, ITALY, 2022 VS 2029
- Figure 129:
- ORGANIC FERTILIZER CONSUMPTION IN METRIC TON, NETHERLANDS, 2017 - 2029
- Figure 130:
- ORGANIC FERTILIZER CONSUMPTION IN USD, NETHERLANDS, 2017 - 2029
- Figure 131:
- ORGANIC FERTILIZER CONSUMPTION VALUE BY FUNCTION IN %, NETHERLANDS, 2022 VS 2029
- Figure 132:
- ORGANIC FERTILIZER CONSUMPTION IN METRIC TON, RUSSIA, 2017 - 2029
- Figure 133:
- ORGANIC FERTILIZER CONSUMPTION IN USD, RUSSIA, 2017 - 2029
- Figure 134:
- ORGANIC FERTILIZER CONSUMPTION VALUE BY FUNCTION IN %, RUSSIA, 2022 VS 2029
- Figure 135:
- ORGANIC FERTILIZER CONSUMPTION IN METRIC TON, SPAIN, 2017 - 2029
- Figure 136:
- ORGANIC FERTILIZER CONSUMPTION IN USD, SPAIN, 2017 - 2029
- Figure 137:
- ORGANIC FERTILIZER CONSUMPTION VALUE BY FUNCTION IN %, SPAIN, 2022 VS 2029
- Figure 138:
- ORGANIC FERTILIZER CONSUMPTION IN METRIC TON, TURKEY, 2017 - 2029
- Figure 139:
- ORGANIC FERTILIZER CONSUMPTION IN USD, TURKEY, 2017 - 2029
- Figure 140:
- ORGANIC FERTILIZER CONSUMPTION VALUE BY FUNCTION IN %, TURKEY, 2022 VS 2029
- Figure 141:
- ORGANIC FERTILIZER CONSUMPTION IN METRIC TON, UNITED KINGDOM, 2017 - 2029
- Figure 142:
- ORGANIC FERTILIZER CONSUMPTION IN USD, UNITED KINGDOM, 2017 - 2029
- Figure 143:
- ORGANIC FERTILIZER CONSUMPTION VALUE BY FUNCTION IN %, UNITED KINGDOM, 2022 VS 2029
- Figure 144:
- ORGANIC FERTILIZER CONSUMPTION IN METRIC TON, REST OF EUROPE, 2017 - 2029
- Figure 145:
- ORGANIC FERTILIZER CONSUMPTION IN USD, REST OF EUROPE, 2017 - 2029
- Figure 146:
- ORGANIC FERTILIZER CONSUMPTION VALUE BY FUNCTION IN %, REST OF EUROPE, 2022 VS 2029
- Figure 147:
- EUROPE AGRICULTURAL BIOLOGICALS MARKET, MOST ACTIVE COMPANIES, BY NUMBER OF STRATEGIC MOVES, 2017-2022
- Figure 148:
- EUROPE AGRICULTURAL BIOLOGICALS MARKET, MOST ADOPTED STRATEGIES, 2017-2022
- Figure 149:
- EUROPE AGRICULTURAL BIOLOGICALS MARKET SHARE(%), BY MAJOR PLAYERS
Europe Agricultural Biologicals Industry Segmentation
Crop Nutrition, Crop Protection are covered as segments by Function. Cash Crops, Horticultural Crops, Row Crops are covered as segments by Crop Type. France, Germany, Italy, Netherlands, Russia, Spain, Turkey, United Kingdom are covered as segments by Country.| Function | Crop Nutrition | Biofertilizer | Azospirillum | |
| Azotobacter | ||||
| Mycorrhiza | ||||
| Phosphate Solubilizing Bacteria | ||||
| Rhizobium | ||||
| Other Biofertilizers | ||||
| Biostimulants | Amino Acids | |||
| Fulvic Acid | ||||
| Humic Acid | ||||
| Protein Hydrolysates | ||||
| Seaweed Extracts | ||||
| Other Biostimulants | ||||
| Organic Fertilizer | Manure | |||
| Meal Based Fertilizers | ||||
| Oilcakes | ||||
| Other Organic Fertilizers | ||||
| Crop Protection | Biocontrol Agents | Macrobials | ||
| Microbials | ||||
| Biopesticides | Biofungicides | |||
| Bioherbicides | ||||
| Bioinsecticides | ||||
| Other Biopesticides | ||||
| Crop Type | Cash Crops | |||
| Horticultural Crops | ||||
| Row Crops | ||||
| Country | France | |||
| Germany | ||||
| Italy | ||||
| Netherlands | ||||
| Russia | ||||
| Spain | ||||
| Turkey | ||||
| United Kingdom | ||||
| Rest of Europe | ||||
Need A Different Region or Segment?
Customize Now
Market Definition
- AVERAGE DOSAGE RATE - The average application rate is the average volume of agricultural biologicals applied per hectare of farmland in the respective region/country.
- CROP TYPE - Crop type includes Row crops (Cereals, Pulses, Oilseeds), Horticultural Crops (Fruits and vegetables) and Cash Crops (Plantation Crops, Fibre Crops and Other Industrial Crops)
- FUNCTION - Agricultural biological products provide crops with essential nutrients, prevent or control abiotic & biotic stresses, and enhance soil quality.
- TYPE - The Crop Nutrition function of agricultural biologicals includes organic fertilizer and Biofertilizer, whereas the Crop Protection function includes Biostimulants, Biopesticides and Biocontrol Agents.
| Keyword | Definition |
|---|---|
| Cash Crops | Cash crops are non-consumable crops sold as a whole or part of the crop to manufacture end-products to make a profit. |
| Integrated Pest Management (IPM) | IPM is an environment-friendly and sustainable approach to control pests in various crops. It involves a combination of methods, including biological controls, cultural practices, and selective use of pesticides. |
| Bacterial biocontrol agents | Bacteria used to control pests and diseases in crops. They work by producing toxins harmful to the target pests or competing with them for nutrients and space in the growing environment. Some examples of commonly used bacterial biocontrol agents include Bacillus thuringiensis (Bt), Pseudomonas fluorescens, and Streptomyces spp. |
| Plant Protection Product (PPP) | A plant protection product is a formulation applied to crops to protect from pests, such as weeds, diseases, or insects. They contain one or more active substances with other co-formulants such as solvents, carriers, inert material, wetting agents or adjuvants formulated to give optimum product efficacy. |
| Pathogen | A pathogen is an organism causing disease to its host, with the severity of the disease symptoms. |
| Parasitoids | Parasitoids are insects that lay their eggs on or within the host insect, with their larvae feeding on the host insect. In agriculture, parasitoids can be used as a form of biological pest control, as they help to control pest damage to crops and decrease the need for chemical pesticides. |
| Entomopathogenic Nematodes (EPN) | Entomopathogenic nematodes are parasitic roundworms that infect and kill pests by releasing bacteria from their gut. Entomopathogenic nematodes are a form of biocontrol agents used in agriculture. |
| Vesicular-arbuscular mycorrhiza (VAM) | VAM fungi are mycorrhizal species of fungus. They live in the roots of different higher-order plants. They develop a symbiotic relationship with the plants in the roots of these plants. |
| Fungal biocontrol agents | Fungal biocontrol agents are the beneficial fungi that control plant pests and diseases. They are an alternative to chemical pesticides. They infect and kill the pests or compete with pathogenic fungi for nutrients and space. |
| Biofertilizers | Biofertilizers contain beneficial microorganisms that enhance soil fertility and promote plant growth. |
| Biopesticides | Biopesticides are natural/bio-based compounds used to manage agricultural pests using specific biological effects. |
| Predators | Predators in agriculture are the organisms that feed on pests and help control pest damage to the crops. Some common predator species used in agriculture include ladybugs, lacewings, and predatory mites. |
| Biocontrol agents | Biocontrol agents are living organisms used to control pests and diseases in agriculture. They are alternatives to chemical pesticides and are known for their lesser impact on the environment and human health. |
| Organic Fertilizers | Organic fertilizer is composed of animal or vegetable matter used alone or in combination with one or more non-synthetically derived elements or compounds used for soil fertility and plant growth. |
| Protein hydrolysates (PHs) | Protein hydrolysate-based biostimulants contain free amino acids, oligopeptides, and polypeptides produced by enzymatic or chemical hydrolysis of proteins, primarily from vegetal or animal sources. |
| Biostimulants/Plant Growth Regulators (PGR) | Biostimulants/Plant Growth Regulators (PGR) are substances derived from natural resources to enhance plant growth and health by stimulating plant processes (metabolism). |
| Soil Amendments | Soil Amendments are substances applied to soil that improve soil health, such as soil fertility and soil structure. |
| Seaweed Extract | Seaweed extracts are rich in micro and macronutrients, proteins, polysaccharides, polyphenols, phytohormones, and osmolytes. These substances boost seed germination and crop establishment, total plant growth and productivity. |
| Compounds related to biocontrol and/or promoting growth (CRBPG) | Compounds related to biocontrol or promoting growth (CRBPG) are the ability of a bacteria to produce compounds for phytopathogen biocontrol and plant growth promotion. |
| Symbiotic Nitrogen-Fixing Bacteria | Symbiotic nitrogen-fixing bacteria such as Rhizobium obtain food and shelter from the host, and in return, they help by providing fixed nitrogen to the plants. |
| Nitrogen Fixation | Nitrogen fixation is a chemical process in soil which converts molecular nitrogen into ammonia or related nitrogenous compounds. |
| ARS (Agricultural Research Service) | ARS is the U.S. Department of Agriculture's chief scientific in-house research agency. It aims to find solutions to agricultural problems faced by the farmers in the country. |
| Phytosanitary Regulations | Phytosanitary regulations imposed by the respective government bodies check or prohibit the importation and marketing of certain insects, plant species, or products of these plants to prevent the introduction or spread of new plant pests or pathogens. |
| Ectomycorrhizae (ECM) | Ectomycorrhiza (ECM) is a symbiotic interaction of fungi with the feeder roots of higher plants in which both the plant and the fungi benefit through the association for survival. |
Need More Details on Market Definition?
Ask a Question
Research Methodology
Mordor Intelligence follows a four-step methodology in all our reports.
- Step-1: Identify Key Variables: In order to build a robust forecasting methodology, the variables and factors identified in Step-1 are tested against available historical market numbers. Through an iterative process, the variables required for market forecast are set and the model is built on the basis of these variables.
- Step-2: Build a Market Model: Market-size estimations for the forecast years are in nominal terms. Inflation is not a part of the pricing, and the average selling price (ASP) is kept constant throughout the forecast period.
- Step-3: Validate and Finalize: In this important step, all market numbers, variables and analyst calls are validated through an extensive network of primary research experts from the market studied. The respondents are selected across levels and functions to generate a holistic picture of the market studied.
- Step-4: Research Outputs: Syndicated Reports, Custom Consulting Assignments, Databases & Subscription Platforms.

Get More Details On Research Methodology
Download PDF


