
Ethylene Oxide Market Size and Share
Market Overview
| Study Period | 2020 - 2031 |
|---|---|
| Market Volume (2026) | 38.55 Million tons |
| Market Volume (2031) | 45.44 Million tons |
| Growth Rate (2026 - 2031) | 3.34 % |
| Fastest Growing Market | Asia Pacific |
| Largest Market | Asia Pacific |
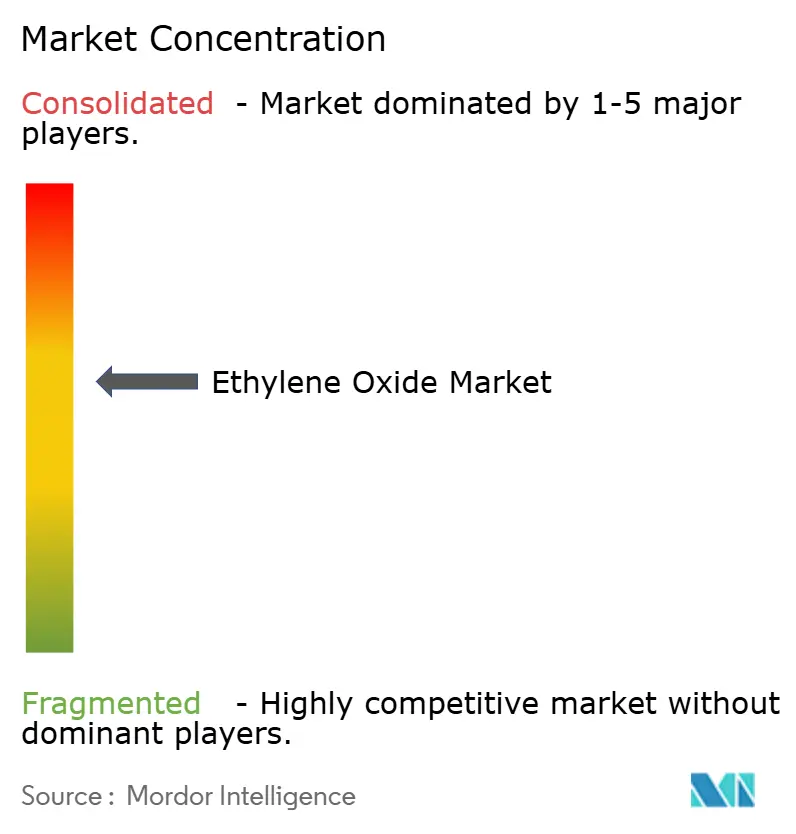
| Market Concentration | Medium |
Major Players *Disclaimer: Major Players sorted in no particular order Image © Mordor Intelligence. Reuse requires attribution under CC BY 4.0. | |
Ethylene Oxide Market Analysis by Mordor Intelligence
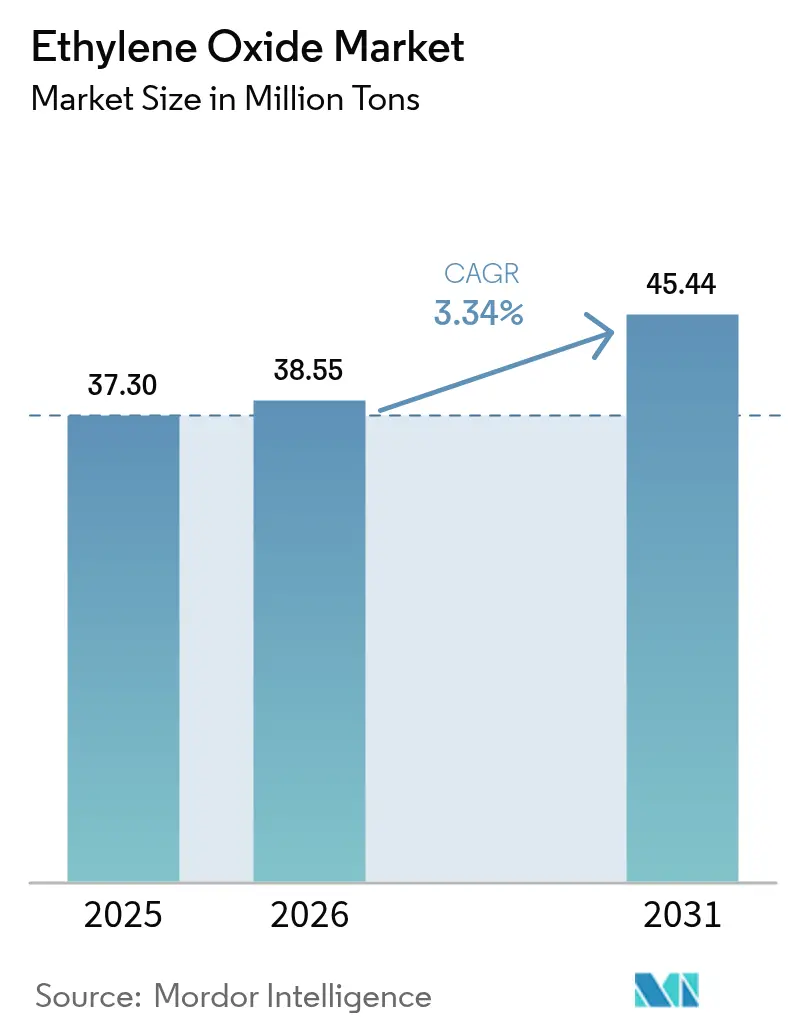
The Ethylene Oxide market size is expected to grow from 37.30 Million tons in 2025 to 38.55 Million tons in 2026 and is forecast to reach 45.44 Million tons by 2031 at 3.34% CAGR over 2026-2031. Demand stems from its versatility as a chemical intermediate, with polyester fibers, PET resins, surfactants, ethanolamines, and sterilants underpinning consumption growth. Expansion of polyester-based textiles, wider adoption of PET for lightweight food and beverage packaging, and regulatory-driven investments in medical device sterilization facilities remain the core drivers. Rapid uptake of bio-ethylene feedstock, rising investment in emission-control technology, and the spread of circular-economy initiatives are reshaping sourcing strategies and opening new revenue pools. Competitive dynamics favor vertically integrated producers that can balance feedstock volatility, comply with tightening emission limits, and develop specialty derivatives.
Key Report Takeaways
- By derivative type, ethylene glycols held 75.02% of the ethylene oxide market share in 2025; ethanolamines record the fastest forecast growth at a 3.55% CAGR through 2031.
- By application, Polyester Fiber and PET Resins led with 27.86% revenue share in 2025, while sterilization and fumigation are poised for the highest 3.67% CAGR to 2031.
- By end-user industry, the textile sector commanded 29.74% of the 2025 total, whereas the “other industries” category shows the quickest 3.91% CAGR outlook.
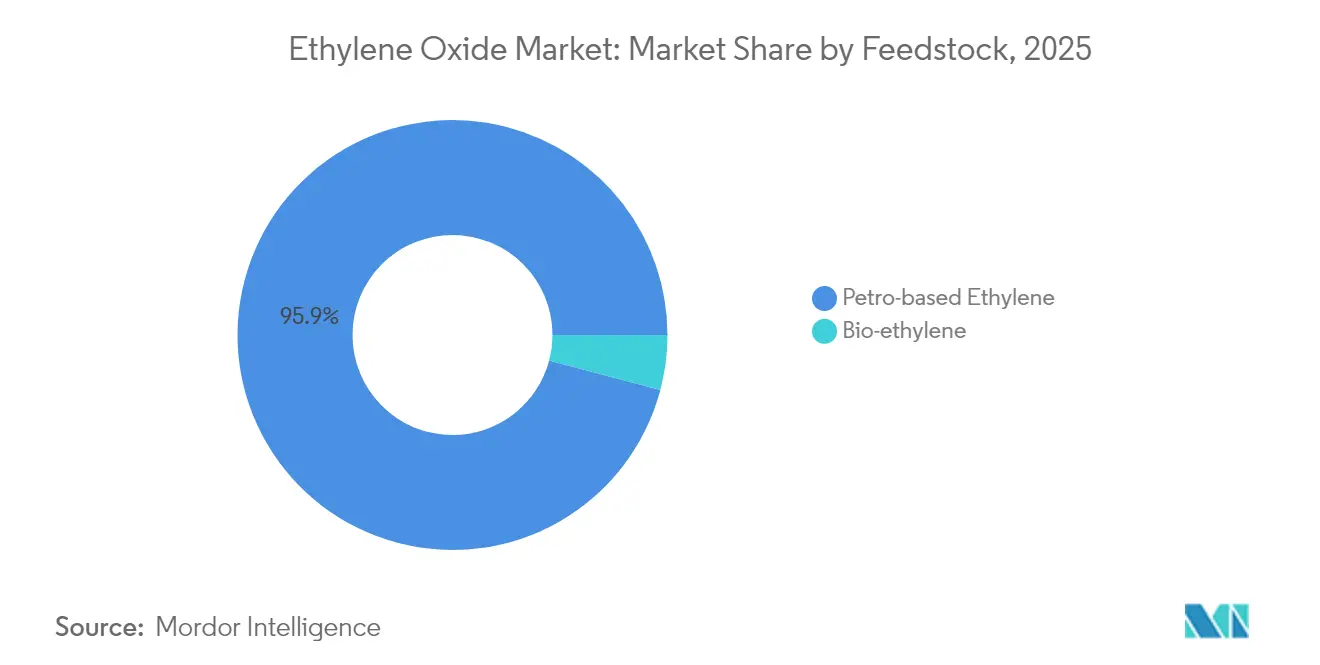
- By feedstock, petro-based ethylene represented 95.88% of volumes in 2025, but bio-ethylene exhibits the fastest 4.72% CAGR to 2031.
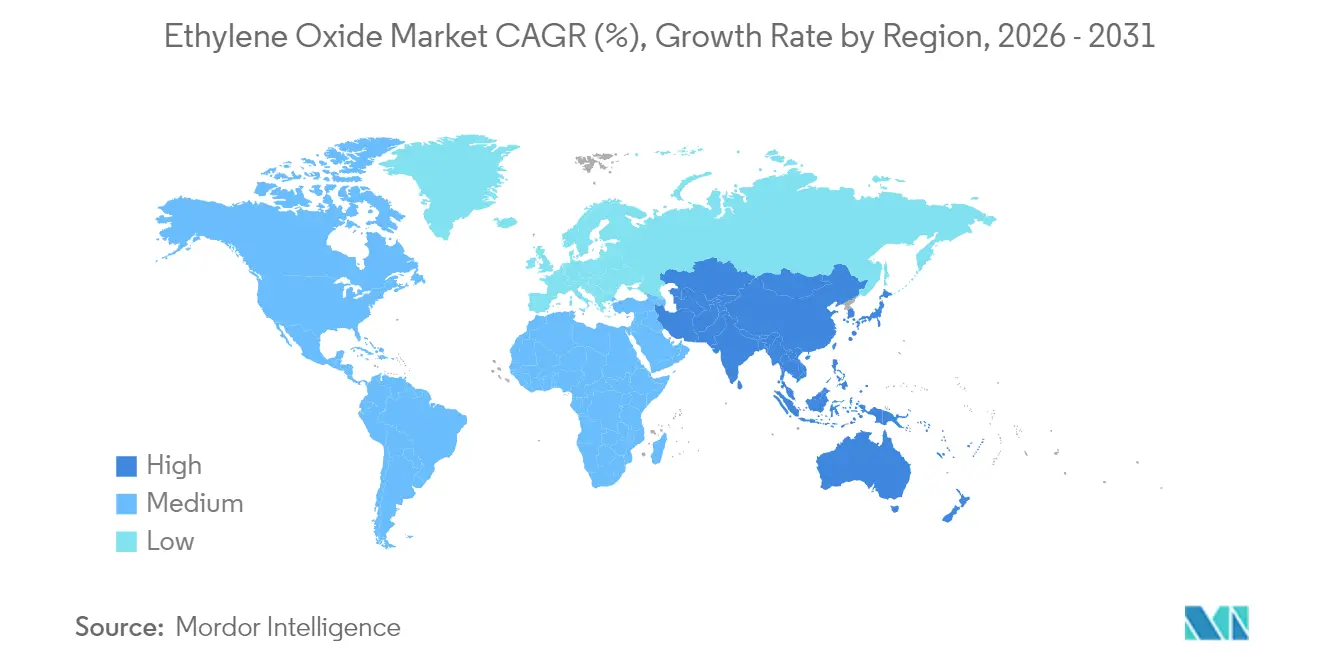
- By geography, Asia-Pacific contributed 50.72% of 2025 demand and is set to grow at 3.68% CAGR through 2031.
Note: Market size and forecast figures in this report are generated using Mordor Intelligence’s proprietary estimation framework, updated with the latest available data and insights as of 2026.
Market Trends and Insights
Drivers Impact Analysis of Ethylene Oxide Market*
| Driver | (~) % Impact on CAGR Forecast | Geographic Relevance | Impact Timeline |
|---|---|---|---|
| Growing Usage of PET in the Food and Beverage Industry | +0.80% | Global, highest in Asia-Pacific | Medium term (2-4 years) |
| Increasing Demand for Household and Personal Care Products | +0.50% | North America and Europe | Medium term (2-4 years) |
| Increasing Utilziation in Medical Device Sterilization | +0.70% | North America, global supply chains | Short term (≤ 2 years) |
| Growing Demand from Textile and Apparel Industry | +0.90% | Asia-Pacific | Medium term (2-4 years) |
| Increasing Utilization from the Agriculture Sector | +0.40% | Emerging markets | Long term (≥ 4 years) |
| Source: Mordor Intelligence | |||
Growing Usage of PET in the Food and Beverage Industry
PET packaging adoption is accelerating because brand owners favor lightweight, recyclable solutions that preserve product integrity. Monoethylene glycol derived from ethylene oxide constitutes nearly 90% of the ethylene glycol pool used for PET polymerization, causing direct pull-through on upstream demand. Large resin producers are backing chemical-recycling platforms that depolymerize post-consumer PET into monomers with yields above 90%, enabling circular supply chains while keeping ethylene oxide volumes steady. Companies such as Dow have earmarked multi-million-metric-ton programs to deliver circular and renewable plastics annually by 2030. These initiatives strengthen long-term demand visibility even as the product mix shifts toward recycled grades.
Increasing Demand for Household and Personal Care Products
Surfactants and detergents formulated with ethoxylates and ethanolamines deliver superior cleaning efficiency, especially in hard-water regions. Consumer preference for eco-friendly ingredients is prompting producers such as Nouryon to certify green ethylene oxide derivatives under the ISCC PLUS scheme[1]. Switching from alkylphenol to fatty-alcohol ethoxylates aligns with forthcoming biodegradability regulations while sustaining performance. Capacity additions in Europe and North America are timed to capture this demand uptick as private-label cleaning brands gain retail shelf space.
Increasing Utilization in Medical Device Sterilization
Roughly 50% of the 20 billion sterile medical devices sold annually in the United States depend on ethylene oxide because it penetrates complex geometries without degrading polymers. The EPA’s 2024 emission rule requires a 99.9% removal efficiency from facilities using 10-30 tons per year, spurring investments in advanced catalytic scrubbers and continuous monitoring systems. Transitional FDA guidance issued in late 2024 provides compliance flexibility, thereby preventing supply disruptions while innovations scale. Market participants with proprietary abatement technologies gain a competitive edge under these tighter rules.
Growing Demand from Textile and Apparel Industry
Polyester fibers dominate global apparel due to durability and cost advantages, with Asia-Pacific mills accounting for the majority of new capacity. Chemical recycling processes such as microwave-assisted glycolysis can return polyester and spandex textiles to monomers within 15 minutes and achieve an 88% circularity rate. Although circular flows may displace a fraction of virgin monoethylene glycol, regional fiber demand still outpaces recycling supply, maintaining positive volume growth for the ethylene oxide market.
Restraints Impact Analysis of Ethylene Oxide Market*
| Restraint | (~) % Impact on CAGR Forecast | Geographic Relevance | Impact Timeline |
|---|---|---|---|
| Health and Environmental Effects over High Exposure | -0.70% | North America and Europe | Short term (≤ 2 years) |
| Volatility of Ethylene Feedstock Prices | -0.50% | Europe highest, global effect | Short term (≤ 2 years) |
| High Production Cost | -0.30% | High energy-price regions | Medium term (2-4 years) |
| Source: Mordor Intelligence | |||
Health and Environmental Effects over High Exposure
Ethylene oxide is classified as carcinogenic, prompting the EPA’s January 2025 interim decision that cuts worker exposure limits from 0.5 ppm by 2028 down to 0.1 ppm by 2035. Compliance demands costly engineering controls, personal monitoring, and capital upgrades. Some healthcare device makers are accelerating the qualification of alternative sterilization methods, including gamma radiation, vaporized hydrogen peroxide, and nitrogen dioxide. While these substitutes will erode specific volumes, ethylene oxide remains indispensable for heat-sensitive devices with intricate lumens.
Volatility of Ethylene Feedstock Prices
Global ethylene spot prices fluctuate with crude oil swings, logistics bottlenecks, and regional feedstock spreads. In July 2024, US ethylene prices spiked amid scheduled cracker turnarounds, expanding the advantage of low-cost shale-based producers over naphtha-dependent European peers. Freight rates climbed due to security issues in Middle-East shipping lanes and Panama Canal water shortages, heightening delivered-cost dispersion. Producers with integrated steam crackers and geographic diversification can better absorb this volatility than merchant ethylene oxide buyers.
*Our forecasts treat driver/restraint impacts as directional, not additive. The impact forecasts reflect baseline growth, mix effects, and variable interactions.
Ethylene Oxide Market Segment Analysis
By Derivative:
Glycols Dominate While Ethanolamines AccelerateEthylene glycols formed the bedrock of the ethylene oxide market in 2025, capturing 75.02% share as polyester fiber and PET resin output scaled in Asia-Pacific. Price volatility has returned following upstream supply disruptions, pushing Asia-based buyers to secure long-term contracts with integrated producers. In parallel, bio-MEG pilots are gaining traction as brand owners seek lower-carbon packaging options.
Ethanolamines contribute a smaller volume but post the highest 3.55% CAGR to 2031, driven by agrochemicals, gas treatment, and personal-care demand. BASF’s Antwerp debottlenecking raised global alkyl ethanolamine capacity by nearly 30% to more than 140,000 t per year, underscoring the segment’s strategic value. Rising glyphosate herbicide volumes in Latin America and Asia sustain monoethanolamine pull-through, while triethanolamine sees new opportunities in CO₂ capture solvents. Strong downstream diversification shields this derivative class from single-industry cyclicality.


By Application:
PET Resins Lead Amid Sterilization GrowthPET resins and polyester fibers absorbed 27.86% of ethylene oxide demand in 2025. The ethylene oxide market size linked to PET is expected to grow steadily as beverage companies transition from glass and metal to lightweight PET bottles. Innovative depolymerization pathways such as dimethyl-carbonate-aided methanolysis enable greater than 90% dimethyl terephthalate yields, opening high-purity recycled PET streams. Over the forecast horizon, virgin demand moderates in developed regions yet expands in fast-growing economies where recycling infrastructure remains nascent.
Sterilization and fumigation ranked as the fastest-growing application at 3.67% CAGR. Approximately 50,000 distinct medical devices rely on ethylene oxide sterilization, preserving thermolabile polymers that cannot withstand gamma or electron-beam radiation. Even with stringent emissions limits, demand persists because alternative modalities often fail to penetrate complex packaging or achieve required sterility assurance levels. Investment in catalytic oxidation units and continuous emissions monitoring allows compliant operations, sustaining growth in this niche.
By End-user Industry:
Textile Sector Maintains LeadershipThe textile industry consumed 29.74% of 2025 volumes as polyester remained the dominant fiber category. The ethylene oxide market share for textiles reflects strong Asian production bases where blended fabrics and fast fashion drive continuous polymer demand. Advanced chemical-recycling lines are being integrated into large Chinese mills, enabling recovery of monoethylene glycol and terephthalic acid at scale. This circular approach moderates virgin demand growth in the long term but enhances supply security in closed-loop ecosystems.
“Other industries” represent the fastest growth at 3.91% CAGR, reflecting the broad utility of ethylene oxide derivatives in lubricants, coolants, construction chemicals, and specialty pharmaceuticals. The pharmaceutical sector benefits doubly from ethylene oxide’s function as both a sterilant and a precursor for excipients such as polyethylene glycol. Personal-care manufacturers are reformulating toward certified sustainable derivatives, accentuating demand resilience.

By Feedstock:
Bio-ethylene Emerges as a Growth DriverPetro-based ethylene held 95.88% of feedstock share in 2025, leveraging efficient steam crackers tied to low-cost natural-gas liquids in North America and the Middle East. Despite dominance, the segment faces carbon-pricing and energy-cost headwinds in Europe, triggering rationalization of older naphtha units. Diversified producers hedge exposure by co-processing renewable feedstocks or using mass-balance certification systems.
Bio-ethylene grows at 4.72% CAGR through 2031, driven by Brazilian sugarcane ethanol routes that can generate negative cradle-to-gate carbon footprints when biogenic carbon storage is credited. Academic breakthroughs demonstrate two-step dehydration-epoxidation cycles delivering 57% ethylene oxide selectivity at 15% conversion under chemical-looping conditions, hinting at future on-demand small-scale production. Commercial viability hinges on feedstock availability and downstream certification incentives.
Geography Analysis
APAC Ethylene Oxide Market
Asia-Pacific remained the largest ethylene oxide market in 2025, supplying 50.72% of global demand and expanding at a region-leading 3.68% CAGR to 2031. China anchors capacity additions with BASF’s Zhanjiang Verbund complex slated for start-up in 2025. India’s production grows alongside local polyester fiber expansion, supported by government manufacturing incentives. Regional governments tighten environmental norms, but integrated complexes with advanced abatement maintain competitiveness.
North America Ethylene Oxide Market
North America benefits from shale-based ethane economics that yield some of the world’s lowest ethylene cash costs. Medical device sterilization concentration elevates domestic consumption, and INEOS’s 2024 acquisition of LyondellBasell’s Bayport unit consolidates supply in the largest single market. Compliance with EPA emission rules accelerates investment in catalytic scrubbers and real-time monitoring, setting a global technology benchmark.
Europe Ethylene Oxide Market
Europe confronts high energy prices and more stringent CO₂ targets, prompting 11 million tons of regional chemical capacity closures during 2023-2024. Collaborations such as the 2024 Clariant-OMV agreement to supply lower-carbon ethylene and ethylene oxide derivatives aim to defend market share against imports. Eastern Europe retains selective competitiveness through access to pipeline gas and established downstream polyester assets.
MEA and South America Ethylene Oxide Market
The Middle East leverages advantaged feedstock at integrated complexes, with Saudi-based producers targeting export markets in Asia. Africa sees limited local production but steady imports for detergent and agrochemical formulations. South America advances bio-ethylene projects in Brazil, positioning the subcontinent as a potential net exporter of low-carbon derivatives over the next decade.
Value Chain Analysis
The ethylene oxide value chain begins with ethylene supply (predominantly petro-based) and oxygen, followed by catalytic oxidation in dedicated EO units using silver-based catalysts. Many producers favor integrated petrochemical clusters to lower exposure to hazardous logistics and to manage feedstock swings. EO is then converted on-site or nearby into higher-volume derivatives, led by ethylene glycols (MEG/DEG/TEG) for polyester and PET, along with ethanolamines, ethoxylates and surfactants, glycol ethers, and polyethylene glycols for detergents, personal care, industrial fluids, and pharmaceuticals.
Downstream distribution often uses pipeline and short-haul bulk for integrated sites, while merchant volumes depend more on controlled tank logistics. Compliance requirements and emissions controls shape operating costs and plant layouts. Vertical integration remains a key competitive lever, illustrated by INEOS completing the acquisition of LyondellBasell's EO and derivatives business at Bayport, Texas in May 2024, which strengthened control across EO production and derivative conversion while reducing reliance on merchant procurement.
Competitive Landscape
The ethylene oxide market features vertically integrated multinationals such as BASF, Dow, SABIC, and INEOS, each controlling feedstock, oxide, and downstream derivatives. INEOS’s USD 700 million purchase of the Bayport plant expands its North American footprint and downstream surfactant presence. BASF raised Antwerp oxide capacity in 2024 and continues to integrate derivatives into high-margin specialties. Dow prioritizes circular polymers development that supports the monoethylene glycol and PET recycling demand growth.
Sustainability differentiation is rising. Dow disclosed plans to commercialize 3 million metric tons of renewable and circular solutions annually by 2030, aiming to lock key consumer-goods customers into long-term supply frameworks. Technology providers compete on advanced silver catalysts that enable higher selectivity and longer run lengths, reducing energy use and by-product formation.
Market entrants explore small-scale oxidative coupling or bio-route projects that promise modular deployment near biomass sources. Established producers counter by offering low-carbon grades under mass-balance accounting systems and investing in closed-loop take-back programs with PET recyclers. Intellectual-property barriers and economies of scale keep the industry moderately consolidated, yet regional regulatory shifts can redraw competitive positions rapidly.
Ethylene Oxide Industry Leaders
-
BASF SE
-
China Petrochemical Corporation
-
Dow
-
SABIC
-
Shell plc
- *Disclaimer: Major Players sorted in no particular order
Ethylene Oxide Market Companies Covered in this Report
- BASF SE
- China Petrochemical Corporation
- Clariant
- Dow
- Huntsman International LLC
- India Glycols Limited
- Indorama Ventures Public Company Limited
- INEOS
- LOTTE Chemical Corporation
- NIPPON SHOKUBAI CO., LTD.
- Nouryon
- PETRONAS Chemicals Group Berhad
- Reliance Industries Limited
- SABIC
- Sasol Limited
- Shell plc
Market Opportunities and Future Outlook
White-space is developing around low-carbon and mass-balance ethylene oxide and derivatives, where producers can differentiate without forcing end users to redesign formulations or qualify new chemistries. Industry actions such as the July 2024 Clariant-OMV collaboration to reduce the carbon footprint of ethylene and ethylene oxide derivatives, and the April 2026 Syensqo and Shell Chemicals Europe collaboration on mass-balanced, low-carbon ethylene oxide solutions, indicate active commercialization pathways for certified product lines. These lines map to brand-owner packaging and home-and-personal-care sourcing requirements.
A second opportunity area is building capabilities that support both supply growth and compliance in high-growth regions and regulated end uses. In China, the China-Saudi Arabia Gulei ethylene project reported progress on major ethylene oxide equipment installation in January 2026, reinforcing the move toward integrated Asia-based supply for polyester, PET, and surfactants. In the United States, the EPA published a proposed amendment in March 2026 to the 2024 NESHAP for commercial sterilization facilities, keeping emissions performance and compliance demonstration central to investment decisions. This supports ongoing demand for abatement and monitoring upgrades, and encourages EO supply chains that can document compliance for medical-device sterilization customers.
Recent Industry Developments in Ethylene Oxide Market
- April 2026: Syensqo S.A. and Shell Chemicals Europe B.V. announced a collaboration to advance mass-balanced, low-carbon ethylene oxide solutions using Shell Chemicals' lower-carbon feedstocks. The collaboration expands commercially available pathways to decarbonize EO-linked surfactants and intermediates without requiring end users to change performance specifications, supporting broader uptake of certified low-carbon grades.
- March 2026: BASF SE inaugurated its new Verbund site in Zhanjiang, China, designed to serve local customers with integrated ethylene-based value chains that include ethylene oxide and downstream surfactants and brake fluid precursors. The project strengthens Asia-Pacific supply integration and reinforces the role of large, multi-derivative complexes in managing EO safety, logistics, and cost competitiveness.
- May 2024: INEOS completed the acquisition of LyondellBasell's Ethylene Oxide and Derivatives business, including production facilities at Bayport, Texas, United States. The acquisition consolidated an integrated EO and derivatives footprint in North America and improved supply control for key downstream chains such as glycols and surfactants.
Ethylene Oxide Market Report Scope and Research Methodology
Market Definition and Coverage
For this methodology, the ethylene oxide market covers bulk ethylene oxide produced and consumed as a petrochemical intermediate, measured in physical volume at the point of production or trade (before it is converted into downstream derivatives).
Scope exclusions: Ethylene oxide derivatives (such as ethylene glycol, ethanolamines, glycol ethers, and surfactants) are excluded from the market total and are treated only as demand drivers.
Segments Covered in This Report
- By Derivative
- Ethylene Glycols
- Monoethylene Glycol (MEG)
- Diethylene Glycol (DEG)
- Triethylene Glycol (TEG)
- Ethoxylates
- Ethanolamines
- Glycol Ethers
- Polyethylene Glycol
- Other Derivatives
- Ethylene Glycols
- By Application
- Polyester Fiber and PET Resins
- Surfactants and Detergents
- Sterilization and Fumigation
- Coolant and Antifreeze
- Pharmaceuticals Excipients
- Other Applications
- By End-user Industry
- Automotive
- Agrochemicals
- Food and Beverage
- Textile
- Personal Care
- Pharmaceuticals
- Detergents
- Others End user Industries
- By Feedstock
- Petro-based Ethylene
- Bio-ethylene
- By Geography
- Asia-Pacific
- China
- India
- Japan
- South Korea
- Rest of Asia-Pacific
- North America
- United States
- Canada
- Mexico
- Europe
- Germany
- United Kingdom
- France
- Italy
- Rest of Europe
- South America
- Brazil
- Argentina
- Rest of South America
- Middle East and Africa
- Saudi Arabia
- South Africa
- Rest of Middle East and Africa
- Asia-Pacific
Data Sources, Market Sizing, and Validation
Desk Research
Desk research starts by mapping where ethylene oxide is made and where it is used, which is then tied back to published production, trade, and industrial output signals. Public sources, such as USGS, UN Comtrade, the US Energy Information Administration, and OECD/World Bank macro series, help anchor feedstock context, trade flows, and regional demand direction.
We also review filings and investor material from producers and large derivative manufacturers, followed by association and regulator information that explains operating rates, expansions, and safety-led constraints. To address gaps that public tables do not show clearly, we use paid subscriptions for company financials and a shipment-level import/export view for selected routes, mainly to cross-check trade intensity and pricing direction. These examples are illustrative, and other sources were used as well for data collection, validation, and clarification.
Primary Interviews and Surveys
Primary work focused on validating how much ethylene oxide is actually running through plants and merchant channels in each major region, and on checking the split between captive use and external sales. We spoke with producers, distributors, and downstream buyers, and we tested assumptions on operating rates, turnaround timing, and regional tightness to keep the final volume model aligned with what respondents see in practice.
Distribution of primary research fieldwork respondents
| Company type | Respondent position | Region |
|---|---|---|
| Top tier: 39% | CXOs: 13% | APAC: 49% |
| Mid tier: 47% | Functional/Unit leaders: 42% | EMEA: 30% |
| Smaller Players: 14% | Managers: 45% | Americas: 21% |
Market-Sizing & Forecasting
Sizing is built using a top-down approach where production capacity, utilization patterns, and trade movements reconstruct the available ethylene oxide volume by region, and then it is reconciled against downstream pull indicators. Once the regional totals are formed, they are checked with selective bottom-up approximations, such as sampling plant-level capacity adds and retirements, and using typical utilization bands discussed in interviews to adjust totals where needed.
Key inputs used in the model include announced capacity additions and shutdowns, observed operating rate ranges (including turnaround impacts), ethylene feedstock tightness signals, import-export balances for major routes, and the demand momentum visible in large consuming chains such as PET and detergents. Where plant-level information is incomplete, gaps are handled by applying conservative utilization assumptions that are later re-tested with expert feedback and trade checks.
For forecasting, scenario analysis is used to reflect different ramp-up speeds of new units and different levels of operating discipline, and the scenario weights are reviewed with industry participants so the final path is not overly optimistic. The output is kept in volume terms so it stays comparable across regions even when pricing shifts year to year.
Data Validation & Update Cycle
Validation is done through multiple checks that look for mismatches across capacity math, trade balances, and downstream demand signals, and then exceptions are reviewed before final sign-off. If a region shows an unusual jump, the assumptions are revisited and, when needed, interviewees are re-contacted to confirm whether the change is tied to a startup, outage, or a short-term trade swing.
Reports are refreshed annually, and interim updates are completed when material events occur, such as large capacity announcements, major outages, or policy changes affecting trade. Before delivery, an analyst performs a fresh pass on key inputs so clients receive the most current view available at that time.
Mordor Intelligence's Ethylene Oxide Market Size Measured Against Other Published Estimates
Published ethylene oxide market sizes often do not line up because some sources measure the intermediate itself, while others roll the value of downstream derivatives into the same total, and they also use different base years and currency timing. Differences can also come from whether captive consumption is counted the same way as merchant sales, and from how quickly new capacity is assumed to ramp.
The main gap drivers here are the unit of measurement and the product boundary, since some estimates are revenue-based and can move mainly due to price swings, while others track physical volume tied to capacity and utilization. When the market is stated in tons and restricted to ethylene oxide before conversion, the spread narrows, and this is the counting logic applied in the Mordor Intelligence work product.
Benchmark comparison
| Source | Market Size | Gaps in Research Methodology |
|---|---|---|
| Mordor Intelligence | USD 38.55 M (2026) | |
| Industry Publisher A | USD 34.11 B (2024) | This figure is presented in USD and appears to represent consumption value, which can embed price assumptions and may mix value chains differently than a volume-only ethylene oxide intermediate scope. |
| Industry Publisher B | USD 34.59 B (2025) | The estimate is revenue-based with a different base year and a longer forecast window, which can shift totals if derivative-linked value, pricing progression, or currency conversion timing is handled differently. |
Overall, the table shows that most of the variance is explained by whether the market is expressed in tons or in USD value, and by how strictly the count stops at ethylene oxide versus moving into derivatives. By keeping the assumptions tied to capacity, utilization, and trade signals, the resulting total is easier to trace and repeat when new plants start up or when operating rates change.
Key Questions Answered in the Report
What is driving growth in the ethylene oxide market?
Demand for polyester fibers, PET packaging, medical device sterilization, and sustainable surfactants is expected to keep volumes rising at a 3.34% CAGR through 2031.
Why is Asia-Pacific the leading region?
Strong textile manufacturing, expanding PET resin plants, and large integrated chemical complexes give Asia-Pacific a 50.72% share and the fastest 3.68% CAGR outlook.
Which derivative segment is growing fastest?
Ethanolamines, supported by agrochemicals and personal-care demand, post a 3.55% CAGR from 2026-2031.
How are tightening EPA regulations affecting the market?
Facilities must cut ethylene oxide emissions by up to 99.9%, prompting heavy investment in catalytic scrubbers yet preserving sterilization demand due to lack of full substitutes.
What is the current volume of the global ethylene oxide market?
The ethylene oxide market size was 38.55 million tons in 2026.