
Ethylene Carbonate Market Size and Share
Market Overview
| Study Period | 2020 - 2031 |
|---|---|
| Market Size (2026) | USD 1.23 Billion |
| Market Size (2031) | USD 1.91 Billion |
| Growth Rate (2026 - 2031) | 9.12 % |
| Fastest Growing Market | Asia-Pacific |
| Largest Market | Asia-Pacific |
| Market Concentration | Medium |
Major Players *Disclaimer: Major Players sorted in no particular order Image © Mordor Intelligence. Reuse requires attribution under CC BY 4.0. | |
Ethylene Carbonate Market Analysis by Mordor Intelligence
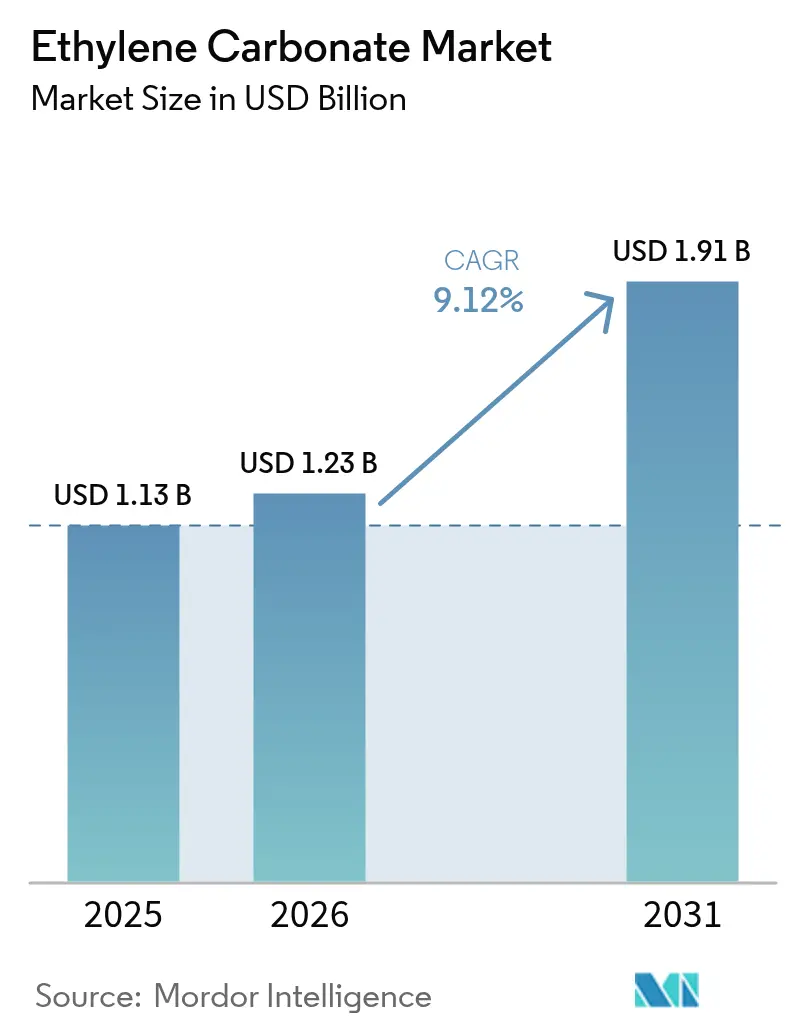
The Ethylene Carbonate market size is expected to grow from USD 1.13 billion in 2025 to USD 1.23 billion in 2026 and is forecast to reach USD 1.91 billion by 2031 at 9.12% CAGR over 2026-2031. Demand is propelled by the compound’s irreplaceable role in lithium-ion battery electrolytes, where it promotes the solid-electrolyte interphase (SEI) that protects graphite anodes and enables higher energy densities. Asia-Pacific’s integrated petrochemical and battery ecosystems underpin both cost leadership and supply security, while North American and European producers compete on purity grades and regulatory compliance advantages. Integrated supply chains that span ethylene oxide feedstocks to ready-to-use electrolyte blends are becoming decisive competitive levers. At the same time, feedstock volatility and toxicity classifications inject cost and compliance risks that favor large, vertically integrated suppliers able to amortize safety and sustainability investments.
Key Report Takeaways
- By form, solid ethylene carbonate commanded 51.60% revenue in 2025, whereas liquid battery-grade solutions are tracking a 9.55% CAGR to 2031.
- By application, lithium-ion batteries accounted for 46.70% of the ethylene carbonate market share in 2025 and are projected to grow at an 11.22% CAGR through 2031.
- By end-user industry, automotive led with 41.10% of 2025 demand, while its electrification push is set to expand at a 10.42% CAGR to 2031.
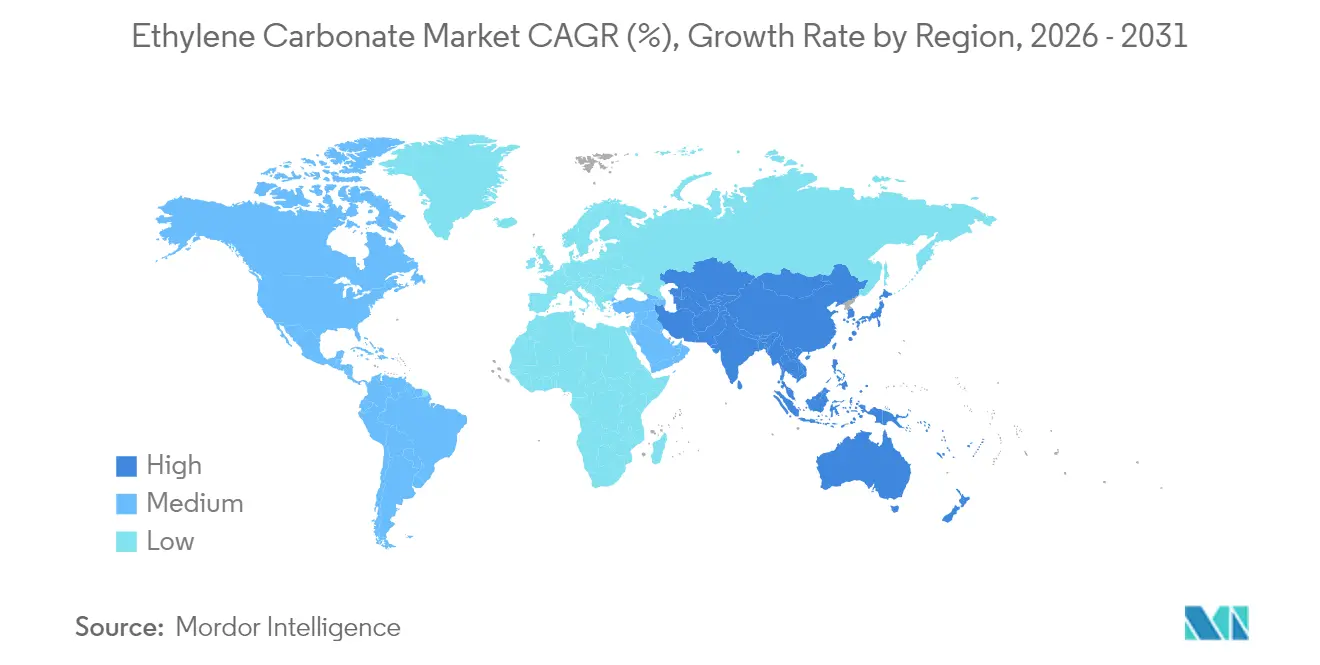
- By geography, Asia-Pacific controlled 54.05% of global revenues in 2025 and is earmarked for a 9.48% CAGR over the forecast period.
Note: Market size and forecast figures in this report are generated using Mordor Intelligence’s proprietary estimation framework, updated with the latest available data and insights as of 2026.
Market Trends and Insights
Drivers Impact Analysis of Ethylene Carbonate Market*
| Driver | (~) % Impact on CAGR Forecast | Geographic Relevance | Impact Timeline |
|---|---|---|---|
| Surging demand for high-energy-density Li-ion batteries in EVs | +3.20% | Global, with APAC leading | Medium term (2-4 years) |
| Growth in premium industrial & automotive lubricants | +1.80% | North America & Europe primarily | Long term (≥ 4 years) |
| Expansion of Asian battery-manufacturing capacity | +2.70% | APAC core, spill-over to global supply chains | Short term (≤ 2 years) |
| Favourable regulations for safer electrolyte solvents | +1.10% | Europe & North America | Medium term (2-4 years) |
| Emergence of solid-state battery precursor requirements | +0.90% | Global, early adoption in Japan & South Korea | Long term (≥ 4 years) |
| Source: Mordor Intelligence | |||


Surging Demand for High-Energy-Density Li-ion Batteries in EVs
Global electric-vehicle rollouts require electrolyte systems that sustain cell voltages above 4.4 V while enabling fast-charge performance. Ethylene carbonate forms a stable SEI layer that protects graphite anodes from solvent co-intercalation, a property validated in Skoltech research showing markedly lower capacity fade versus propylene carbonate alternatives. Automakers and cell makers therefore embed long-term offtake clauses into supply contracts, shielding demand from short-term price swings. The cumulative effect adds 3.20 percentage points to the forecast CAGR as battery deployments scale across passenger cars, commercial fleets, and stationary storage.
Growth in Premium Industrial & Automotive Lubricants
High-performance lubricants in metal-working, engine oils, and wind-turbine gearboxes increasingly specify polar carbonate additives that maintain viscosity at temperatures above 200 °C. Laboratory data on oleochemical carbonates confirm that the short carbon chain of ethylene carbonate confers superior solubility and film-forming properties, enhancing extreme-pressure resistance[1]Robert O. Dunn et al., “Physical Properties of Oleochemical Carbonates,” Journal of the American Oil Chemists' Society, springer.com . OEM warranty extensions to 20,000 km oil-change intervals amplify additive loading per formulation, translating into steady, margin-accretive demand beyond the battery sector.
Expansion of Asian Battery-Manufacturing Capacity
China is slated to add 26 million tons of annual ethylene capacity by 2027, lowering feedstock costs for downstream carbonate producers. Regional makers leverage just-in-time deliveries to neighboring gigafactories, cutting logistics costs that erode the competitiveness of trans-Pacific shipments. Mitsubishi Chemical’s 2,000 t/year gamma-butyrolactone debottlenecking and BASF’s USD 10 billion Zhanjiang complex illustrate how incumbents co-locate upstream intermediates with battery-grade carbonate units[2]Mitsubishi Chemical Group, “Expansion of Gamma-Butyrolactone Production Capacity,” mcgc.com. Resulting supply-security premiums underpin 2.70 percentage points of incremental CAGR.
Emergence of Solid-State Battery Precursor Requirements
Next-generation solid-state cells deploy polymer electrolytes that incorporate ethylene carbonate derivatives to boost ionic conductivity and interfacial stability. Pilot-scale lines in Japan and South Korea already stipulate greater than or equal to 99.9% purity, favoring suppliers with advanced fractional-crystallization technology. Though volumes remain small to 2027, design-in cycles in consumer electronics foreshadow larger automotive uptake post-2028, adding 0.90 percentage points to the long-term growth curve.
Restraints Impact Analysis of Ethylene Carbonate Market*
| Restraint | (~) % Impact on CAGR Forecast | Geographic Relevance | Impact Timeline |
|---|---|---|---|
| Health & environmental toxicity classification of EC | -1.40% | Global, stricter in Europe & North America | Medium term (2-4 years) |
| Volatility in ethylene-oxide feedstock prices | -2.10% | Global, particularly affecting integrated producers | Short term (≤ 2 years) |
| Substitution by dimethyl & propylene carbonate blends | -1.80% | Global, led by cost-sensitive applications | Long term (≥ 4 years) |
| Source: Mordor Intelligence | |||
Volatility in Ethylene-Oxide Feedstock Prices
Feedstock costs constitute a significant portion of variable production costs for non-integrated manufacturers. A substantial share of global ethylene capacity is at risk of closure during the current market downturn, intensifying price volatility and reducing carbonate converters' profit margins. Producers with captive ethylene-oxide units hedge exposure, but merchants supplying smaller downstream players experience margin whiplash, dragging the sector CAGR by 2.10 percentage points.
Substitution by Dimethyl & Propylene Carbonate Blends
Dimethyl carbonate offers lower viscosity and a cleaner toxicological profile, prompting formulators in adhesives, coatings, and select lubricants to trial 20-30% substitution ratios[3]Ayoub O. G. Abdalla and Dong Liu, “Dimethyl Carbonate as a Promising Oxygenated Fuel,” MDPI Energies, mdpi.com . Propylene carbonate blends similarly cut overall solvent costs in large-volume industrial applications. Although high-energy battery chemistries still require ethylene carbonate, the loss of incremental demand in cost-sensitive niches subtracts 1.80 percentage points from the market CAGR.
*Our forecasts treat driver/restraint impacts as directional, not additive. The impact forecasts reflect baseline growth, mix effects, and variable interactions.
Ethylene Carbonate Market Segment Analysis
By Form:
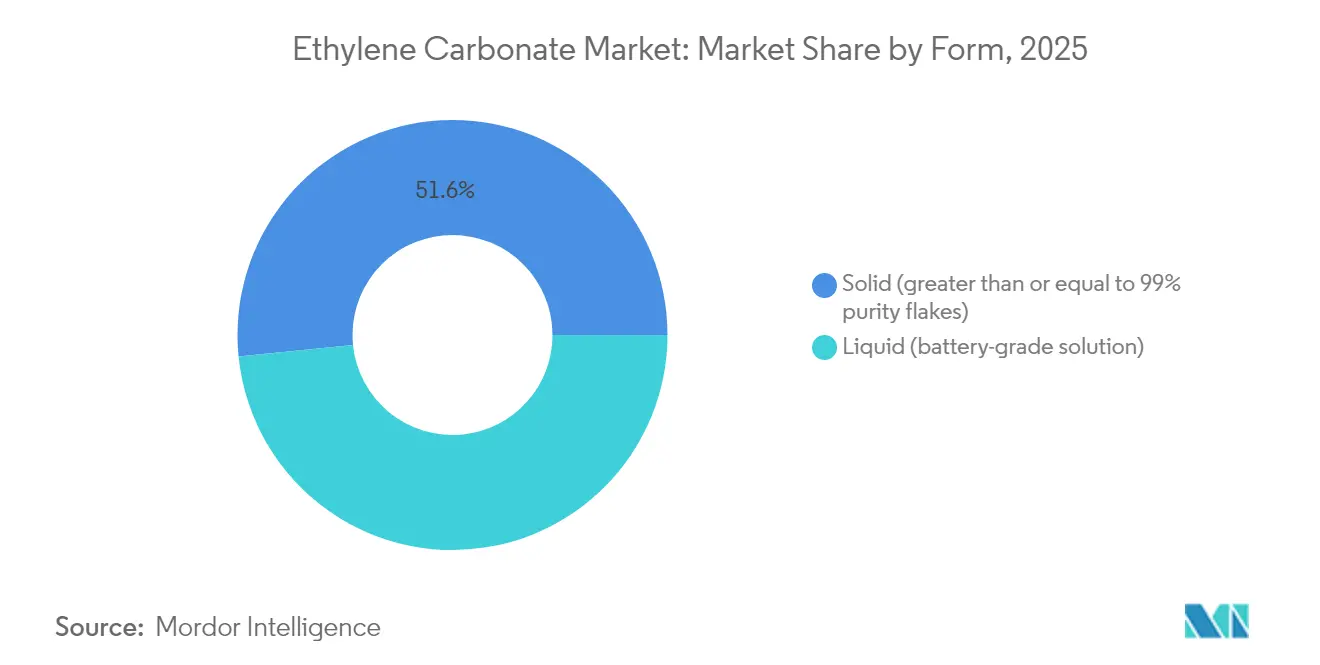
Supply Chain Convenience Tilts Growth Toward LiquidsThe solid segment retained leadership with 51.60% revenue in 2025, supported by a decades-old logistics network that ships greater than or equal to 99% purity flakes worldwide for on-site dissolution. Liquid battery-grade solutions, however, are expanding at a 9.55% CAGR to 2031 because they arrive moisture-controlled and filtered to less than 20 ppm water, eliminating in-plant handling steps that risk contamination. This structural pivot lets suppliers capture processing spreads while enabling automated filling in gigafactory electrolyte lines. Solid products will remain relevant for bulk industrial uses where drum or bag handling is not rate-limiting, preserving a sizeable, slow-growing base.
The performance gap between 99.0% technical-grade solids and 99.7% battery-grade liquids is narrowing as crystallization and ion-exchange polishing are embedded upstream, raising the addressable share of liquids in non-battery segments. US-based Huntsman’s recent investment in a Texan E-GRADE purification line exemplifies how Western suppliers defend market share with higher-purity, value-added volumes. Asian competitors counter with bulk ISO-tank shipments that cut freight costs by 10-12%, intensifying form-factor competition through 2031.


By Application:
Battery-Led Dominance Anchors Future RevenueLithium-ion batteries contributed 46.70% of 2025 consumption and are forecast to expand at an 11.22% CAGR. The chemistry’s reliance on ethylene carbonate stems from its ability to form a high-impedance SEI at voltage plateaus above 4.4 V, a prerequisite for nickel-rich NCA and NCM cathodes used in long-range EV packs. Grid-scale energy storage projects are beginning to mirror this formulation, extending demand beyond mobility into peak-shaving and renewable integration.
Lubricant formulations represent a significant portion of ethylene carbonate volumes, due to their ability to dissolve anti-wear additives at high temperatures. Yet their mid-single-digit growth lags battery demand, constraining their influence on overall pricing. Specialty medical and pharmaceutical uses, while less than 5% of tonnage, command the highest gross margins due to stringent endotoxin and heavy-metal specifications. The dispersion of growth rates across applications underscores why producers allocate incremental capacity toward battery-grade purification modules that deliver faster payback periods.
By End-User Industry:
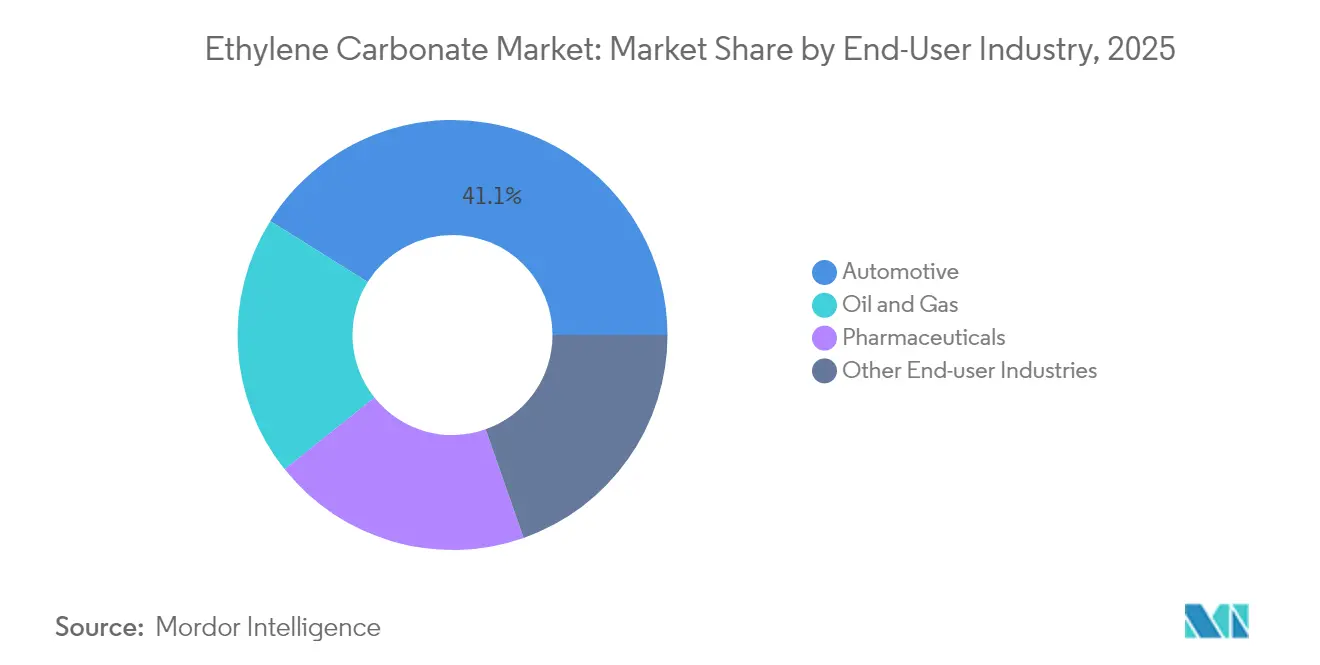
Automotive Electrification Steers Volume TrajectoryAutomotive OEMs, spanning passenger cars to light-duty delivery vans, absorbed 41.10% of global volume in 2025. Their aggregated offtake is on track for a 10.42% CAGR. Battery manufacturers in China, Europe, and the United States synchronize carbonate call-offs via vendor-managed inventory programs that penalize late deliveries, nudging suppliers toward regional buffer stock and localization of final filtration to ppm moisture.
Industrial equipment and renewable energy machinery represent a significant end-user segment, utilizing premium lubricants and coolants to increase component longevity under high mechanical stress. Pharma-grade ethylene carbonate retains its niche in controlled drug-release matrices and contrast-media stabilizers, posting low-to-mid-single-digit growth. The end-market portfolio provides diversification, but the dominance of automotive electrification means that any slowdown in EV adoption would ripple across supply-demand balances within one to two quarters.
Geography Analysis
APAC Ethylene Carbonate Market
Asia-Pacific’s integrated chemical-to-battery corridor yielded 54.05% of global revenues in 2025 and is expected to clock a 9.48% CAGR to 2031, buoyed by 26 million t of planned ethylene cracker capacity in mainland China that underpins cost leadership. Local carbonate producers typically site plants near gigafactories, shaving 2-3 days off transit times and embedding on-call quality-assurance labs that align with automotive traceability protocols. Japan’s ethylene output hit a 35-year low in 2024, reflecting a shift toward high-value specialty chemicals even as domestic battery projects grow, which widens China’s regional production advantage.
North America Ethylene Carbonate Market
North America remains structurally short in battery-grade carbonate despite Huntsman’s position as the largest domestic supplier. The Inflation Reduction Act’s incentives for US cell factories have triggered multi-year offtake agreements that partially hedge trans-Pacific supply risks. Feedstock costs, however, are higher because shale-gas-advantaged ethane crackers prioritize polyethylene, requiring carbonate makers to secure ethylene oxide at index-linked premiums.
EMEA and South America Ethylene Carbonate Market
Europe’s stringent REACH environment raises compliance costs yet secures a premium for fully documented material. BASF’s pledge to power six US care-chemical sites entirely with renewable electricity underscores how sustainability credentials are being deployed globally as soft differentiators in mature markets. Meanwhile, Middle East & Africa and South America collectively account for smaller share of volume but present upside through petrochemical diversification programs and growing EV import penetration. Logistics flexibility—using ISO tanks and regional stocking hubs—remains the route to profitable share capture in these emerging destinations.

Regulatory Landscape
Ethylene carbonate (CAS 96-49-1) is regulated in major markets through chemicals management frameworks that cover registration, classification, and safe handling. In the European Union, it is registered under REACH (EC No 1907/2006) and classified under CLP (EC No 1272/2008), including Acute Tox. 4 (H302), Eye Irrit. 2 (H319), and STOT RE 2 (H373), which shapes labeling, SDS alignment, and workplace controls across the supply chain.
As of 2026, ethylene carbonate is not listed in REACH Annex XIV (authorization) or Annex XVII (restrictions), supporting continued industrial availability while keeping compliance centered on documentation and hazard communication. In the United States, ethylene carbonate appears on the EPA TSCA inventory, supporting lawful manufacture and import, while requiring ongoing monitoring of EPA new-chemicals actions for any future use-specific constraints that could affect battery-electrolyte and solvent supply chains.
Value Chain Analysis
The ethylene carbonate value chain starts with ethylene and carbon dioxide, with ethylene converted to ethylene oxide (EO) and then reacted with CO2 to produce ethylene carbonate. Producers with captive ethylene and EO assets often have cost and reliability advantages, since EO purification and energy-intensive separations can be optimized when upstream and carbonate units are integrated, consistent with the market shift toward tightly coordinated battery-material supply.
Downstream, the chain splits into technical-grade solids and battery-grade liquids that require stringent moisture management and advanced purification (crystallization, distillation, polishing) to meet increasingly tight impurity limits for electrolyte use. Distribution and conversion include ISO-tank and drum logistics, regional stocking, and in some cases integration into ready-to-use electrolyte blends to reduce contamination risk at gigafactories. Key bottlenecks center on EO and energy price volatility, along with the capital intensity of achieving ultra-high purity, which raises barriers for smaller, non-integrated converters.
Competitive Landscape
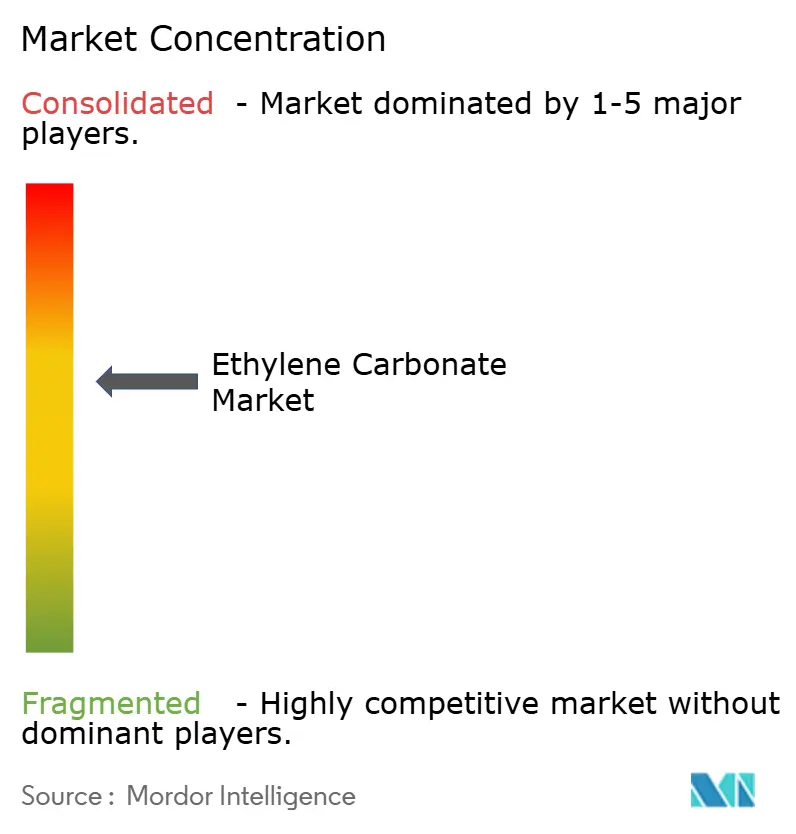
Competitive intensity sits at a moderately consolidated level. The top five firms leverage vertical integration from ethylene oxide to solvent blends, enabling cost efficiencies and supply assurances that smaller formulators struggle to match. BASF’s USD 10 billion Zhanjiang project integrates ethylene, ethylene oxide, and carbonate units within a single coastal zone to trim inter-plant logistics. Huntsman’s newly commissioned Texan E-GRADE line delivers 99.9% purity liquids into North American EV programs, demonstrating how purity thresholds are being raised as cell chemistries push higher voltages.
Asian specialists such as Guangzhou Tinci expand capacity through tolling partnerships that minimize capital outlay and allow agile response to spot demand spikes. Patent filings covering non-aqueous electrolyte blends and solid-state precursors reveal strategic R&D investments aimed at locking in future royalties. Western incumbents counter with sustainability and circular-economy initiatives, for example Clariant’s cooperation with OMV to cut the carbon footprint of ethylene derivatives. While cost remains a gating factor in commodity-grade volumes, procurement teams increasingly weigh traceable, low-carbon credentials when awarding long-term contracts, slightly diluting pure price competition.
Over the next five years, competitive advantage will stem from (1) proximity to gigafactories, (2) ability to meet greater than or equal to 99.9% purity at scale, and (3) demonstrable reductions in Scope 1-3 emissions. Players that excel along all three vectors will capture the majority of incremental demand, whereas non-integrated converters face margin compression, particularly when feedstock volatility re-emerges. Consolidation through joint ventures and targeted acquisitions therefore remains a likely scenario, especially in Europe where REACH compliance costs strain smaller balance sheets.
Ethylene Carbonate Industry Leaders
BASF SE
Huntsman International LLC
Mitsubishi Chemical Group Corporation
OUCC
Shida Shenghua New Materials Group Co., Ltd.
- *Disclaimer: Major Players sorted in no particular order
Ethylene Carbonate Market Companies Covered in this Report
- BASF SE
- Guangzhou Tinci Materials Technology Co., Ltd.
- Huntsman International LLC
- Liaoning Honggang Chemical Co., Ltd.
- Merck KGaA
- Mitsubishi Chemical Group Corporation
- OUCC
- Shandong Lixing Advanced Material Co., Ltd.
- Shandong Senjie Cleantech Co.,Ltd.
- Shenzhen Xinzhoubang Technology Co., Ltd.
- Shida Shenghua New Materials Group Co., Ltd.
- TOAGOSEI CO.,LTD.
- ZIBO DONGHAI INDUSTRIES CO.,LTD.

Market Opportunities and Future Outlook
White-space is expanding in battery-grade ethylene carbonate, where energy-efficient purification and localized capacity near battery clusters lower delivered cost and reduce contamination risk. China MIIT recognition of DODGENs melt crystallization technology for ethylene carbonate purification provides a concrete example, with reporting that it cuts energy consumption by 72% versus traditional approaches; this creates room for suppliers to differentiate on operating cost, carbon footprint, and consistent high-purity output for higher-voltage electrolyte systems.
Process innovation also supports lower-emission production routes that use CO2 more directly, aligning sustainability targets with feedstock flexibility. Peer-reviewed work in 2025 described a bromide-mediated membraneless electrosynthesis route converting ethylene and CO2 to ethylene carbonate at meaningful Faraday efficiencies across practical current densities, pointing to an R&D pipeline beyond the conventional EO-based route. Commercially, opportunity sits in scaling dedicated battery-grade plants close to major cell makers, and in expanding offerings from commodity-grade EC into moisture-controlled liquids and electrolyte-adjacent blends, where quality assurance, traceability, and supply commitments translate into pricing leverage.
Recent Industry Developments in Ethylene Carbonate Market
- July 2026: Jiangsu Oxirane Chemical started a capacity expansion project at Yangzhou Chemical Industrial Park to add 90,000 tons per year of battery-grade ethylene carbonate and 10,000 tons per year of industrial-grade ethylene carbonate, with a 12-month construction timeline. The scale of the add highlights how suppliers are building dedicated battery-solvent trains instead of relying on flexible commodity assets. It also increases competitive pressure on purity, logistics, and qualification speed with downstream electrolyte and cell customers.
- January 2026: Dongying Hi-tech Spring Chemical Industry signed a three-year supply agreement with BYD covering at least 100,000 tonnes per year of battery solvent products, including ethylene carbonate, for BYDs Hubei project. Multi-year offtake at this volume shifts procurement toward contracted, project-tied supply and reinforces the role of large-volume, qualified suppliers. It also supports upstream integration and regional stocking strategies to meet tight delivery and quality requirements.
- November 2024: Jiangsu Sailboat Petrochemical commenced commercial production at a new plant in Lianyungang, China, using Asahi Kaseis carbon dioxide-based process technology to produce high-purity ethylene carbonate and dimethyl carbonate. Bringing a CO2-enabled technology into commercial operation points to a manufacturing route aligned with decarbonization and process-efficiency priorities. The additional high-purity output supports the broader shift toward battery-electrolyte grade materials, where consistency and documented process control are increasingly decisive.


Ethylene Carbonate Market Report Scope and Research Methodology
Market Definition and Coverage
This market covers the value of ethylene carbonate sold as a chemical product across major end uses, with demand captured where it is consumed as an electrolyte solvent, process solvent, or as an intermediate in downstream manufacturing.
Scope exclusions: Internal transfers within fully integrated sites and non-ethylene-carbonate carbonate solvents are excluded unless they are sold and reported as ethylene carbonate.
Segments Covered in This Report
- By Form
- Solid (greater than or equal to 99% purity flakes)
- Liquid (battery-grade solution)
- By Application
- Lithium-ion Batteries
- Lubricants
- Medical Products
- Intermediates and Agents
- Other Applications
- By End-user Industry
- Automotive
- Pharmaceuticals
- Oil and Gas
- Other End-user Industries
- By Geography
- Asia-Pacific
- China
- Japan
- India
- South Korea
- Rest of Asia-Pacific
- North America
- United States
- Canada
- Mexico
- Europe
- Germany
- United Kingdom
- France
- Italy
- Russia
- Rest of Europe
- South America
- Brazil
- Argentina
- Rest of South America
- Middle East and Africa
- Saudi Arabia
- South Africa
- Rest of Middle East and Africa
- Asia-Pacific
Data Sources, Market Sizing, and Validation
Desk Research
We start by building the basic fact base on supply, demand, and pricing using public sources that can be checked by anyone. Useful inputs come from sources such as the USGS for minerals and battery material context, the IEA for EV and energy storage direction, and UN Comtrade for trade flows of related chemical groups where reporting is available. We also refer to sources such as the US Energy Information Administration for macro energy indicators that influence battery demand, and peer reviewed chemistry and electrochemistry journals to confirm product purity needs and typical use rates.
To connect the market to real company activity, we review annual reports, investor presentations, and press releases from producers and key downstream value chain participants, and then cross-check claims against customs news and port level commentary where possible. Paid database subscriptions are used selectively for company financials and intelligence, patent databases, and shipment-level import and export checks, mainly to reduce blind spots in capacity and expansion timelines. The sources listed here are not exhaustive, and many other public references were used for data collection, validation, and clarification during the study.
Primary Interviews and Surveys
Next, we validate what desk research cannot confirm cleanly, especially about capacity utilization, grade mix, and how battery electrolyte demand converts into ethylene carbonate volumes. Interviews and surveys are run with producers, distributors, procurement teams at battery and chemical users, and subject experts across APAC, EMEA, and the Americas, and then the feedback is used to tighten assumptions before internal totals are signed off.
Distribution of primary research fieldwork respondents
| Company type | Respondent position | Region |
|---|---|---|
| Top tier: 28% | CXOs: 14% | APAC: 49% |
| Mid tier: 58% | Functional/Unit leaders: 41% | EMEA: 32% |
| Smaller Players: 14% | Managers: 45% | Americas: 19% |
Market-Sizing & Forecasting
Sizing is first built using a top-down approach where battery production growth, EV and stationary storage demand signals, and regional chemical output and trade patterns are translated into a realistic ethylene carbonate demand pool. Once that demand pool is formed, we apply market specific inputs such as the share of lithium-ion electrolyte systems using ethylene carbonate, typical solvent blend ratios, purity grade splits (battery grade versus industrial), and observed price ranges by region to convert volumes into value.
To keep the model grounded, the totals are then corroborated with selective bottom-up approximations, including supplier and plant level capacity mapping, sampled selling price checks from channel discussions, and a sanity check of import and export volumes in key consuming countries. When bottom-up visibility is incomplete, gaps are handled through conservative utilization bands and trade balancing, which are then re-tested with interview feedback. For forecasting, scenario analysis is used so different EV adoption speeds, cell chemistry shifts, and electrolyte formulation trends can be expressed clearly, and expert consensus is applied to choose the most probable path for the final forecast.
Data Validation & Update Cycle
We run multi-step validation so the final numbers do not rely on a single assumption. Model outputs are checked against independent signals like battery shipment trends, announced plant expansions, and regional trade movements, and then outliers are investigated until a clear explanation is documented. If a major variance shows up, the analyst re-contacts relevant respondents and revisits the price and utilization inputs before internal review sign-off.
Reports are refreshed annually, and interim updates are triggered when material events occur such as large capacity additions, shutdowns, or policy shifts that can move battery demand. Before delivery, a final review pass is completed so clients receive the latest updated view based on the most recent public data and field feedback.
Mordor Intelligence's Ethylene Carbonate Market Size Compared Against Other Published Estimates
Published market values for ethylene carbonate can look far apart even when they refer to the same chemical, because the scope and conversion assumptions are not always consistent. The chosen base year, the way battery demand is translated into solvent consumption, and the price basis used for value conversion are usually the biggest drivers of the spread.
The table highlights a key gap that often comes from what is counted as market value, and how battery grade volumes are scaled from cell production. In Mordor Intelligence's model, the estimate is kept tied to reported ethylene carbonate sales across applications and regions, and battery-driven demand is converted using stated formulation and grade splits instead of assuming the full electrolyte basket is ethylene carbonate.
Benchmark comparison
| Source | Market Size | Gaps in Research Methodology |
|---|---|---|
| Mordor Intelligence | USD 1.23 B (2026) | |
| Industry Research Publisher A | USD 0.68 B (2026) | Uses a narrower priced volume build that appears to lean heavily on battery-only demand and a tighter assumed price band, which can undercount industrial and intermediate consumption and reduce the total value. |
| Business Intelligence Publisher B | USD 0.23 B (2026) | Likely applies a constrained scope around select grades or a limited set of countries, and may rely on a smaller reported base year dataset, which can suppress the global total when extrapolated forward. |
Reading the three figures together, the differences are mainly explained by how much non-battery demand is included, how grade and purity are treated, and which price basis is used for value conversion. Our approach stays traceable to demand indicators, trade and capacity checks, and interview-backed conversion factors, which makes the final market size easier to reproduce and to update when conditions change.


Key Questions Answered in the Report
What is driving the fastest growth in the ethylene carbonate market?
Demand from lithium-ion batteries, especially in electric vehicles, is expanding at an 11.22% CAGR and remains the single largest growth engine.
Which region dominates global consumption?
Asia-Pacific held 54.05% of 2025 revenues, benefiting from integrated ethylene-to-battery supply chains and new cracker capacity coming online through 2027.
How will solid-state batteries influence ethylene carbonate demand?
While volumes remain small to 2027, ultra-high-purity grades are already being specified as polymer-electrolyte precursors, adding long-term incremental demand.
What supply risks affect ethylene carbonate producers?
Ethylene-oxide feedstock volatility and potential substitution by dimethyl or propylene carbonate blends can pressure margins and erode share in cost-sensitive segments.
How consolidated is the competitive landscape?
The top five suppliers control roughly 51% of global volume, giving the market a moderately consolidated concentration.
Page last updated on:


 Your data is secure and never sold or shared.


