
Ethernet Controller Market Size and Share
Market Overview
| Study Period | 2020 - 2031 |
|---|---|
| Market Size (2026) | USD 13.36 Billion |
| Market Size (2031) | USD 18.78 Billion |
| Growth Rate (2026 - 2031) | 7.05% CAGR |
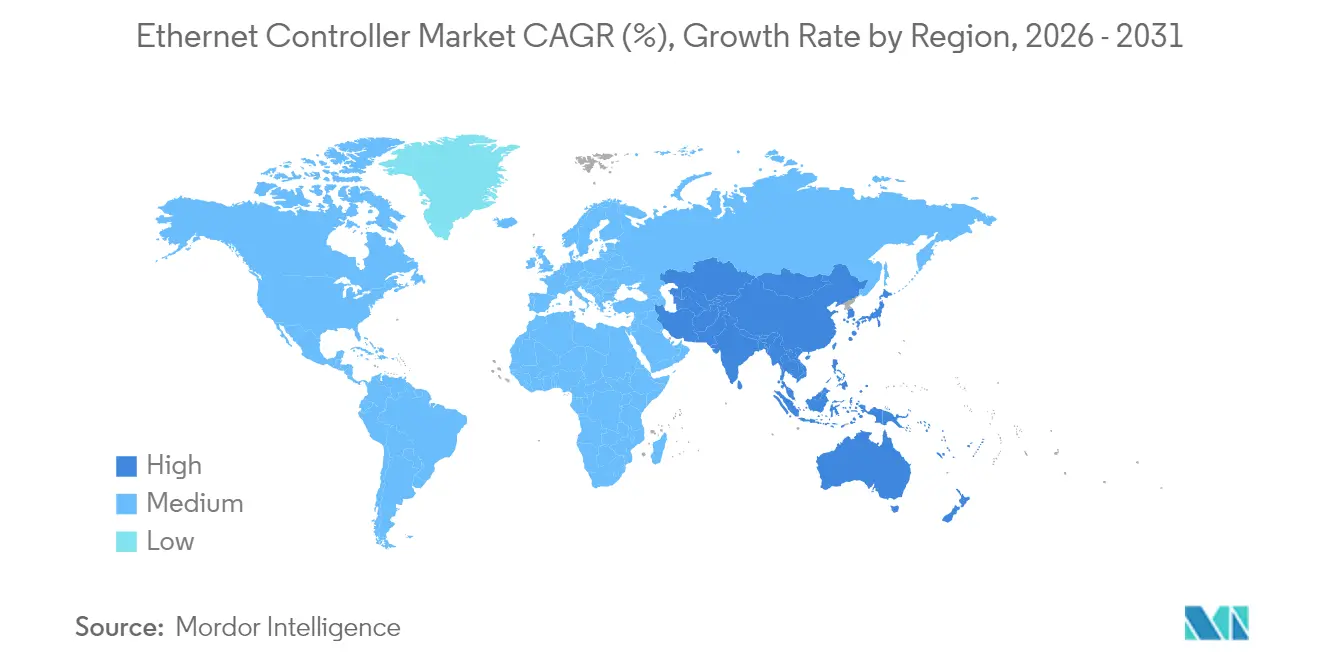
| Fastest Growing Market | Asia Pacific |
| Largest Market | North America |
| Market Concentration | Low |
Major Players *Disclaimer: Major Players sorted in no particular order Image © Mordor Intelligence. Reuse requires attribution under CC BY 4.0. | |
Ethernet Controller Market Analysis by Mordor Intelligence
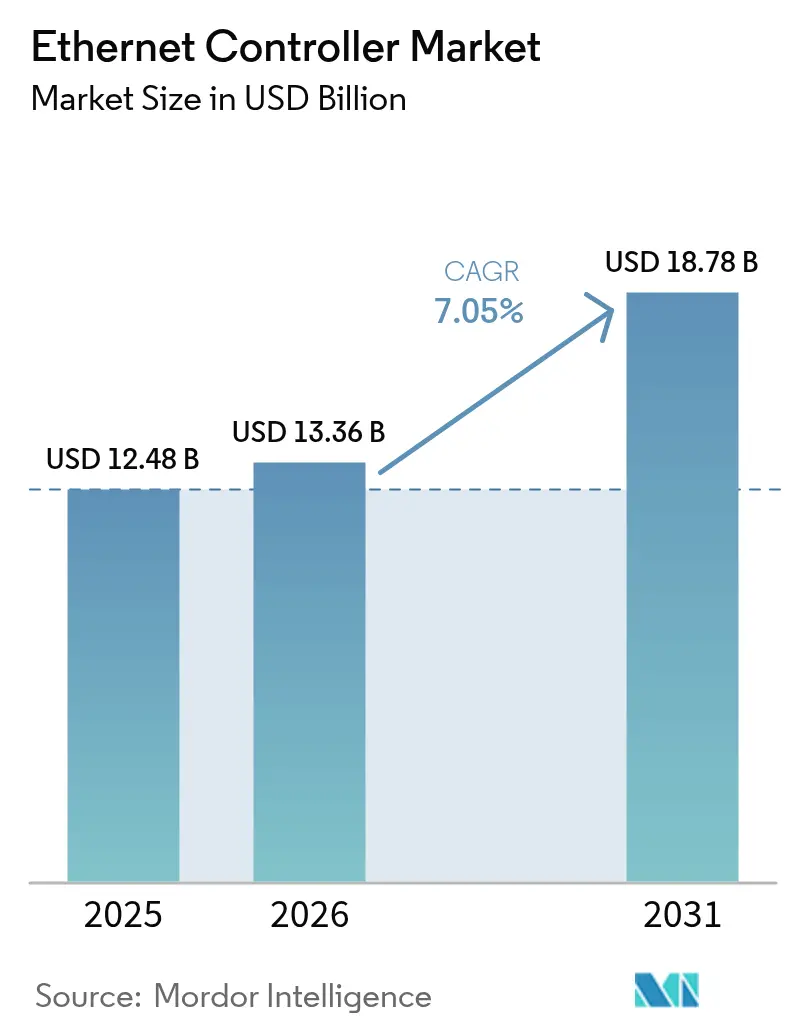
The Ethernet Controller Market size was valued at USD 12.48 billion in 2025 and estimated to grow from USD 13.36 billion in 2026 to reach USD 18.78 billion by 2031, at a CAGR of 7.05% during the forecast period (2026-2031).
Continuous hyperscale data-center investment in 800 G and 1.6 T Ethernet, the rapid shift toward zonal E/E automotive architectures, and PoE++ roll-outs in smart buildings sustain strong revenue visibility despite near-term semiconductor supply constraints. Vendors differentiate through power-optimized designs, MAC-PHY integration, and Smart NIC off-load engines that lower total cost of ownership for hyperscalers. Competitive intensity rises as Asian fabs chase design wins with aggressive pricing even while legacy-node shortages pressure PHY production capacity. Opportunities remain compelling for suppliers embedding functional-safety features for autonomous vehicles, single-pair PHYs for harsh industrial sites, and high-power PoE controllers for smart-building subsystems as the Ethernet controller market pursues balanced growth across consumer, enterprise, and operational-technology domains.
Key Report Takeaways
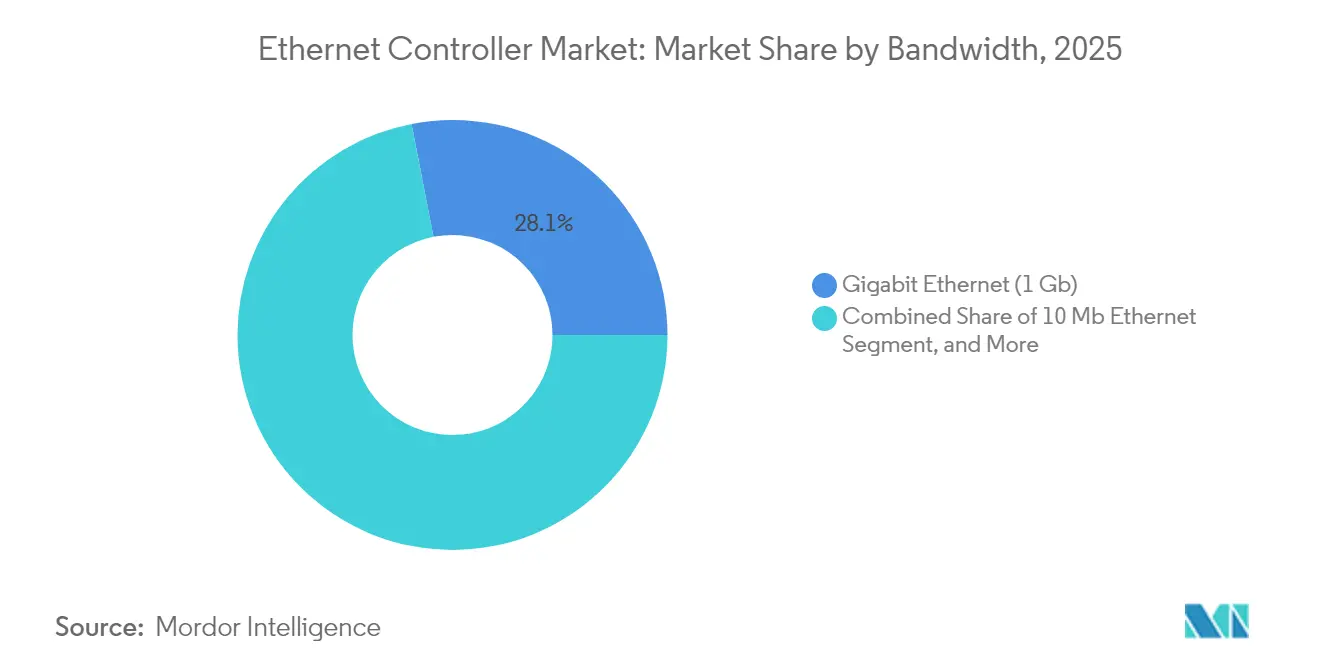
- By bandwidth type, Gigabit Ethernet led with 28.05% revenue share of the Ethernet controller market in 2025 while the combined 200/400/800 G and 1.6 T segment is projected to advance at a 12.1% CAGR to 2031.
- By function, integrated MAC-PHY devices accounted for 30.75% of the Ethernet controller market share in 2025, whereas Smart NIC and IPU solutions are forecast to expand at 12.95% CAGR through 2031.
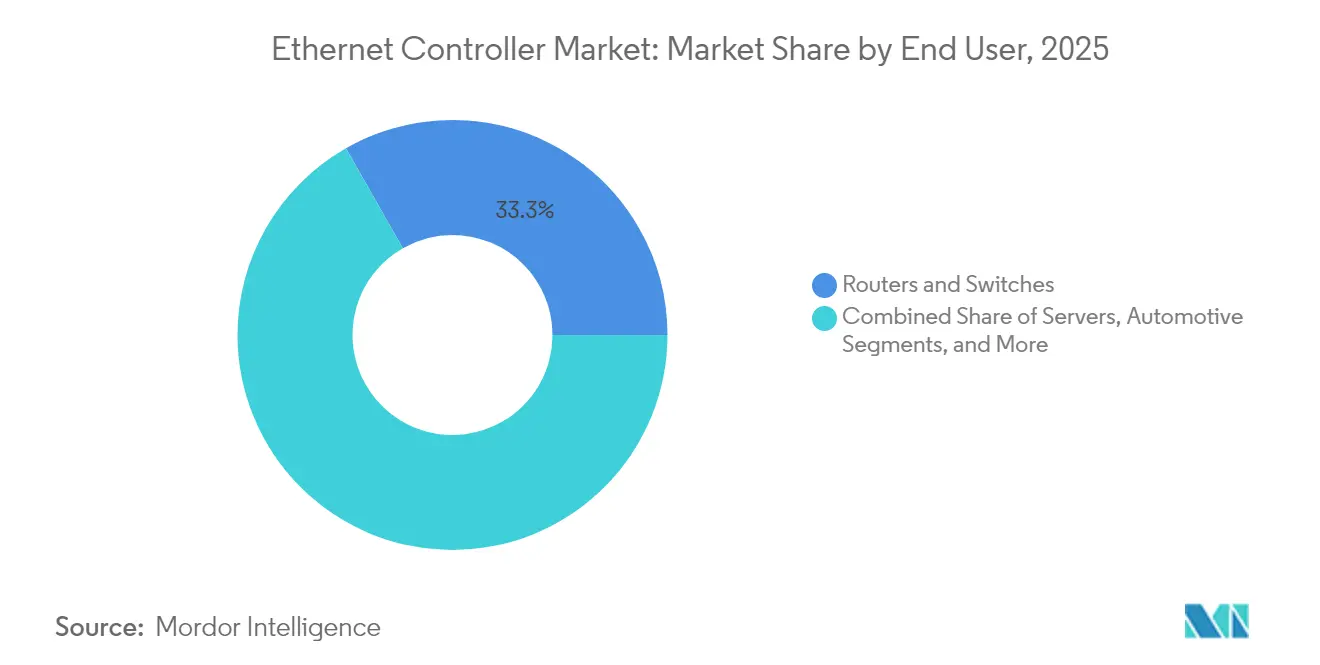
- By end user, routers and switches captured 33.25% share of the Ethernet controller market size in 2025; industrial automation equipment is tracking the fastest 11.3% CAGR between 2026-2031.
- By application, data-center and cloud workloads held 35.45% share in 2025, while connected-vehicle electronics are poised for a 12.4% CAGR over the outlook period.
- By geography, Asia-Pacific dominated with a 38.20% share in 2025; the Middle East & Africa region is forecast to grow at 12.7% CAGR to 2031.
Note: Market size and forecast figures in this report are generated using Mordor Intelligence’s proprietary estimation framework, updated with the latest available data and insights as of 2026.
Global Ethernet Controller Market Trends and Insights
Drivers Impact Analysis*
| Driver | (~) % Impact on CAGR Forecast | Geographic Relevance | Impact Timeline |
|---|---|---|---|
| AI-driven demand for 800 G and 1.6 T Ethernet in hyperscale data-centers | +2.8% | North America, Asia-Pacific | Medium term (2-4 years) |
| Automotive zonal E/E architectures adopting multi-gig Automotive Ethernet | +1.9% | Europe, North America, Global | Long term (≥ 4 years) |
| Industrial 10BASE-T1L enabling single-pair IIoT sensor connectivity | +1.2% | Europe, Asia-Pacific | Medium term (2-4 years) |
| Growing adoption of EtherCAT for real-time machine control | +0.8% | Germany, global industrial clusters | Long term (≥ 4 years) |
| Rapid proliferation of USB-to-Ethernet adapters for ultra-thin clients | +0.6% | North America, Asia-Pacific | Short term (≤ 2 years) |
| Mandatory PoE++ deployment in smart-building lighting and security | +0.9% | North America, Europe | Medium term (2-4 years) |
| Source: Mordor Intelligence | |||


AI-driven demand for 800 G and 1.6 T Ethernet in hyperscale data-centers
Large language model training pushes east-west traffic beyond the limits of traditional 100 G switching, prompting cloud operators to migrate toward 800 G and 1.6 T Ethernet fabrics that balance cost and performance. The Ultra Ethernet Consortium aligns silicon vendors and hyperscalers on congestion-aware transport and deterministic latency features required for AI workloads. Broadcom reported USD 4.4 billion in AI networking revenue for fiscal 2024, with switching ASICs driving the Ethernet controller market as operators pivot away from InfiniBand. Intel added application-device queues and PTP timestamping to its E810 controllers to optimize distributed training synchronization. While the Ethernet controller market benefits from standardized tooling and multi-vendor sourcing, vendors must continue innovating on telemetry and flow-control mechanisms to maintain parity with proprietary fabrics in latency-sensitive AI pipelines. Standards work inside IEEE 802.3df aims to codify 1.6 T signaling and lane modulation schemes that will underpin second-generation AI cluster roll-outs.
Automotive zonal E/E architectures adopting multi-gig Automotive Ethernet
Original equipment manufacturers transition from domain-based networks to zonal topologies, replacing legacy CAN and LIN buses with 2.5-G, 5-G, and 10-G Automotive Ethernet backbones capable of aggregating radar, lidar, and camera data streams into centralized compute nodes. Texas Instruments’ DP83TG720S-Q1 PHY delivers 1 G transmission over single twisted-pair cable, meeting ISO 26262 ASIL B budgets and enabling reduced harness weight TI.COM. Marvell’s USD 2.5 billion purchase of Infineon’s automotive Ethernet business underscores the value of ASIL-compliant PHY intellectual-property within the Ethernet controller market. NXP integrates time-sensitive networking into controllers to guarantee microsecond-level determinism for drive-by-wire and fail-operational steering systems. Over-the-air update capability and cybersecurity-by-design requirements further elevate Ethernet to a unifying transport for vehicle software platforms. Regulatory pressure from UNECE R155 cybersecurity and R156 software update rules accelerates adoption, locking multi-gig Ethernet into the baseline of future EV platforms.
Industrial 10BASE-T1L enabling single-pair IIoT sensor connectivity
The IEEE 802.3cg-defined 10BASE-T1L PHY extends 10 Mb/s Ethernet over 1 km of single twisted-pair-cabling, allowing intrinsically safe field-instrumentation to connect directly into plant networks IEEE.ORG. Analog Devices’ AD7421 and onsemi’s NCN26010 integrate power delivery so temperature and vibration sensors can draw <500 mW while providing Ethernet-APL connectivity in Zone 0 hazardous areas. Eliminating protocol gateways reduces latency, simplifies maintenance, and dovetails with cloud-based analytics strategies that favor native IP endpoints. Early deployments in petrochemical and pharmaceutical plants demonstrate a 30% wiring-cost reduction versus conventional 4-20 mA loops, reinforcing the Ethernet controller market trajectory toward edge-to-cloud visibility. Certification schemes under IECEx and ATEX validate safe operation, widening addressable scope for vendors offering ruggedized MAC-PHY solutions.
Growing adoption of EtherCAT for real-time machine control
IEEE 802.3bt permits 90 W power on four-pair cabling, allowing LED luminaires, PTZ camera arrays, and Wi-Fi 7 access points to converge on a single structured-cabling layer. Siemon introduced category 6A infrastructure supporting full-power PoE++ across 100 m runs without exceeding 55 °C bundle temperatures. Signify embeds Ethernet-powered drivers in commercial fixtures, enabling granular dimming and occupancy-based automation. Building owners gain centralized energy measurement while avoiding separate AC circuits, a benefit amplified by sustainability mandates under LEED v4.1. For controller vendors, integrating PoE sourcing circuitry with advanced telemetry opens new attach points across lighting and security ecosystems, lifting the Ethernet controller market relevance in intelligent-building retrofits
Restraints Impact Analysis*
| Restraint | (~) % Impact on CAGR Forecast | Geographic Relevance | Impact Timeline |
|---|---|---|---|
| Persistent legacy-node semiconductor shortages pressuring PHY supply | -1.4% | Asia-Pacific fabs, Global OEMs | Short term (≤ 2 years) |
| Stiff margin compression from low-cost Asian fabs and design wins | -0.9% | Originating in APAC, global effect | Medium term (2-4 years) |
| InfiniBand and proprietary AI fabrics challenging Ethernet latency | -0.7% | North America, Europe AI clusters | Medium term (2-4 years) |
| Rising power-consumption limits within AI clusters | -0.5% | Global hyperscale data-centers | Long term (≥ 4 years) |
| Source: Mordor Intelligence | |||
Persistent legacy-node semiconductor shortages pressuring PHY supply
Analog-heavy Ethernet PHYs remain tied to 28 nm and older nodes where wafer shortages persist as foundries divert capital to advanced processes. Reuters linked late-2024 substrate disruptions in North Carolina quartz mines to extended lead times exceeding 52 weeks for certain 65 nm PHY lineups. TSMC commented that expanding mature-node capacity remains economically challenging given tool scarcity and lower ASPs. Automakers and industrial OEMs, which require 15-year longevity and extreme-temperature grades, face the heaviest allocations, compelling controller suppliers to dual-source packaging and explore second-tier foundries. The squeeze threatens near-term revenue capture even as overall Ethernet controller market demand remains healthy.
Stiff margin compression from low-cost Asian fabs and design wins
Analog-heavy Ethernet PHYs remain tied to 28 nm and older nodes where wafer shortages persist as foundries divert capital to advanced processes. Reuters linked late-2024 substrate disruptions in North Carolina quartz mines to extended lead times exceeding 52 weeks for certain 65 nm PHY lineups. TSMC commented that expanding mature-node capacity remains economically challenging given tool scarcity and lower ASPs. Automakers and industrial OEMs, which require 15-year longevity and extreme-temperature grades, face the heaviest allocations, compelling controller suppliers to dual-source packaging and explore second-tier foundries. The squeeze threatens near-term revenue capture even as overall Ethernet controller market demand remains healthy.
*Our forecasts treat driver/restraint impacts as directional, not additive. The impact forecasts reflect baseline growth, mix effects, and variable interactions.
Segment Analysis
By Bandwidth Type: High-speed adoption reshapes deployment economics
Gigabit Ethernet retained a 28.05% revenue foothold in 2025 as enterprises, small data-centers, and industrial controllers continued qualifying mature 1 Gb/s designs for predictable workloads. Nevertheless, hyperscalers now drive a 12.1% CAGR for combined 200 G, 400 G, 800 G, and nascent 1.6 T options, ensuring that the Ethernet controller market size for very-high-speed ports will more than double by 2031. Engineers favor PAM4 signaling with integrated DSP equalization to compress front-panel footprint while curbing channel loss budgets.
Among transition speeds, 2.5 G and 5 G solutions help commercial campuses backhaul Wi-Fi 7 traffic over installed cat-5e cabling, whereas 10 G and 25 G remain popular in storage and telco access aggregation. The Ethernet controller market sees revived interest in 10 Mb/s single-pair implementations for span-length factory sensors, a niche forecast to deliver steady volume albeit limited revenue. Suppliers balance die-area trade-offs by producing segmented silicon families rather than one-size-fits-all PHYs, a strategy preserving gross margins despite intensifying price competition on mature nodes.


By Function: Integration and off-load redefine silicon value
Integrated MAC-PHY devices captured 30.75% of Ethernet controller market share during 2025 as OEMs prioritized bill-of-materials savings and simplified PCB routing in consumer and low-end enterprise gear. Conversely, Smart NICs and Infrastructure Processing Units (IPUs) are scaling at a 12.95% CAGR because cloud architects shift TLS termination, VXLAN encapsulation, and storage RDMA to dedicated accelerators that free up host cores for revenue-generating compute.
Discrete PHYs persist for optical-module makers and rugged industrial boards that demand configuration flexibility and extended temperature ratings. USB-to-Ethernet bridge controllers expand inside ultra-thin laptops and tablets, reflecting employee appetite for wired gigabit docking in bandwidth-constrained offices. Power-over-Ethernet sourcing silicon that meets 802.3bt is another growth pocket, especially when coupled with telemetry engines that feed building-management dashboards. Over the forecast horizon, the Ethernet controller market size for off-load-centric devices is projected to close the revenue gap with traditional integrated solutions, though unit volumes will still favor single-chip MAC-PHYs in high-run-rate consumer SKUs.
By End User: Software-defined infrastructure lifts new verticals
Routers and switches remained the dominant end-user cohort at 33.25% in 2025, anchored by spine-leaf refresh cycles that align with next-generation merchant-silicon releases. Yet industrial automation customers now deliver an 11.3% CAGR tailwind, pulling real-time controllers and sensor gateways into mainstream Ethernet topologies that can compost deterministic traffic alongside standard TCP flows.
Server NIC shipments track overall data-center footprint additions but skew toward higher ASP Smart NICs. Automotive OEMs, while smaller in volume, command premium pricing for AEC-Q100-qualified PHYs and eight-year supply commitments, boosting blended margins across the Ethernet controller market. Consumer electronics, led by USB 2.5 G dongles for cloud gaming and live-streaming PCs, remains cyclical yet strategically important for vendor scale economies. Aerospace and medical device makers add niche layers of demand that reward suppliers willing to pursue stringent regulatory certification.
By Application: AI clouds and intelligent vehicles surge ahead
Data-center/cloud platforms generated 35.45% of 2025 controller revenue as global GPU farms proliferated. The Ethernet controller market size tied to AI training nodes will expand most sharply in absolute dollars, even as year-on-year unit growth for mainstream servers flattens post-2027. Telecom 5G open-RAN installs represent a reliable mid-single-digit CAGR driver as carriers virtualize baseband pools and fronthaul links.
Connected vehicles register the fastest 12.4% CAGR through 2031 because next-gen EV models integrate multigig backbones for HD sensor payloads plus centralized compute zones. Smart-factory projects adopt single-pair topologies to enable loop-power field devices, while enterprise campus networks modernize to support Edge-AI inference boxes at wiring closets. These diverse use cases broaden total addressable opportunity and insulate the Ethernet controller market against macro weakness in any single vertical.
Geography Analysis
Asia-Pacific led the Ethernet controller market with a 38.20% share in 2025, buoyed by China’s semiconductor manufacturing ecosystems, Japan’s automotive electronics dominance, and South Korea’s early adoption of 5G RAN fronthaul over Ethernet. Local supply-chain self-sufficiency initiatives spur additional design wins for domestic fabless firms, yet global vendors still capture high-speed optics and Smart NIC sockets that hinge on advanced process nodes. Government subsidies for AI supercomputer build-outs strengthen regional demand for 800 G switch silicon, sustaining double-digit growth despite episodic export-control uncertainties.
North America remains the innovation epicenter for AI-optimized data-center fabrics, translating into outsized ASPs that elevate regional revenue share relative to unit shipments. The Ethernet controller market benefits from established cloud titans standardizing on programmable Smart NIC architectures and from Tier-1 automotive suppliers in Michigan and Ontario prototyping zonal ECUs. Federal incentives under the CHIPS and Science Act encourage on-shore packaging lines for automotive PHYs, potentially easing supply risk over the medium term.
The Middle East & Africa posts a 12.7% CAGR through 2031 on the back of sovereign wealth-fund-backed hyperscale campuses, smart-city deployments in Saudi Arabia and the UAE, and greenfield industrial zones embracing Ethernet-based condition-monitoring. Fiber build-outs along the Africa Coast to Europe (ACE) cable system, plus educational cloud initiatives, further stimulate controller imports. Europe exhibits steady demand centered on Germany’s Industry 4.0 programs and France’s AI-cloud clusters, while South America’s growth clusters around Brazilian data-center expansions and Argentine automotive redesigns. Across all regions, trade-policy fluidity and currency fluctuations remain secondary variables that Ethernet controller market participants monitor closely.

Regulatory Landscape
Ethernet controller design and commercialization are tied to global standards and regional equipment-authorization regimes. IEEE 802.3 work continues to define the physical-layer roadmap used by silicon vendors and OEMs, including publication of IEEE 802.3dg in June 2026 for 100 Mb/s operation and power delivery over a single balanced pair, supporting industrial single-pair Ethernet controller and PHY implementations.
Market access is also shaped by telecom and national-security related rules that affect what hardware can be deployed and how it is authorized. In North America, the FCC maintains equipment authorization requirements tied to the Covered List (DA 26-278A1) and expanded Covered List actions in March 2026, restricting new equipment authorizations for certain foreign-produced routers and tightening compliance and traceability expectations across networking equipment supply chains. In Europe, the EU Gigabit Infrastructure Act (Regulation (EU) 2024/1309) takes effect for permit applications after 12 February 2026, driving fiber-ready building infrastructure and standardized interfaces that feed into premises-side networking equipment specifications. In Canada, CRTC Telecom Order 2026-77 mandated aggregated wholesale FTTP access, reinforcing the need for approved tariffs and Ethernet interface support (including 1 GE, 10 GE, and 100 GE) in access and aggregation equipment designs.
Value Chain Analysis
The value chain starts with upstream EDA/IP and process technology decisions, then moves through wafer supply, mature and advanced-node foundry capacity, packaging and test, and finally OEM integration into NICs, switches/routers, industrial gateways, and automotive ECUs. Broadcom, Intel, Marvell, Texas Instruments, NXP, Microchip, Analog Devices, onsemi, and Realtek span different points in this chain. Hyperscale and enterprise platforms pull high-speed controllers and Smart NIC/IPU designs through ODMs and system integrators, while industrial and automotive customers place added emphasis on extended-temperature grades, longevity programs, and functional-safety aligned validation.
Supply-side constraints remain a recurring bottleneck for analog-heavy PHY families and for high-speed parts competing for leading-edge capacity. The report context points to persistent legacy-node shortages for PHY production, while industry tracking highlights elongated lead times for higher-speed data-center components versus mature 1G/10G parts, reinforcing the need for multi-sourcing across packaging and foundry partners. Downstream, ecosystem partnerships and disaggregated hardware/software stacks are increasingly used to shorten qualification cycles and reduce integration risk in AI-scale racks, including collaborations that tie merchant silicon, switch operating systems, and rack-level platforms into repeatable, high-volume deployments.
Competitive Landscape
The Ethernet controller market displays moderate concentration: Intel, Broadcom, and Marvell together control well over half of global revenue, leveraging advanced process access, in-house IP libraries, and expansive software ecosystems. Intel’s integrated LOM strategy secures desktop and server sockets, though recent I226-V reliability fixes illustrate the reputational stakes of silicon-validation rigor. Broadcom leads switching ASICs and Smart NICs, parlaying merchant-silicon dominance into contiguous controller attach-rates, particularly inside hyperscale leaf-spine topologies. Marvell strengthens automotive credentials via the Infineon portfolio acquisition, positioning itself at the convergence of zonal architectures and Ethernet-based battery-management systems.
Competitive pressure intensifies from Realtek, MaxLinear, and emerging Chinese fabless houses that target cost-sensitive 2.5 G and below segments with price points 20-30% beneath incumbent quotes. Start-ups funded by strategic cloud investors pursue data-plane off-load with chiplets and RISC-V cores, hoping to displace legacy FPGA-based accelerators. Intellectual-property barriers reside in equalization algorithms, timing-synchronization accuracy, and certified functional-safety stacks; these attributes shield incumbents from pure-play commodity entrants. Nonetheless, margin compression across low-end lines motivates incumbents to prioritize IP-rich high-speed and vertical-specific designs, sustaining R&D outlays at 15-17% of net sales. Collectively, these dynamics underpin a balanced yet fiercely contested Ethernet controller market awaiting the next disruptive architectural shift.
Ethernet Controller Industry Leaders
Intel Corporation
Broadcom Inc.
Microchip Technology Inc.
Cirrus Logic Inc.
Texas Instruments Incorporated
- *Disclaimer: Major Players sorted in no particular order


Market Opportunities and Future Outlook
Product and standards roadmaps are expanding whitespace in 200G-per-lane and above, alongside single-pair Ethernet for industrial sensing and automotive zonal backbones. Intel introduced its Ethernet E835 controllers and adapters in June 2026, with up to 200GbE capability and reconfigurable port modes, reflecting vendor focus on flexible, high-density connectivity for data center, AI, edge, and telecom core deployments. At the same time, the Ultra Ethernet Consortium is advancing congestion management and metadata services for AI/HPC traffic patterns, which supports differentiation around telemetry, transport features, and offload engines, rather than relying on PHY throughput alone.
Industrial and building networks create attach opportunities where power, reach, and determinism matter as much as bandwidth. IEEE 802.3dg (published June 2026) supports single-pair operation with power delivery, complementing IEEE 802.3cg-based 10BASE-T1L deployments referenced in the report and enabling more native Ethernet endpoints in hazardous and long-reach environments when paired with IECEx/ATEX-aligned product strategies. In smart-building deployments, IEEE 802.3bt PoE++ (up to 90 W) continues to pull integrated PoE control and monitoring into lighting, security, and Wi-Fi access, and vendors that combine PoE power stages with telemetry and manageable MAC/PHY features gain clearer value in retrofits that use a single structured-cabling layer for both installation simplification and energy measurement.
Recent Industry Developments
- June 2026: Intel launched the Ethernet E835 controller and network adapter lineup, scaling from 10GbE to 200GbE for data center, AI, edge, and telecom infrastructure. The release emphasizes dense, virtualized deployments where controller efficiency and software features influence total system throughput and host CPU utilization.
- January 2025: Marvell completed its USD 2.5 billion acquisition of Infineon’s automotive Ethernet assets, expanding its automotive-grade PHY and switch portfolio for zonal vehicle networks. The deal strengthened access to functional-safety oriented IP and long-lifecycle automotive programs, increasing competitive intensity in multi-gig Automotive Ethernet designs.
- October 2024: Texas Instruments launched the DP83TG720S-Q1 1G single-pair Automotive Ethernet PHY with functional-safety diagnostics aimed at zonal controllers. The product supports harness-weight reduction and ASIL-aligned design approaches, pushing more OEMs and Tier-1 suppliers to qualify single-pair Ethernet connectivity in next-generation EV architectures.


Research Methodology Framework and Report Scope
Market Definition and Coverage
The market is defined as revenue generated from Ethernet controller ICs and controller solutions that enable Ethernet connectivity in equipment such as servers, routers, switches, industrial devices, and connected electronics, across major global regions.
Scope exclusions: We exclude Ethernet switches, cables and connectors, and standalone network services. We also do not count Wi-Fi-only connectivity components.
Segmentation Overview
- By Bandwidth Type
- 10 Mb Ethernet
- Fast Ethernet (100 Mb)
- Gigabit Ethernet (1 Gb)
- 2.5 / 5 Gb Multi-Gig Ethernet
- 10 Gb Ethernet
- 25 / 40 / 50 Gb Ethernet
- 100 Gb Ethernet
- 200 / 400 / 800 Gb and 1.6 Tb Ethernet
- By Function
- Discrete PHY
- Integrated MAC-PHY Controller
- Smart NIC / IPU
- USB-to-Ethernet Controller
- Single-Pair MAC-PHY (SPE / APL)
- PoE / PoE++ Controller
- By End User
- Servers
- Routers and Switches
- Industrial Automation and IIoT
- Automotive
- Consumer and Smart-Home Devices
- Others
- By Application
- Data-Centre and Cloud
- Telecommunications and 5G RAN
- Edge and Enterprise Campus
- Smart Factory / Industry 4.0
- Connected Vehicles (ADAS and IVI)
- By Geography
- North America
- United States
- Canada
- South America
- Brazil
- Argentina
- Europe
- Germany
- United Kingdom
- France
- Italy
- Russia
- Asia-Pacific
- China
- Japan
- India
- South Korea
- Australia and New Zealand
- Middle East and Africa
- GCC
- South Africa
- North America
Data Sources, Market Sizing, and Validation
Desk Research
Desk work starts with building the demand map around Ethernet ports and the systems that typically ship with Ethernet connectivity. We review public references such as IEEE Ethernet standards updates, OECD and World Bank digital and industry indicators, and government trade statistics for electronics components when available at a relevant level. We also use customs and shipment releases, plus public information from industry groups and forums linked to networking and data center ecosystems.
To anchor the model to real business activity, we also read company filings, annual reports, and investor presentations that discuss connectivity, networking silicon, and embedded networking attach. A paid subscription for company financials and intelligence is used to standardize revenue references and corporate structure, and a patent database is checked to sense where development focus is moving (for example, higher-speed Ethernet and integration trends). The desk sources listed are illustrative only. Many other public documents were used for data collection, cross-checking, and clarification.
Primary Interviews and Surveys
Primary work is used to test what we built from public data, especially for attach rates, typical pricing bands by speed class, and how design wins flow into shipments over time. We spoke with people across silicon design, component distribution, OEM and ODM product teams, and system integrators. Coverage was balanced across APAC, EMEA, and the Americas so regional mix assumptions did not get overfit to one geography.
Distribution of primary research fieldwork respondents
| Company type | Respondent position | Region |
|---|---|---|
| Top tier: 37% | CXOs: 14% | APAC: 45% |
| Mid tier: 44% | Functional/Unit leaders: 39% | EMEA: 35% |
| Smaller Players: 19% | Managers: 47% | Americas: 20% |
Market-Sizing & Forecasting
Sizing is built using a top-down approach where Ethernet endpoint demand is reconstructed from server shipments, networking equipment production signals, and industrial and telecom rollouts, and then mapped to controller attach rates by device class. Once this demand pool is formed, it is converted to value using price bands that reflect speed mix and integration levels (discrete PHY versus integrated controller solutions).
To keep totals realistic, we corroborate results with selective bottom-up approximations, such as sampled ASP times estimated unit volumes for common end-use buckets, plus channel feedback on mix shifts. Inputs that influence the model include data center build activity, enterprise network refresh intensity, 5G and telecom equipment deployments, industrial automation networking adoption, and the mix progression from Fast Ethernet toward Gigabit and above. For forecasting, we run scenario analysis and step variables forward using expected shipment trends and expert-agreed price erosion curves. We then apply smoothing so one-off spikes do not distort the outlook. Where smaller applications lack clean public unit data, gaps are handled using conservative attach-rate ranges, which are rechecked in interviews and adjusted during analyst review.
Data Validation & Update Cycle
Model outputs are checked against independent signals such as reported networking silicon commentary in public filings, shifts in Ethernet speed adoption, and region-level infrastructure spending patterns that typically move demand. Any large variance is re-opened, assumptions are revisited, and respondents are re-contacted when a key driver looks inconsistent with the latest market behavior.
Before sign-off, the work is reviewed in multiple steps, with a separate pass for unit logic, pricing logic, and currency consistency, followed by a final sense-check against the broader semiconductor and networking equipment context. Reports are refreshed annually, and interim updates are made when major events change shipment outlook, pricing, or technology transitions. Right before delivery, we do a quick update sweep so the client receives the most current view available.
Mordor Intelligence's Ethernet Controller Market Size Measured Against Other Published Estimates
Published market numbers for Ethernet controllers can look far apart because the underlying demand signals and what gets counted are not always aligned. Differences usually come from how firms treat integrated controllers versus discrete PHY components, how they handle speed mix and price erosion, and what year they treat as the effective base.
Port-speed adoption signals (especially the mix moving into higher-speed Ethernet in servers and network equipment) and shipment trend checks are the evidence points that keep Mordor Intelligence's USD 13.36 B (2026) estimate tied to a realistic controller attach and pricing curve. Some published figures lean more heavily on early forecast assumptions, broader connectivity components, or faster growth expectations without the same set of cross-checks.
Benchmark comparison
| Source | Market Size | Gaps in Research Methodology |
|---|---|---|
| Mordor Intelligence | USD 13.36 B (2026) | |
| Global Consultancy A | USD 12.19 B (2024) | Uses an earlier base year and a broader grouping that can blend controller value with adjacent connectivity components. The bridge from 2024 to later years relies more on stated CAGR than on speed-mix and pricing revalidation. |
| Industry Research Group B | USD 10.66 B (2024) | Leans on a narrower interpretation of what is counted as an Ethernet controller in some end uses, and the sizing appears more sensitive to a single growth path and currency timing assumptions for the base year. |
The comparison shows that year choice and scope boundaries can create a multi-billion dollar spread quickly. When the demand pool is built from visible shipment and adoption indicators and then matched to clear pricing logic, the resulting number becomes easier to repeat and to explain, even when technology mix and end-use cycles shift.


Key Questions Answered in the Report
What is the 2026 value of the Ethernet controller market?
The Ethernet controller market size stood at USD 13.36 billion in 2026.
How fast is the global market expected to grow?
Revenue is projected to rise at a 7.05% CAGR, reaching USD 18.78 billion by 2031.
Which bandwidth segment is gaining the most momentum?
The aggregated 200 G–1.6 T tier is forecast to post a 12.1% CAGR due to AI data-center upgrades.
Why is Automotive Ethernet important now?
Zonal E/E architectures require multi-gig links to transport ADAS sensor data, propelling double-digit growth in automotive-grade controllers.
What makes PoE++ attractive for building owners?
Up to 90 W per port powers LED lighting, cameras, and Wi-Fi 7 APs on a single cable, reducing electrical installation costs and enabling energy monitoring.
Which region will expand the fastest through 2031?
The Middle East and Africa is projected to grow at a 12.7% CAGR on smart-city and hyperscale data-center investments.
Page last updated on:






