
Market Overview
| Study Period | 2020 - 2031 |
|---|---|
| Market Size (2026) | USD 19.59 Billion |
| Market Size (2031) | USD 40.92 Billion |
| Growth Rate (2026 - 2031) | 15.88% CAGR |
| Fastest Growing Market | Asia Pacific |
| Largest Market | North America |
| Market Concentration | Medium |
Major Players *Disclaimer: Major Players sorted in no particular order Image © Mordor Intelligence. Reuse requires attribution under CC BY 4.0. | |
Epigenetics Market Analysis by Mordor Intelligence
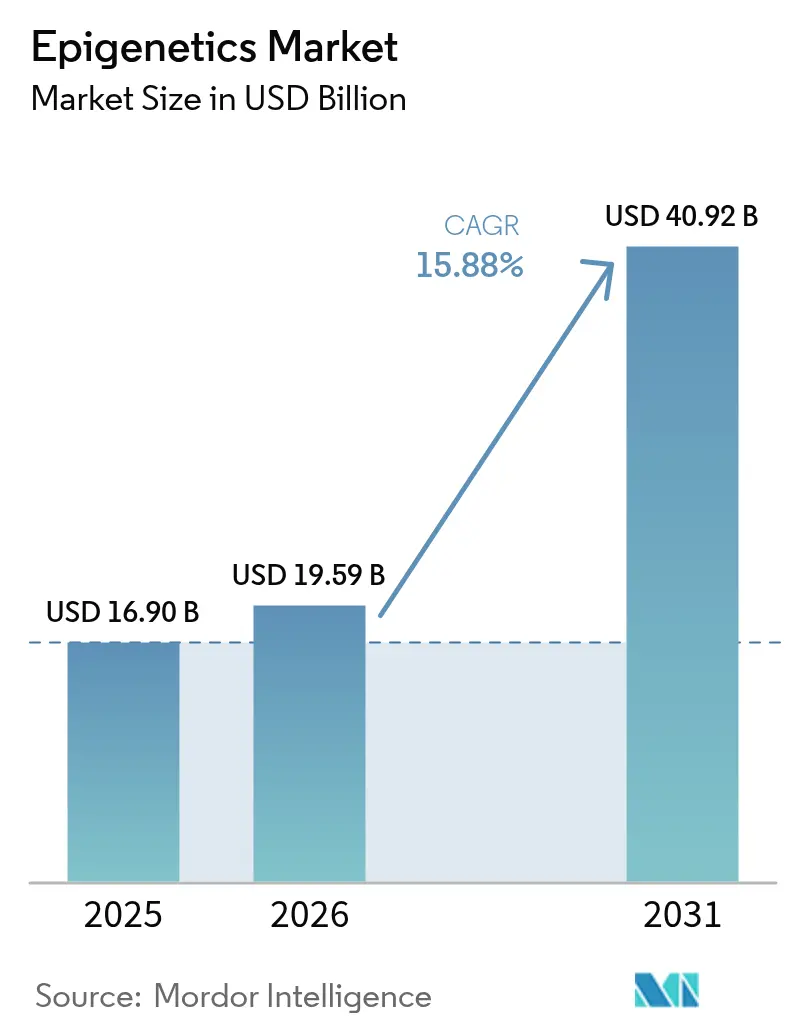
The Epigenetics market size is expected to grow from USD 16.90 billion in 2025 to USD 19.59 billion in 2026 and is forecast to reach USD 40.92 billion by 2031 at 15.88% CAGR over 2026-2031. Advancing artificial-intelligence algorithms that mine DNA-methylation signatures, long-read sequencing breakthroughs that map complex epigenomic patterns, and faster regulatory clearance for blood-based companion diagnostics are converging to lift demand. Pharmaceutical alliances that embed epigenetic controllers into metabolic and immunological pipelines reinforce near-term commercial traction. The Epigenetics market also benefits from stronger intellectual-property filings around single-cell multi-omics platforms, while venture capital inflows accelerate laboratory automation and cloud bioinformatics ecosystems. North America continues to dominate, yet Asia Pacific shows the steepest uptake as governments subsidize precision-medicine infrastructure and local start-ups adopt pay-per-use sequencing models.
Key Report Takeaways
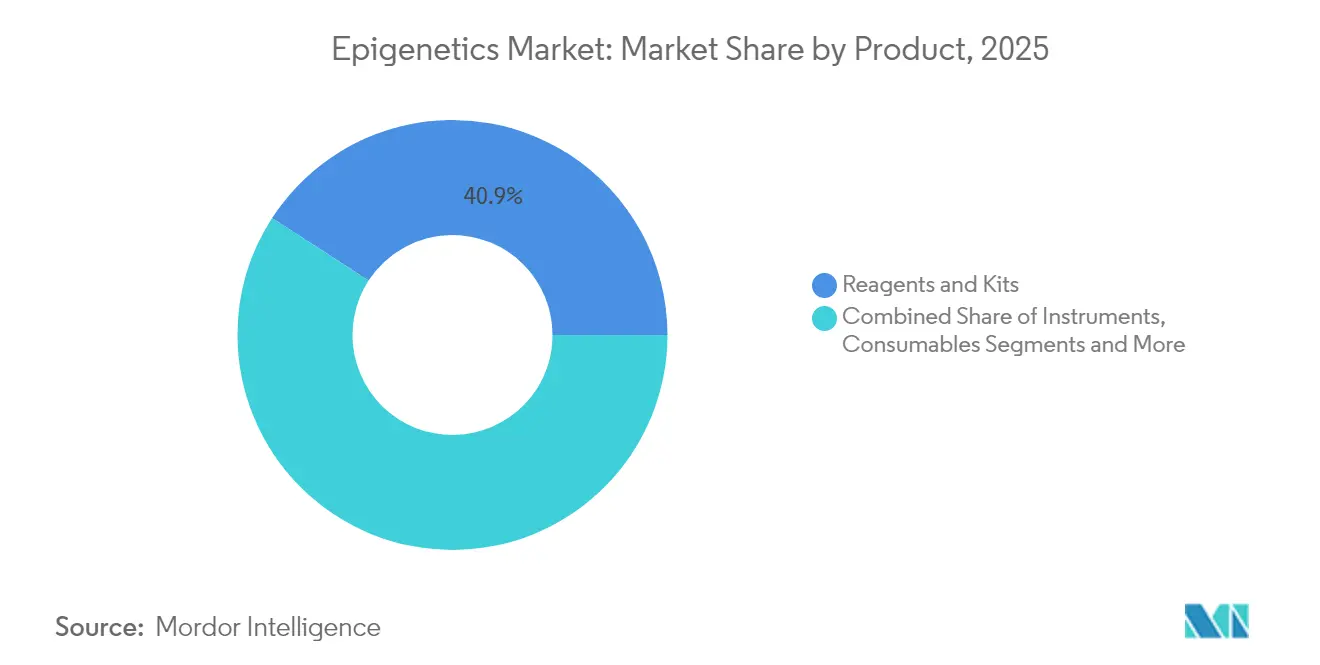
- By product, reagents and kits held 40.85% of the Epigenetics market share in 2025, whereas bioinformatics tools and services are forecast to expand at a 19.62% CAGR to 2031.
- By application, oncology led with 59.65% revenue share in 2025; neurology and CNS disorders are advancing at a 15.99% CAGR through 2031.
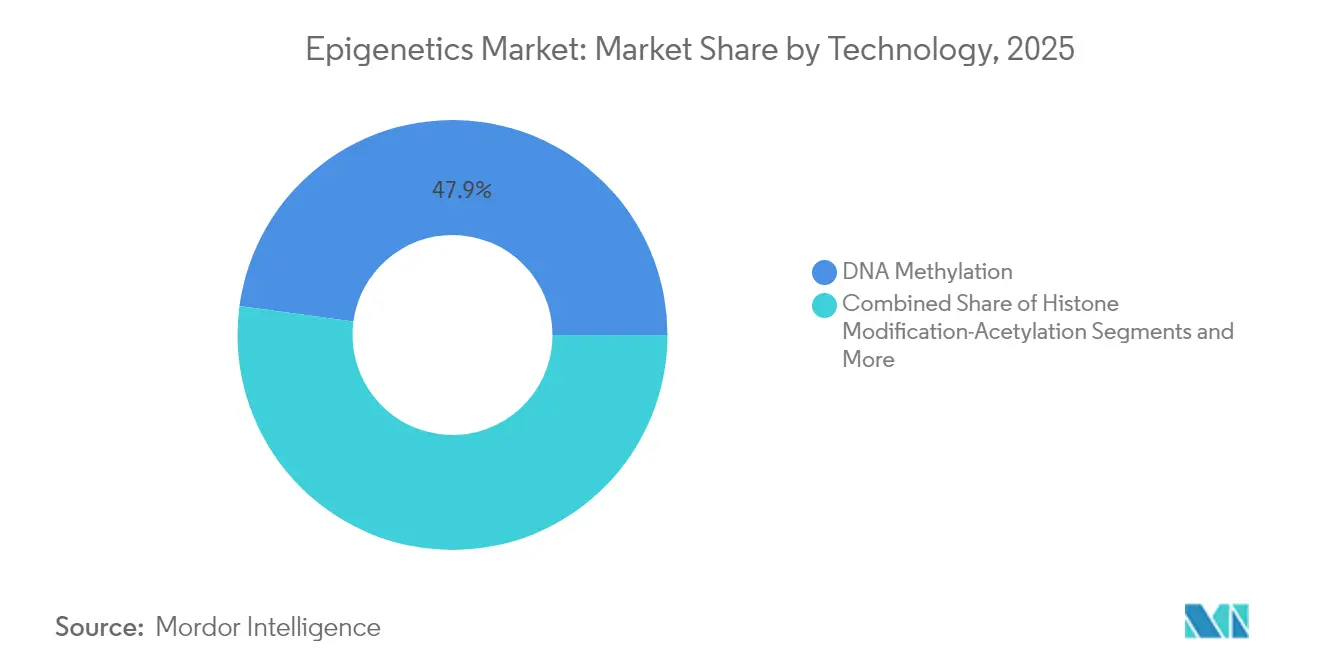
- By technology, DNA methylation analysis commanded 47.85% of Epigenetics market size in 2025 and non-coding RNA analysis is projected to rise at a 18.76% CAGR between 2026-2031.
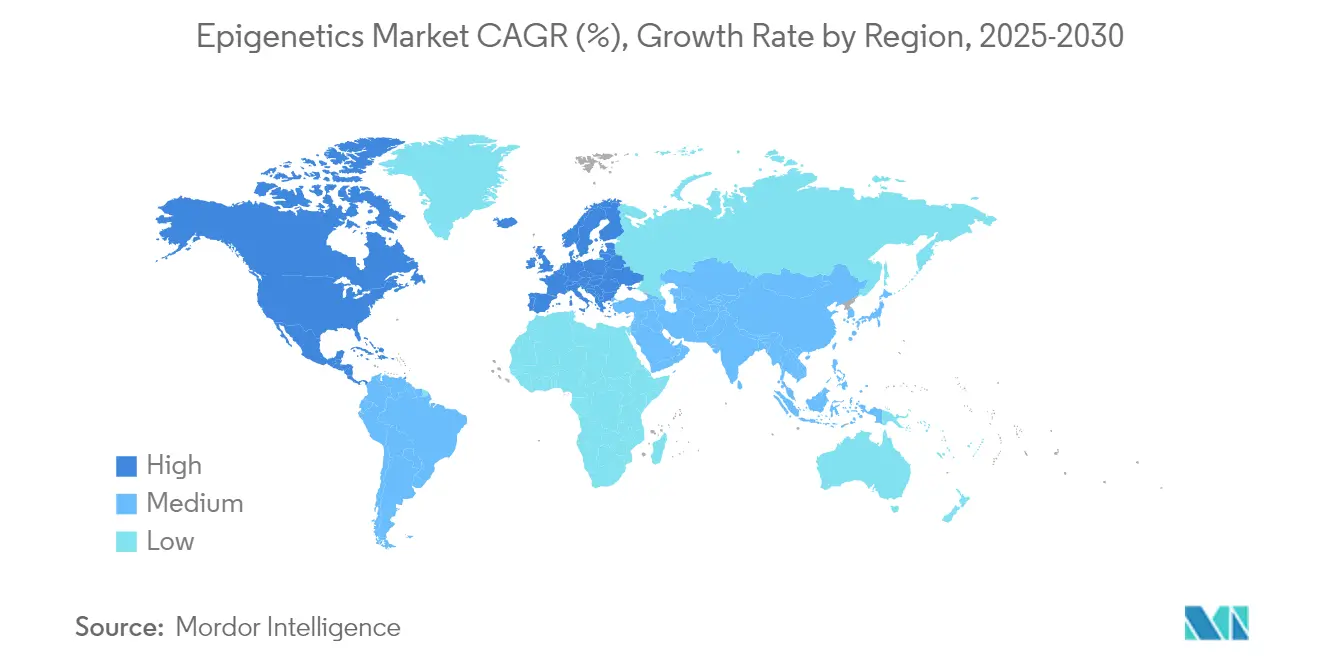
- By region, North America captured 42.95% share of the Epigenetics market in 2025, while Asia Pacific is set to grow at a 16.62% CAGR to 2031.
Note: Market size and forecast figures in this report are generated using Mordor Intelligence’s proprietary estimation framework, updated with the latest available data and insights as of 2026.
Market Trends and Insights
Drivers Impact Analysis of Epigenetics Market*
| Driver | (~) % Impact on CAGR Forecast | Geographic Relevance | Impact Timeline |
|---|---|---|---|
| Growing Cancer Incidence & Precision-Medicine Adoption | +4.20% | Global, with concentration in North America & Europe | Medium term (2-4 years) |
| Expansion Of Epigenetic Applications In Non-Oncology Application | +3.10% | Global, early adoption in North America & Asia Pacific | Long term (≥ 4 years) |
| Surge In Multi-Omics R&D Funding & Collaborative Consortia | +2.80% | North America & Europe primarily, expanding to Asia Pacific | Short term (≤ 2 years) |
| Regulatory Support For Companion Diagnostics | +2.40% | North America & Europe, gradual adoption in Asia Pacific | Medium term (2-4 years) |
| AI-Enabled Epigenetic Biomarker Discovery Accelerators | +2.10% | Global, led by North America tech hubs | Short term (≤ 2 years) |
| Venture Investments In Single-Cell & Long-Read Epigenomics Platforms | +1.40% | North America & Europe, emerging in Asia Pacific | Medium term (2-4 years) |
| Source: Mordor Intelligence | |||
Growing Cancer Incidence & Precision-Medicine Adoption
Escalating global cancer prevalence amid aging populations fuels demand for epigenetic biomarkers that stratify patients and track minimal residual disease. Illumina’s expanded TruSight Oncology portfolio now reports methylation-informed variant calls that refine therapy selection.[1]Illumina Inc., “Illumina transforms multiomic research with new technologies to unlock deeper understanding of biology,” illumina.com Multi-cancer early detection blood tests that read methylation signatures, such as Galleri, move from research to clinics, enabling earlier intervention. In hematological malignancies, integrated epigenomic-genomic profiling is identifying resistance-associated subtypes, thereby broadening indications for epigenetic drugs. The cumulative momentum positions methylation panels as foundational elements in next-generation companion diagnostics.
Expansion of Epigenetic Applications in Non-Oncology Application
Breakthrough studies show long non-coding RNAs regulate neuroinflammation in Alzheimer’s disease, opening therapeutic windows for epigenetic editing.[2]Center for Devices and Radiological Health, “Shield – P230009,” fda.gov Novo Nordisk and Omega Therapeutics are co-creating epigenomic controllers that modulate thermogenesis for obesity treatment. Cardiometabolic pipelines now incorporate integrated genetic-epigenetic risk algorithms that outperform standard lipid tests. Epigenetic re-writing tools that suppress mutant alleles without DNA cuts are entering early-phase trials for Huntington’s disease. Such cross-disciplinary momentum diversifies revenue streams for the Epigenetics market beyond its oncology core.
Surge in Multi-Omics R&D Funding & Collaborative Consortia
The United Kingdom has partnered with Oxford Nanopore Technologies and the UK Biobank to sequence 50,000 epigenomes, an initiative valued at close to USD 300 million.[3]Neuroglia, “The synergistic roles of glial cells and non-coding RNAs in the pathogenesis of Alzheimer's disease and related dementias,” neuroglia.com Venture investors backed Turn Bio with USD 300 million for re-programming platforms, while Tune Therapeutics raised USD 175 million for hepatitis B epigenome editing. Cross-institutional consortia are standardizing read-depth, base-calling, and metadata pipelines, lowering reproducibility barriers. Cloud-based multi-omics workspaces now integrate methylome, transcriptome, and proteome layers, accelerating biomarker validation. Collectively, these investments shorten the bench-to-bedside cycle that underpins the Epigenetics market growth.
Regulatory Support for Companion Diagnostics
The FDA green-lit Guardant’s Shield test marked the agency’s first approval of a blood assay that reads both genetic mutations and methylation alterations for colorectal cancer screening. Europe advanced the Health Data Space regulation, creating explicit lanes for epigenomic data sharing across borders. The FDA’s Biomarker Qualification Program is reviewing multiple methylation signatures for solid tumors and neurodegeneration, signaling a predictable evidentiary path. Pharmaceutical sponsors now embed epigenetic endpoints from Phase I onward, reducing regulatory risk for eventual companion diagnostics. The streamlined environment lifts confidence in the Epigenetics market commercialization timelines.
Restraints Impact Analysis of Epigenetics Market*
| Restraint | (~) % Impact on CAGR Forecast | Geographic Relevance | Impact Timeline |
|---|---|---|---|
| High Cost Of NGS & Single-Molecule Instruments | -2.80% | Global, particularly affecting emerging markets | Medium term (2-4 years) |
| Shortage Of Skilled Bioinformaticians | -2.10% | Global, acute in Asia Pacific & emerging markets | Long term (≥ 4 years) |
| Data-Privacy Hurdles For Population-Scale Epigenomic Datasets | -1.70% | Europe & North America primarily, expanding globally | Short term (≤ 2 years) |
| Limited Reimbursement Pathways For Epigenetic Diagnostics | -1.40% | Global, varying by healthcare system maturity | Medium term (2-4 years) |
| Source: Mordor Intelligence | |||
High Cost of NGS & Single-Molecule Instruments
Even as whole-genome sequencing trends toward the USD 100 threshold, comprehensive epigenomic workflows still need higher coverage, specialized library kits, and robust long-read platforms that keep per-sample costs elevated. Oxford Nanopore’s PromethIon, for instance, requires sophisticated fluidics upkeep and high-end GPUs. Single-cell methylome pipelines add separate tagmentation steps, proprietary reagents, and expanded compute clusters. Depreciation charges and recurring service contracts strain clinical labs in Brazil, South Africa, and Indonesia, slowing adoption in those high-burden cancer territories. Bundled leasing and reagent-rental schemes are emerging but have yet to close the affordability gap fully.
Shortage of Skilled Bioinformaticians
Demand for coders proficient in Python, machine-learning frameworks, and graph databases far outstrips supply across the biopharma value chain. Hospitals aiming to introduce methylation panels confront hiring bottlenecks because clinical geneticists rarely possess advanced computational training. Academic programs struggle to refresh curricula fast enough to cover single-cell ATAC-seq, variant-aware methyl-caller algorithms, and FAIR data principles. The talent scarcity inflates salaries, making it harder for smaller start-ups in Vietnam and Kenya to retain analysts once they gain cloud-omics experience. Upskilling initiatives are underway, yet their impact will materialize only in the next five years, tempering the Epigenetics market expansion rate.
*Our forecasts treat driver/restraint impacts as directional, not additive. The impact forecasts reflect baseline growth, mix effects, and variable interactions.
Epigenetics Market Segment Analysis
By Product:
Reagents Sustain Leadership While Bioinformatics AcceleratesReagents and kits accounted for 40.85% of the epigenetics market share in 2025, propelled by continued bulk purchasing of bisulfite-conversion chemistries and chromatin-immunoprecipitation reagents. Instruments ranked second owing to rising demand for long-read sequencers that detect 5mC, 5hmC, and 6mA directly. The bioinformatics sub-segment, however, is projected to record a 19.62% CAGR through 2031, underpinned by AI-powered cloud pipelines that translate raw signal data into actionable biomarker insights. Advanced analytics vendors now offer pay-as-you-go methylome pipelines, lowering entry barriers for mid-tier hospitals. New patents around machine-learning models for epigenetic age, immune status, and treatment response continue to command premium licensing fees, reflecting the data gravity shift inside the Epigenetics market.
The Epigenetics industry is witnessing a pivot from hardware to software differentiation as sequencing accuracy plateaus. Multi-omics dashboards integrate methylation, chromatin accessibility, and long-read transcript counts in a single user interface. Subscription revenues from informatics suites are outpacing reagent sales growth. Consequently, instrument suppliers have begun bundling analytics credits with sequencer purchases, a tactic that influences total cost-of-ownership decision calculus among clinical labs. Given these currents, bioinformatics platforms are positioned to overtake consumables in revenue contribution by the late forecast horizon.


By Application:
Oncology Dominance Faces Neurological ChallengeOncology applications secured 59.65% of the Epigenetics market revenue in 2025 due to the broad adoption of tumor-agnostic companion diagnostics and minimal residual disease monitoring. Liquid-biopsy products that combine mutation and methylation calling now inform adjuvant-chemotherapy decisions in colorectal cancer. Even so, neurology and CNS disorders are rising at a 15.99% CAGR, spurred by discoveries that chromatin dysregulation underlies Alzheimer’s and autism spectrum pathology. Academic spin-outs are trialling epigenetic-editing approaches that silence toxic gain-of-function alleles without permanent genome cuts, appealing to regulators who prefer reversible interventions.
Metabolic and autoimmune pipelines further diversify revenue sources. Epigenetic risk scores for non-alcoholic steatohepatitis are under validation in North American and Japanese cohorts. In cardiovascular research, integrated methylation plus SNP panels exceed 80% diagnostic accuracy for coronary artery disease, suggesting new clinical-laboratory revenue streams. Collectively, the data signal that oncology will remain a revenue anchor, but non-oncology trajectories will contribute a growing slice of the Epigenetics market size from 2026 onward.
By Technology:
DNA Methylation Leads as RNA Innovation Gains MomentumDNA methylation analysis captured 47.85% of the epigenetics market size in 2025, thanks to decades-long clinical familiarity and newly approved blood tests. Oxford Nanopore’s firmware update now calls 4mC modifications in bacterial pathogens, broadening infectious-disease applications. Histone-modification assays and chromatin-conformation technologies such as Hi-C are carving specialized niches in developmental biology and immuno-oncology drug discovery.
Non-coding RNA platforms, particularly long-read isoform sequencing, are on a 18.76% CAGR arc through 2031. Full-length transcript detection reveals alternative splicing events tied to tumor evasiveness and neurodegeneration. Single-cell joint profiling of chromatin accessibility plus transcriptome deepens understanding of lineage decisions during induced pluripotent stem-cell therapies. As analytical pipelines mature, microRNA-based liquid biopsies are expected to enter regulatory pathways, aggregating incremental value to the Epigenetics market.
Geography Analysis
North America Epigenetics Market
North America retained 42.95% of the Epigenetics market share in 2025, thanks to FDA clearances for methylation-informed diagnostics and NIH funding that subsidizes multi-omics population studies. Venture investors pumped unprecedented capital into platform start-ups, exemplified by Tune Therapeutics’ USD 175 million raise, securing rapid clinical translation tracks for hepatitis B epigenome-silencing therapies. Academic clusters in Boston, San Francisco, and Durham incubate cross-disciplinary talent pools that sustain regional dominance.
APAC Epigenetics Market
Asia Pacific is forecast to grow at 16.62% CAGR through 2031 as aging demographics elevate cancer incidence and governments underwrite precision-oncology test reimbursements. China anchors regional sequencing capacity with industrial-scale nanopore facilities, while Japan’s national whole-genome program stimulates secondary epigenome analysis demand. Start-ups in Singapore and India are launching culturally tailored prostate-cancer methylation panels that align with local screening norms. Such initiatives expand the Epigenetics market penetration into previously underserved populations.
Europe Epigenetics Market
Europe exhibits balanced expansion. GDPR-compliant data federations delay cross-border joint analyses, yet the European Health Data Space regulation is harmonizing consent clauses, thereby unlocking consortium trials that integrate epigenomic endpoints. The United Kingdom’s GBP 250 million bilateral project with Oxford Nanopore to profile 50,000 biobank epigenomes exemplifies public-private investment intensity. Germany and France sustain pharmaceutical research into LSD1 and EZH2 inhibitors, amplifying regional Epigenetics market engagement despite reimbursement heterogeneity across member states.

Regulatory Landscape
Regulation affecting epigenetics products spans IVD pathways for methylation-informed testing and technical expectations for genomics-enabled therapeutics. In the United States, the FDA has advanced expectations around sequencing-based evidence packages for advanced modalities, including an April 2026 draft guidance on safety assessment of genome editing in human gene therapy products using next-generation sequencing, which formalizes how sponsors support off-target and variant detection claims using NGS. In Europe, the European Medicines Agency (EMA) concluded consultation in March 2026 on a revised Guideline on good pharmacogenomic practice, reinforcing common expectations for genomic methodologies and biomarker data handling in drug development relevant to epigenetic endpoints and companion diagnostics.
In Asia, China continues to apply a risk-based IVD registration system, with Class II and Class III reagents undergoing technical review by the Center for Medical Device Evaluation (CMDE), shaping market entry for tumor methylation and multi-analyte panels. The National Medical Products Administration (NMPA) issued technical review requirements in June 2026 for tumor genetic variation detection reagents (trial), signaling more standardized dossiers for NGS-based assays. At the policy level in the EU, the European Commission proposed a Biotech Act in December 2025, and related Council documentation in 2026 reflects ongoing work to modernize biotech frameworks, which affects clinical evidence planning for epigenetics-enabled diagnostics and therapeutics across member states.
Competitive Landscape
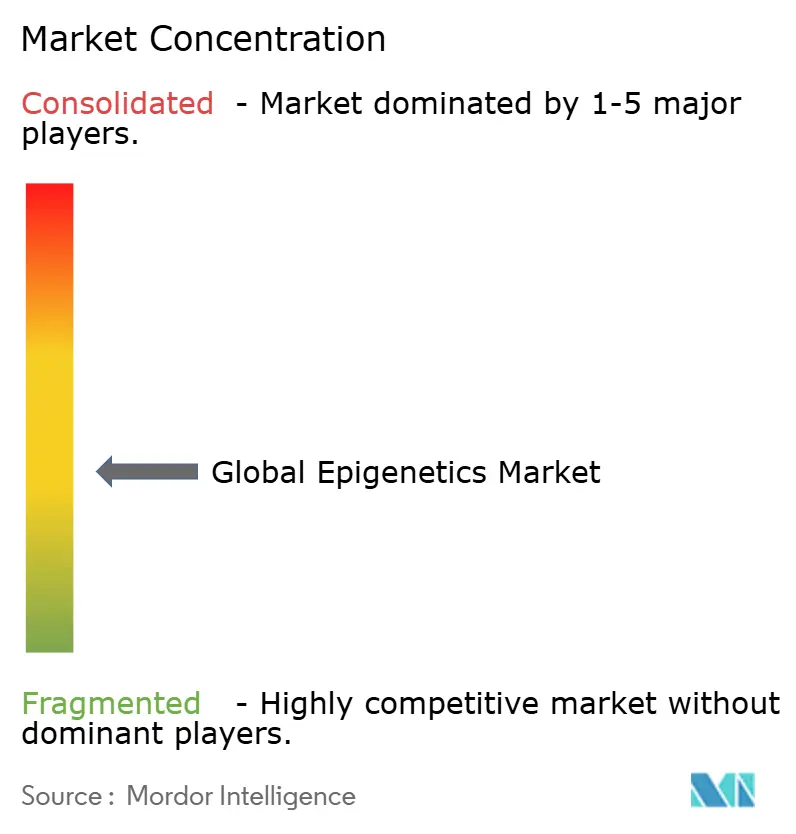
The epigenetics market features moderate fragmentation in which top sequencing vendors coexist with rapidly capitalized start-ups that specialize in editing or AI analytics. Illumina reinforced platform stickiness by embedding real-time 5-base methylation detection on NextSeq and NovaSeq systems. Thermo Fisher’s partnership on the myeloMATCH trial aligns NGS hardware with regulatory-grade companion diagnostics, potentially swaying hospital procurement preferences.
Emerging players such as Tune Therapeutics and nChroma Bio deploy compact lipid-nanoparticle delivery systems that deposit transient epigenetic editors targeting hepatitis pathogens. Oxford Nanopore consolidates its unique value proposition around direct detection of modified bases and ultra-long reads, penetrating both clinical and field-deployable settings. Meanwhile, QIAGEN leverages a consumables-heavy revenue mix that finances acquisitions in digital PCR and methylation-specific assay kits. Competitive intensity is migrating toward software ecosystems and proprietary algorithms, where barriers to entry arise from access to high-quality training datasets rather than from instrument patents alone.
Start-ups that secure exclusive clinical-grade datasets through hospital alliances are positioned to command data-network effects similar to those observed in radiology AI. Strategic collaborations, such as Novo Nordisk’s engagement with Omega Therapeutics to co-develop obesity-targeted epigenomic controllers, illustrate how large-cap pharma validates specialized epigenetics technology while accelerating go-to-market pathways. Consequently, sustained innovation across wet-lab and dry-lab arenas defines future Epigenetics market leadership.
Epigenetics Industry Leaders
Thermo Fisher Scientific
Agilent Technologies
F. Hoffmann-La Roche Ltd
PerkinElmer Inc.
QIAGEN N.V.
- *Disclaimer: Major Players sorted in no particular order
Epigenetics Market Companies Covered in this Report
- Abcam
- Active Motif
- Hologic Inc (Diagenode)
- Roche
- Illumina
- Merck
- QIAGEN
- Thermo Fisher Scientific
- Zymo Research Corp.
- PerkinElmer
- Bio-Rad Laboratories
- New England Biolabs
- Agilent Technologies
- Pacific Biosciences
- Oxford Nanopore Technologies
- NanoString Technologies
- EpiCypher Inc.
- Guardant Health
- Base Genomics
- Bioneen Inc.
- Element Biosciences

Market Opportunities and Future Outlook
A key whitespace is translating epigenome editing from platform promise into repeatable clinical programs, which increases demand for assays that quantify chromatin state and transcriptional change (DNA methylation panels, ATAC-seq, ChIP-seq, and RNA-seq) and for bioinformatics workflows that can integrate these layers into regulatory-grade readouts. In May 2026, Tune Therapeutics presented data at the European Association for the Study of the Liver showing higher-dose epigenomic treatment for hepatitis B eliminated viral biomarkers for up to 17 months, which supports the case for longitudinal epigenetic monitoring and standardized biomarker pipelines. In June 2026, Epicrispr Biotechnologies reported six-month Phase 1/2 readouts where evaluated FSHD patients showed increased lean muscle mass after a single infusion of EPI-321, reinforcing demand for measurement kits and analysis services for muscle, neurology, and rare-disease programs.
Another opportunity is scaling modular, tunable gene-expression control stacks and the enabling supply chain, including delivery technologies (LNPs and viral vectors) and scalable analytics. Company formation and IP continue to support commercial momentum: Epitome Therapeutics launched in June 2026 with EUR 4 million to develop the Cadence epigenome editing platform, indicating continued investment in tool and platform ecosystems that drive pull-through for reagents, automation, and cloud bioinformatics. In July 2026, Oryzon Genomics received a USPTO patent grant covering methods of treating non-aggressive symptoms of borderline personality disorder using LSD1 inhibitors such as vafidemstat, highlighting the role of epigenetic targets beyond oncology and broadening the addressable mix across therapeutics, clinical trial biomarker services, and translational research tool demand.
Recent Industry Developments in Epigenetics Market
- July 2026: Thermo Fisher Scientific entered a strategic collaboration with Arcturus Therapeutics to provide manufacturing and clinical research services for investigational mRNA therapy ARCT-032. The agreement expands Thermo Fisher's end-to-end services footprint supporting advanced modalities, which also increases pull-through for sequencing, sample prep, and analytics workflows used for biomarker and safety characterization.
- December 2025: Agilent Technologies announced a co-marketing agreement with Wasatch BioLabs to advance direct targeted methylation sequencing (dTMS) using Agilent SureSelect and Avida enrichment chemistries. The partnership strengthens commercialization channels for targeted methylation workflows, improving adoption of native-read and low-input methylation sequencing in research and translational settings.
- November 2024: Illumina expanded its TruSight Oncology 500 assay to enable faster, deeper variant detection in solid tumors. The update supports oncology programs that combine mutation and methylation-informed insights, reinforcing demand for integrated epigenetics-plus-genomics testing content in clinical and biopharma pipelines.


Epigenetics Market Report Scope and Research Methodology
Market Definition and Coverage
For this study, the epigenetics market covers commercial products and services used to detect, map, or modulate heritable gene expression changes without changing the DNA sequence, and values are tracked in USD at a manufacturer invoice level.
Scope exclusions: The sizing excludes research-only sequencing systems sold for non-epigenomic assays and agriculture-focused epigenome tools.
Segments Covered in This Report
- By Product
- Instruments
- Reagents & Kits
- Bioinformatics Tools & Services
- Consumables & Accessories
- By Application
- Oncology
- Neurology & CNS Disorders
- Metabolic Diseases
- Autoimmune Diseases
- Cardiovascular Diseases
- Infectious Diseases
- Others
- By Technology
- DNA Methylation Analysis
- Histone Modification (Acetylation, Methylation, Phosphorylation)
- Non-coding RNA Analysis
- Chromatin Accessibility & Conformation
- Other Technologies
- Geography
- North America
- United States
- Canada
- Mexico
- Europe
- Germany
- United Kingdom
- France
- Italy
- Spain
- Rest of Europe
- Asia Pacific
- China
- Japan
- India
- South Korea
- Australia
- Rest of Asia Pacific
- Middle East and Africa
- GCC
- South Africa
- Rest of Middle East and Africa
- South America
- Brazil
- Argentina
- Rest of South America
- North America
Data Sources, Market Sizing, and Validation
Desk Research
Desk research was used to set the market boundaries and build an initial set of measurable demand signals that can be tracked across countries and over time. We relied on public sources such as NIH and NCBI repositories, the National Cancer Institute, the US FDA device and biomarker related pages, and OECD health and R&D indicators to understand funding intensity and research activity.
To make the market model usable, data was also taken from company annual reports, investor presentations, press releases, and conference posters to understand product launches and adoption patterns. Where needed, a paid subscription for company financials and news intelligence was used to cross-check reported revenues, pipeline commentary, and M&A timing. A patent database was used to validate technology momentum across key assay types. The specific desk sources listed here are illustrative, and many other public documents and datasets were reviewed for data collection, validation, and clarification.
Primary Interviews and Surveys
Primary work focused on interviews and surveys with product managers, lab operations leaders, and commercial teams, plus buyers such as research labs, biopharma users, and clinical testing stakeholders. Inputs were used to validate adoption by assay workflow, typical purchasing bundles (instruments plus kits and consumables), and realistic price changes. The early model outputs were then pressure-tested across major regions.
Distribution of primary research fieldwork respondents
| Company type | Respondent position | Region |
|---|---|---|
| Top tier: 37% | CXOs: 12% | APAC: 40% |
| Mid tier: 49% | Functional/Unit leaders: 28% | EMEA: 33% |
| Smaller Players: 14% | Managers: 60% | Americas: 27% |
Market-Sizing & Forecasting
Sizing starts with a top-down build that reconstructs the demand pool using measurable signals such as research funding direction, the active installed base of relevant lab workflows, and the likely share of epigenetics within broader genomics and proteomics spending. Once that backbone is set, we corroborate it with selective bottom-up approximations, including sampled supplier revenue disclosure patterns, channel feedback on unit volumes, and a simple ASP times volume check for common kits and assays.
A few market fingerprints are used as practical inputs, including the share of oncology and translational research in total epigenetics usage, the split between instruments, kits and reagents, and the contribution of software and services. Repeat purchase frequency for consumables is also tracked. Regional differences are handled through indicators such as funding intensity, lab capacity expansion, and the pace of sequencing and PCR workflow adoption. When a bottom-up view is incomplete for smaller countries or niche product lines, the gaps are filled using proportional allocation tied to the closest observable driver, and then re-tested through expert feedback.
For forecasting, scenario analysis is used, and the key variables are adjusted in line with what primary respondents see for budget cycles, expected technology shifts, and the pace of clinical translation. The final trajectory is adjusted so it remains consistent with the expected mix shift toward higher-throughput methods and with realistic pricing behavior across kits, reagents, and instruments.
Data Validation & Update Cycle
Validation is done through repeated checks that compare model outputs against independent signals, followed by a review of outliers at the country and product level. We re-check assumptions when we see unusual jumps in implied pricing, an unexpected change in region share, or a mismatch between supply-side commentary and demand-side purchasing behavior.
Before sign-off, the work is reviewed in steps so that the market scope, math, and narrative are aligned. Follow-up calls are triggered when a key input changes materially. Reports are refreshed annually, and interim updates are made when major events occur, such as regulatory changes, big product launches, or meaningful shifts in funding. Right before delivery, a fresh pass is completed so the final numbers reflect the latest available information.
Mordor Intelligence's Epigenetics Market Size Compared Against Other Published Estimates
Published market sizes for epigenetics do not always match because the boundary of what gets counted can shift, and because some models lean more on longer-range growth assumptions than on near-term purchasing behavior. Differences also show up when currencies are converted using different timing, or when a forecast has been refreshed at different points in the year.
Funding intensity signals, regional adoption patterns, and the observed split between instruments and repeat consumables are the checks that keep Mordor Intelligence's estimate tied to the commercial epigenetics spend that is actually addressable. As a result, our 2026 value can differ from figures that roll in adjacent research tools or use older pricing baselines.
Benchmark comparison
| Source | Market Size | Gaps in Research Methodology |
|---|---|---|
| Mordor Intelligence | USD 19.59 B (2026) | |
| Global Consultancy A | USD 16.69 B (2024) | Uses an earlier base year and may apply broader product definitions across genomics tools, which can shift what is treated as epigenetics specific revenue and how prices are normalized. |
| Industry Publisher B | USD 19.83 B (2025) | Publishes a near-term number under a different timing and growth setup, and the scope often bundles a wider set of methods and applications, which changes the implied mix and year-to-year comparability. |
The spread across the table is mainly explained by base year choice, scope edges (what is counted as epigenetics versus adjacent genomics activity), and how price and mix are carried forward into the forecast. By keeping the model traceable to a small set of measurable inputs and then re-checking them with primary feedback, the final size is easier to interpret and repeat for planning.


Key Questions Answered in the Report
What is the projected value of the Epigenetics market by 2031?
The Epigenetics market is forecast to reach USD 40.92 billion by 2031.
Which application segment is growing fastest in the Epigenetics market?
Neurology and CNS disorders are expanding at a 15.99% CAGR through 2031 due to breakthroughs in epigenetic editing and RNA-based biomarkers.
Why is Asia Pacific’s Epigenetics market expanding rapidly?
Aging populations, rising cancer incidence, and government investments in precision-medicine infrastructure are driving a 16.62% CAGR in Asia Pacific.
What technology currently holds the largest Epigenetics market share?
DNA methylation analysis maintains leadership with 47.85% market share owing to regulatory-approved methylation assays.
What key restraint could slow Epigenetics market adoption?
High capital expenditure for next-generation and single-molecule sequencers remains a critical barrier, especially in emerging markets.
Page last updated on:






