
Environmental Consulting Market Size and Share
Market Overview
| Study Period | 2020 - 2031 |
|---|---|
| Market Size (2026) | USD 49.26 Billion |
| Market Size (2031) | USD 65.72 Billion |
| Growth Rate (2026 - 2031) | 5.94 % |
| Fastest Growing Market | Asia Pacific |
| Largest Market | North America |
| Market Concentration | Low |
Major Players *Disclaimer: Major Players sorted in no particular order Image © Mordor Intelligence. Reuse requires attribution under CC BY 4.0. | |
Environmental Consulting Market Analysis by Mordor Intelligence
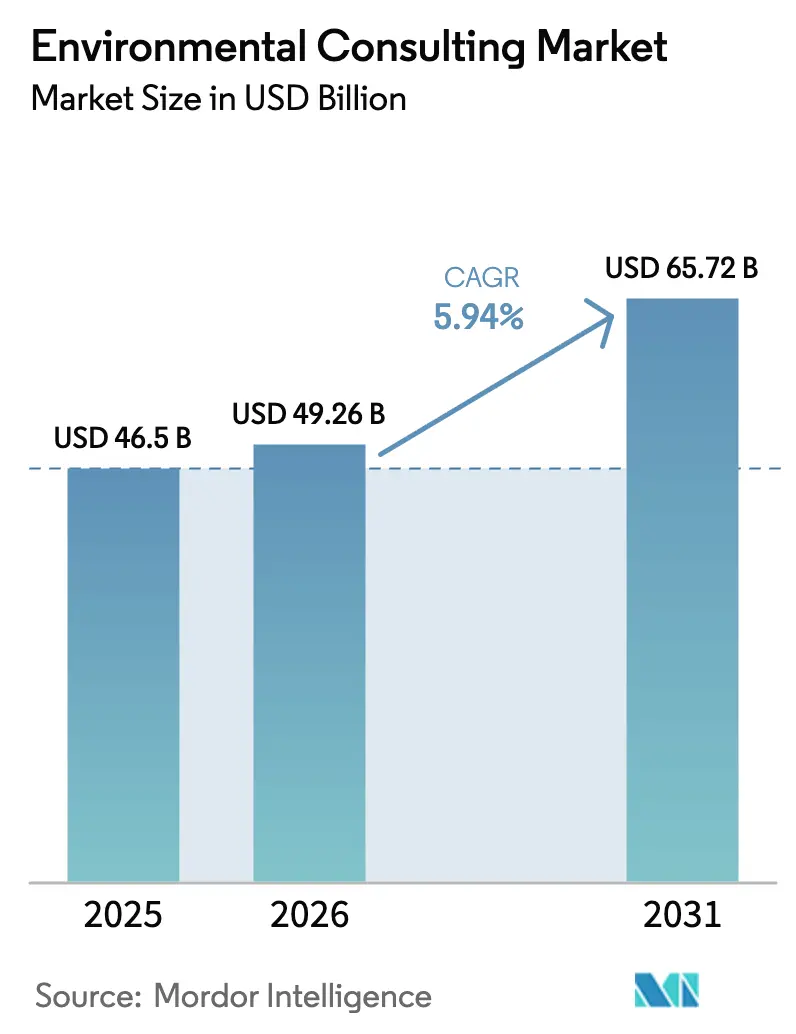
The environmental consulting market size was valued at USD 46.50 billion in 2025 and estimated to grow from USD 49.26 billion in 2026 to reach USD 65.72 billion by 2031, at a CAGR of 5.94% during the forecast period (2026-2031). This sustained performance reflects synchronized climate-policy mandates across OECD and G20 economies, rising corporate disclosure obligations, and rapid digitization that compresses delivery costs while expanding advisory scope. Demand concentrates in high-value segments, particularly Environmental Impact Assessment and ESG advisory, because regulatory standardization turns compliance from discretionary spending into essential infrastructure. Corporate net-zero commitments, growth in green finance, and industrial decarbonization funds deepen the addressable pool of projects, while technology such as AI-enabled site characterization elevates consulting productivity. Competitive intensity remains balanced: specialized boutiques capture niche technical mandates, whereas large integrated players leverage cross-service synergies to defend margins despite framework fee pressure.
Key Report Takeaways
- By service type, Environmental Impact Assessment led with 30.25% of environmental consulting market share in 2025. ESG Reporting and Sustainability Strategy is forecast to expand at a 6.12% CAGR to 2031.
- By end-user industry, the public sector recorded the highest projected CAGR at 6.72% through 2031. Energy and Power accounted for 29.10% of the environmental consulting market size in 2025.
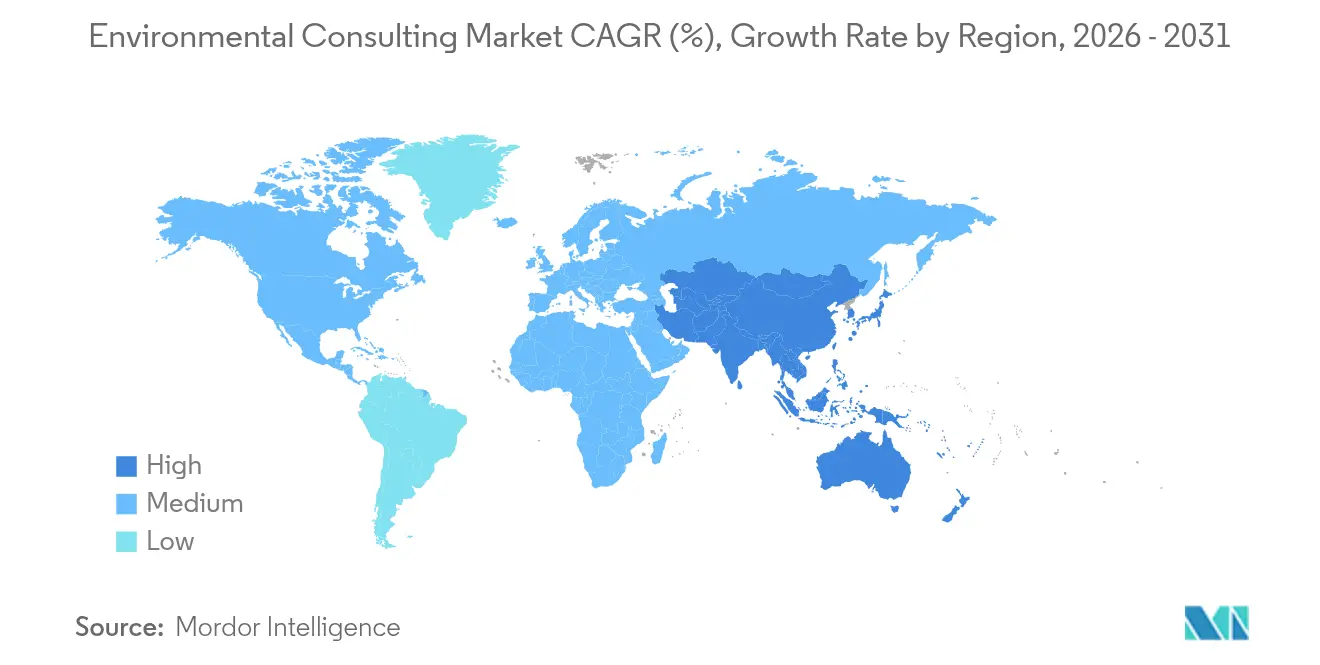
- North America held a 35.53% revenue share in 2025; Asia-Pacific is projected to grow at a 6.31% CAGR to 2031 in the environmental consulting market .
Note: Market size and forecast figures in this report are generated using Mordor Intelligence’s proprietary estimation framework, updated with the latest available data and insights as of 2026.
Market Trends and Insights
Drivers Impact Analysis of Environmental Consulting Market*
| Driver | (~) % Impact on CAGR Forecast | Geographic Relevance | Impact Timeline |
|---|---|---|---|
| Mandatory Climate-Policy Compliance in OECD and G20 Economies | +1.5% | Global, with concentration in North America and EU | Medium term (2-4 years) |
| Corporate Net-Zero and ESG Disclosure Mandates | +1.2% | Global, led by EU CSRD and US SEC requirements | Short term (≤ 2 years) |
| Growth of Green and Transition Bonds Requiring 3rd-Party Verification | +0.8% | Global, concentrated in developed markets | Medium term (2-4 years) |
| Industrial Decarbonisation Funds Tied to Advisory Spend | +0.9% | North America, EU, with expansion to APAC | Long term (≥ 4 years) |
| AI-Enabled Rapid Site-Characterisation Tools Cut Due-Diligence Time | +0.7% | Global, early adoption in North America | Short term (≤ 2 years) |
| "Nature-Positive" Impact Accounting Frameworks Emerge | +0.6% | Global, with EU and UK leading implementation | Long term (≥ 4 years) |
| Source: Mordor Intelligence | |||
Mandatory Climate-Policy Compliance in OECD and G20 Economies
Converging climate rules transform consulting demand into a standardized, repeatable service line rather than episodic project work. Updated OECD Environmental Performance Reviews require quantified decarbonization pathways, while carbon-border adjustment mechanisms introduce supply-chain verification needs that transcend national boundaries.[1]Consulting firms deploy single methodological frameworks across multiple jurisdictions, lowering customization costs and enlarging their client base. As compliance shifts from voluntary to mandatory, service pipelines become more predictable, enabling long-term resource planning and investment in digital delivery platforms.
Corporate Net-Zero and ESG Disclosure Mandates
The EU Corporate Sustainability Reporting Directive applies to more than 50,000 companies starting in 2024, compelling detailed environmental disclosures that exceed prior voluntary guidelines.[2] Many firms lack in-house expertise to map operations to taxonomy criteria, producing a multi-year backlog of advisory assignments. Similar rules under consideration by the U.S. Securities and Exchange Commission and other regulators extend the same demand pattern globally. Consequently, environmental consulting market relationships migrate from short-term compliance engagements to continuous strategic partnerships that include scenario modeling and assurance readiness.
Growth of Green and Transition Bonds Requiring 3rd-Party Verification
Global green bond issuance hit USD 500 billion in 2024, while transition bonds emerged as a complex asset class for carbon-intensive sectors. New standards require independent verification, elevating demand for consultants accredited under frameworks such as the Climate Bonds Standard. Verification assignments remain price-insensitive because investors value rigorous taxonomy alignment, allowing consultants to earn premium fees and maintain healthy margins even as baseline compliance work commoditizes.
Industrial Decarbonization Funds Tied to Advisory Spend
The U.S. Inflation Reduction Act earmarks USD 370 billion for clean-energy investments, with many programs mandating third-party advisory services for grant eligibility.[3] Comparable EU mechanisms link funding to structured consulting milestones, ensuring stable revenue through multiyear projects. These rules reposition environmental consulting from cost center to revenue enabler, shifting procurement decisions toward value creation rather than price minimization.
Restraints Impact Analysis of Environmental Consulting Market*
| Restraint | (~) % Impact on CAGR Forecast | Geographic Relevance | Impact Timeline |
|---|---|---|---|
| Persistent Fee-Pressure from Framework Contracts | -0.4% | Global, most acute in mature markets | Short term (≤ 2 years) |
| Delayed Permitting for Large Infrastructure in Emerging Markets | -0.3% | Emerging markets, particularly South America and Africa | Medium term (2-4 years) |
| Scarcity of Licensed Hydro-geologists and Toxicologists | -0.2% | Global, with acute shortages in North America | Long term (≥ 4 years) |
| Client Shift to In-House Digital EHS Platforms | -0.1% | Developed markets, led by large corporations | Medium term (2-4 years) |
| Source: Mordor Intelligence | |||
Persistent Fee-Pressure from Framework Contracts
Corporate buyers consolidate vendors under multiyear frameworks that embed annual cost-down clauses. Routine compliance tasks become commoditized, forcing consultants to diversify toward specialized, high-value niches such as PFAS remediation or nature-positive accounting. Larger firms leverage scale and cross-selling to defend margins, whereas smaller boutiques rely on unique technical depth to command premium rates.
Delayed Permitting for Large Infrastructure in Emerging Markets
Environmental approvals for large-scale projects in parts of Latin America and Africa extend four to five years, creating pipeline uncertainty that complicates staffing and investment decisions. Regulatory requirements often evolve mid-process, triggering redesigns and rework. Consultants must balance resource commitments against uncertain timelines, favoring shorter-cycle assignments in developed markets when capacity is constrained.
*Our forecasts treat driver/restraint impacts as directional, not additive. The impact forecasts reflect baseline growth, mix effects, and variable interactions.
Environmental Consulting Market Segment Analysis
By Service Type:
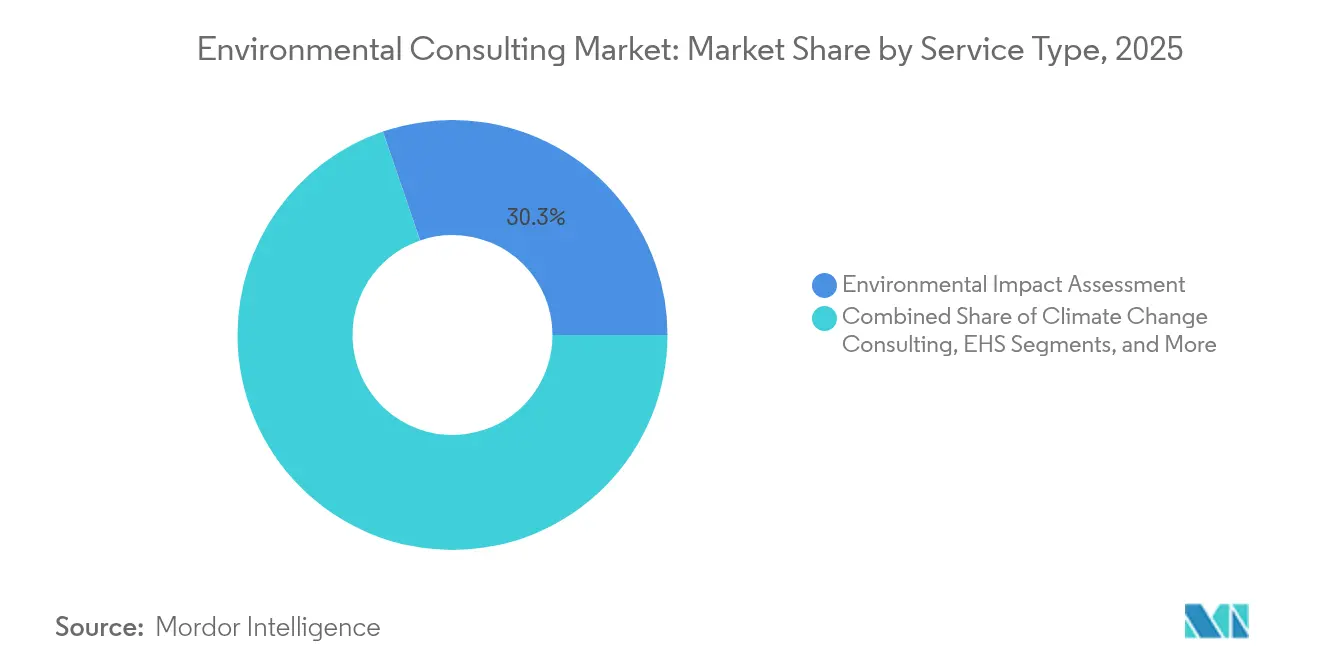
ESG Advisory Drives Premium GrowthEnvironmental Impact Assessment captured 30.25% of the environmental consulting market in 2025, reflecting its entrenched role in project permitting across every major economy. Despite its scale, fee rates face pressure as standardized digital workflows shorten field programs. Conversely, ESG Reporting and Sustainability Strategy is forecast to increase at a 6.12% CAGR, propelled by mandatory disclosure rules that necessitate continuous rather than project-based engagement. The environmental consulting market size for climate-change consulting accelerates as transition pathway modeling becomes a board-level priority, positioning consultants as strategic advisors on capital allocation.
Water and wastewater management benefits from infrastructure stimulus and new contaminant regulations such as the EPA Lead and Copper Rule Improvements, which unlock USD 45 billion of addressable projects through 2030. Consultants specializing in PFAS remediation secure complex, multi-year assignments requiring hydrogeological expertise and advanced treatment design. Meanwhile, AI-driven contaminated-site assessment compresses traditional fieldwork yet opens new revenue streams in data analytics and remote sensing interpretation.

By End-User Industry:
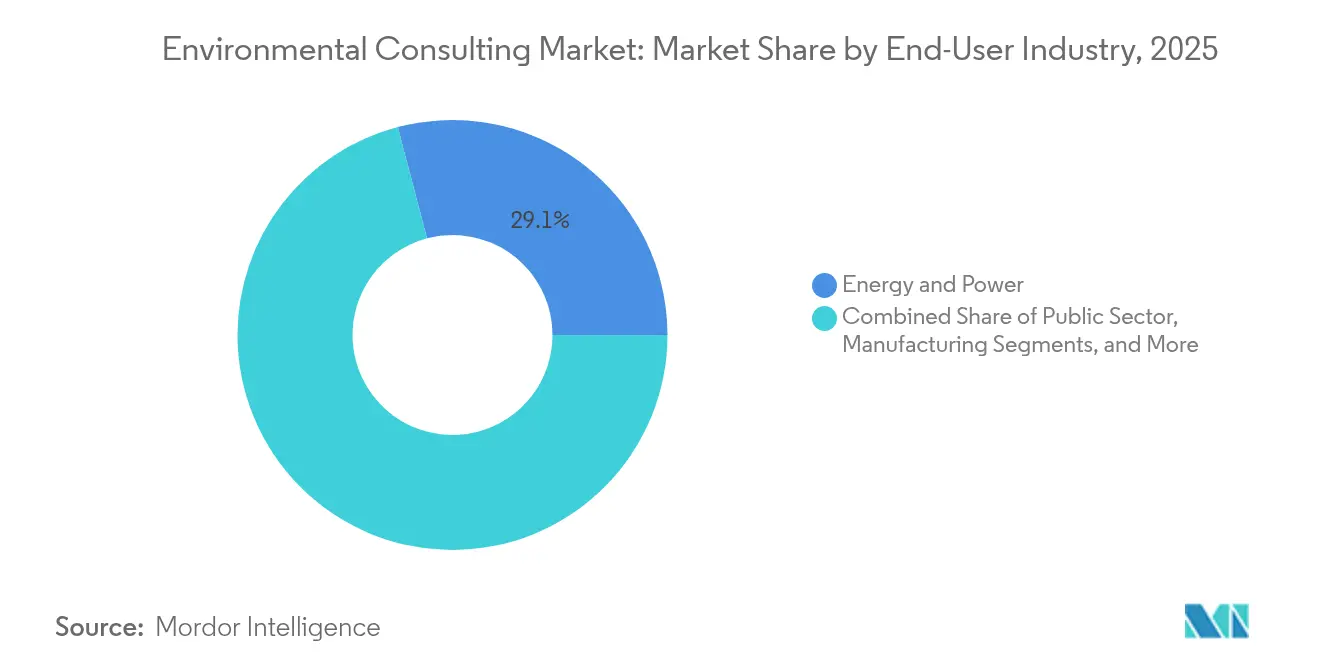
Public Sector Accelerates Infrastructure SpendPublic sector clients are projected to grow at a 6.72% CAGR as government agencies channel infrastructure budgets into climate-resilient transport, grid modernization, and water-quality upgrades. Funding guidelines frequently mandate independent environmental oversight, ensuring a consistent pipeline of advisory engagements. Energy and Power accounted for 29.10% of the environmental consulting market size in 2025, underpinned by renewable-generation build-out, grid interconnection studies, and repowering of legacy assets.
Mining and metals clients intensify tailings-risk assessments and critical-mineral sourcing evaluations, generating specialized work for firms with geo-environmental depth. Manufacturing demand revolves around supply-chain verification and industrial decarbonization audits. Pharmaceutical companies seek guidance on sustainable chemistry and disclosure alignment, while construction firms require green-building certification and climate-adaptation planning. Transportation projects, from urban rail to electric vehicle charging, rely on consultants for emissions modeling and permit acquisition, reinforcing the importance of sector-specific expertise.
Geography Analysis
North America Environmental Consulting Market
North America held 35.53% of environmental consulting market share in 2025, leveraging mature rules such as the National Environmental Policy Act that underpin steady demand for impact assessments and remediation. Federal infrastructure packages add long-cycle projects focused on climate resilience, water systems, and grid renewal, enhancing revenue visibility. Emerging state-level climate disclosure bills further amplify advisory pipelines.
APAC Environmental Consulting Market
Asia-Pacific leads regional growth at a 6.31% CAGR through 2031. China’s draft Ecological and Environmental Code consolidates fragmented regulations, compelling industrial operators to seek standardized consulting support. India’s renewable-energy targets and Make-in-India manufacturing expansion elevate demand for environmental permitting, while Southeast Asian countries adopt carbon-pricing and ESG reporting frameworks. Consultants with local regulatory fluency and global technical resources gain first-mover advantage.
EMEA and LATAM Environmental Consulting Market
Europe maintains robust activity through the EU Taxonomy and Corporate Sustainability Reporting Directive, which institutionalize disclosure obligations for thousands of firms. Consultants export their experience to jurisdictions adopting similar frameworks, transforming European expertise into a global competitive asset. Middle East and Africa present pockets of high growth tied to megaprojects and emerging water scarcity solutions, though uneven regulatory enforcement tempers market velocity. Latin America benefits from mining investments and renewable build-out but continues to battle political volatility and elongated permitting.
Regulatory Landscape
Environmental consulting demand is anchored in permitting and disclosure regimes that formalize environmental impact assessment, remediation, and ongoing reporting. In the United States, NEPA remains a core trigger for EIS/EA work. In early 2026, the Council on Environmental Quality (CEQ) finalized removal of its legacy NEPA implementing regulations from the Code of Federal Regulations, which shifts more responsibility to agency-specific procedures. EPA also proposed NEPA reforms on June 24, 2026, targeting a two-year average timeline for Environmental Impact Statements, reinforcing the market need for faster baseline data collection, alternatives analysis, and defensible documentation.
In Europe, mandatory corporate reporting under the EU Corporate Sustainability Reporting Directive (CSRD) and classification under the EU Taxonomy elevate the role of third-party environmental data, assurance readiness, and supply-chain substantiation. Product-focused compliance programs, including digital product passports and battery sustainability requirements, extend demand for lifecycle assessment, materials traceability, and verification services that environmental consultancies can package across multinational client footprints.
Competitive Landscape
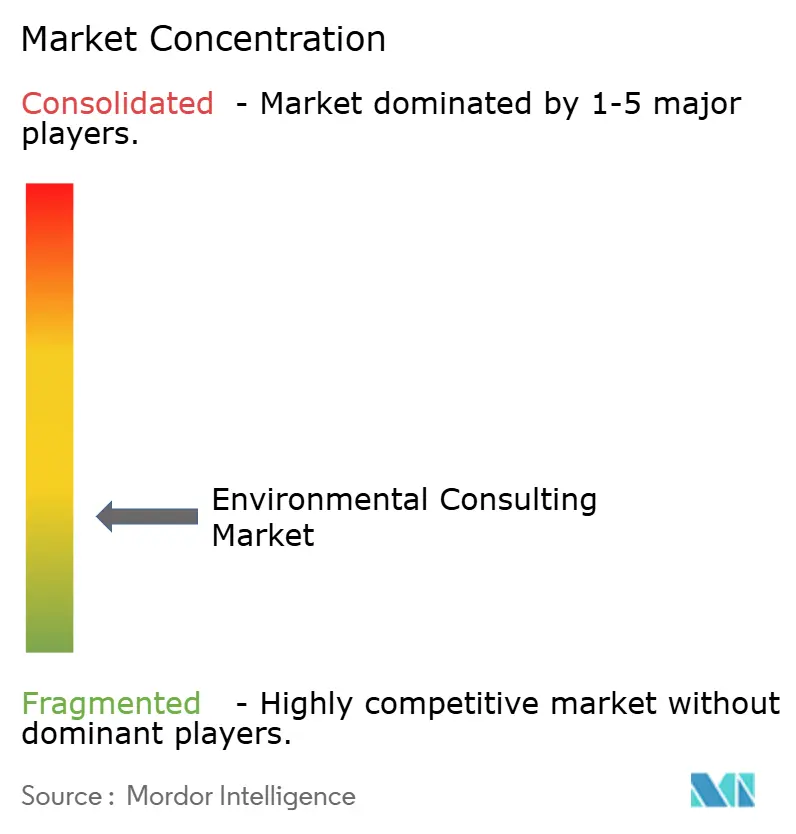
The environmental consulting market is moderately fragmented. Large integrated players such as WSP, AECOM, Jacobs, and Tetra Tech expand through acquisitions that add specialist capabilities and geographic reach. WSP’s USD 1.78 billion acquisition of Power Engineers in February 2025 broadened its power-sector depth and consolidated its renewable infrastructure credentials. Firms differentiate through digital delivery, sector specialization, and global compliance frameworks.
Boutique consultancies thrive in niches like biodiversity accounting and AI-enabled monitoring, where technical barriers protect fee levels. Partnerships with software vendors deliver integrated offerings that combine data platforms with advisory insight, reducing client friction and increasing stickiness. Standardization via ISO 14001 allows firms such as SLR Consulting to demonstrate quality across jurisdictions, bolstering their appeal to multinational clients.
Framework contracts exert downward price pressure for commoditized tasks, so margins increasingly depend on higher-complexity engagements tied to green finance verification, nature-positive assessments, and industrial decarbonization roadmaps. Talent scarcity in hydrogeology and toxicology elevates labor costs, making knowledge management and training critical differentiators.
Environmental Consulting Industry Leaders
-
Jacobs Solutions Inc.
-
AECOM
-
WSP Global Inc.
-
Stantec Inc.
-
Ramboll Group A/S
- *Disclaimer: Major Players sorted in no particular order
Environmental Consulting Market Companies Covered in this Report
- Jacobs Solutions Inc.
- AECOM
- WSP Global Inc.
- Tetra Tech, Inc.
- Stantec Inc.
- Ramboll Group A/S
- ERM International Group Limited
- Arup Group Limited
- GHD Group Pty Ltd
- Sweco AB
- Arcadis N.V.
- John Wood Group PLC (Wood)
- SNC-Lavalin Group Inc. (AtkinsRéalis)
- HDR, Inc.
- SLR Consulting Limited
- Antea Group N.V.
- Mott MacDonald Group Limited
- Montrose Environmental Group, Inc.
- Brown and Caldwell, Inc.
- Worley Limited
- ICF International, Inc.
- EA Engineering, Science, and Technology, Inc., PBC
- Cardno Limited
- Golder Associates Ltd.
Market Opportunities and Future Outlook
Large infrastructure and utility programs are creating whitespace for integrated environmental, engineering, and digital delivery, especially where owners need both compliance work and asset-level decision support. Water and wastewater opportunities stand out as consultancies build decision-layer analytics and program management capabilities, and recent contract activity supports this direction, including Jacobs' work with Singapore PUB on a potential desalination plant feasibility study (June 2026). On the public-sector side, U.S. permitting reform activity and EPA focus on NEPA process timelines are pushing clients to compress schedules, which favors firms that combine rapid site characterization, geospatial data, and standardized EIA workflows.
PFAS and emerging contaminant mandates continue to open higher-complexity remediation and technology evaluation engagements. This is evidenced by AECOM wins tied to federal and state programs, including a USACE Baltimore District environmental services award covering hazardous contaminants including PFAS (April 2026) and a MassDEP PFAS reduction and destruction pilot at municipal wastewater treatment plants (April 2026). On the corporate side, consolidation and capability-building in digital and advisory functions are expanding cross-sell potential into ESG reporting and transition planning, supported by transactions such as Jacobs completing its acquisition of the remaining stake in PA Consulting (January 2026) and WSP closing the acquisition of TRC Companies (February 2026), both of which broaden platforms for data-led environmental consulting delivery across energy, utilities, and infrastructure clients.
Recent Industry Developments in Environmental Consulting Market
- July 2026: Jacobs Solutions Inc. is selected by Great British Energy to provide strategic planning and consent support for new nuclear development at Gwyndod and Oldbury-on-Severn. The engagement expands Jacobs' foothold in UK nuclear-adjacent environmental advisory and lifecycle planning, signaling long-term project pipelines. The collaboration enhances resilience of critical energy infrastructure planning.
- June 2026: Jacobs Solutions Inc. is appointed by Singapore's PUB to deliver a feasibility study for a potential desalination plant, including design concepts and lifecycle cost evaluation. The assignment broadens Jacobs' water-security and strategic infrastructure capability in Asia-Pacific, expanding the addressable market for industrial water projects. The work strengthens cross-border water resilience consulting in a growing regional market.
- April 2026: AECOM is awarded a PFAS-focused environmental services contract by USACE Baltimore District to remediate hazardous contaminants. The contract deepens AECOM's involvement in federal remediation programs and PFAS related work, potentially boosting margins through specialized advisory and implementation. The award reinforces AECOM's position as a go-to provider for complex environmental cleanup programs.
Environmental Consulting Market Report Scope and Research Methodology
Market Definition and Coverage
For this study, the market covers third party professional services that help public and private organizations assess, manage, monitor, and improve environmental performance and regulatory compliance across projects and operations.
Scope exclusions: It excludes capital spending on remediation or treatment equipment, laboratory testing revenue, and software license only offerings when no advisory service is provided.
Segments Covered in This Report
- By Service Type
- Climate Change Consulting
- EHS
- Environmental Impact Assessment
- Water and Wastewater Management
- ESG Reporting and Sustainability Strategy
- Other Service Types (Includes Contaminated Site Assessment)
- By End-User Industry
- Energy and Power
- Mining and Metals
- Public Sector
- Manufacturing
- Pharmaceuticals
- Other End-user Industries (Construction and Infrastructure, Transportation, etc.)
- By Geography
- North America
- United States
- Canada
- Mexico
- South America
- Brazil
- Argentina
- Rest of South America
- Europe
- Germany
- United Kingdom
- France
- Italy
- Spain
- Poland
- Russia
- Rest of Europe
- Asia Pacific
- China
- India
- Japan
- South Korea
- Australia
- Rest of Asia Pacific
- Middle East and Africa
- Middle East
- Saudi Arabia
- United Arab Emirates
- Turkey
- Rest of Middle East
- Africa
- South Africa
- Nigeria
- Egypt
- Rest of Africa
- Middle East
- North America
Data Sources, Market Sizing, and Validation
Desk Research
Desk work starts by mapping the demand pools where environmental consulting is typically triggered, and then aligning them to service revenues that can be defended with public evidence. We rely on open, official source types such as the US EPA, the European Commission and ECHA, the World Bank, the OECD, and UN Environment publications to understand compliance cycles and policy direction that shape project volumes.
It is then complemented with company annual reports, investor decks, contract announcements, and reputed press coverage to anchor how services are packaged and priced over time. Where needed, we also refer to paid databases focused on company financials, news and financials, and patent databases to reduce blind spots around growth pockets and service innovation. These desk sources are not exhaustive, and many additional public references are used to collect, cross-check, and clarify data points.
Primary Interviews and Surveys
Primary work is used to pressure-test the desk assumptions on what is counted as consulting revenue, what is treated as pass-through cost, and how pricing changes with regulation intensity and project complexity. We spoke with a mix of consulting delivery leaders, compliance and EHS decision-makers, and procurement stakeholders across major regions so gaps in service scope and timing could be closed before finalizing the model.
Distribution of primary research fieldwork respondents
| Company type | Respondent position | Region |
|---|---|---|
| Top tier: 32% | CXOs: 16% | APAC: 49% |
| Mid tier: 50% | Functional/Unit leaders: 32% | EMEA: 32% |
| Smaller Players: 18% | Managers: 52% | Americas: 19% |
Market-Sizing & Forecasting
Sizing begins with a top-down build where environmental compliance workload and project activity are translated into addressable advisory spend, using service intensity and typical fee structures as the connecting logic. The totals are then corroborated with selective bottom-up approximations, such as sampled revenue roll ups from public company disclosures, channel checks on framework agreements, and volume by average billing-rate checks for common engagement types.
Key inputs that guide the model include the pace of environmental permitting and impact assessment activity, enforcement and inspection intensity, industrial capex cycles in energy and infrastructure, remediation and site assessment pipeline signals, and the share of corporate programs tied to ESG reporting and assurance style work. For forecasting, scenario analysis is used around policy and capex uncertainty, and then smoothed with time-series techniques so short-term spikes do not overstate the medium-term run rate. Where bottom-up visibility is weak in fragmented local markets, gaps are handled through conservative adoption and utilization assumptions that are validated in interviews and revisited during review.
Data Validation & Update Cycle
Outputs are checked against independent signals like disclosed consulting segment revenues, public tender patterns, and region-level policy and permitting momentum, and then the differences are investigated before sign-off. Outliers are stress-tested by changing one major driver at a time, which helps confirm the estimate is not overly dependent on a single assumption.
Analyst reviews happen in steps, with re-checks triggered when new regulation, currency moves, or large contract wins or delays materially shift the run rate. Reports are refreshed annually, with interim updates for material events, and a final pre-delivery pass is completed so clients receive the latest updated view.
Mordor Intelligence's Environmental Consulting Market Size Versus Other Published Estimates
Published values for environmental consulting often differ because the counted services are not identical, and the timing of pricing and currency translation can shift the same demand pool into different dollar totals. Even when geography sounds similar, some estimates lean on supplier lists, while others lean on regulation or project activity signals, which changes the final number.
The biggest gaps usually come from whether sustainability advisory is fully blended into environmental consulting, how pass-through costs are treated, and whether figures are reported in current or constant dollars. By refreshing exchange rates and typical billing assumptions closer to the base year, and then re-checking them with interview feedback, the estimate stays tied to a repeatable fee and volume logic, which is the approach applied by Mordor Intelligence.
Benchmark comparison
| Source | Market Size | Gaps in Research Methodology |
|---|---|---|
| Mordor Intelligence | USD 46.50 B (2025) | |
| Industry Journal A | USD 58.80 B (2024) | Uses a broader environmental and sustainability consulting definition and is built from a selected set of large firm revenues, which can pull in adjacent sustainability programs beyond core environmental engagements. |
| Trade Publisher B | USD 60.00 B (2024) | Reports a rounded total for an E&S consulting scope and provides limited visibility on currency timing and pass-through cost handling, which can inflate service revenue comparisons across regions. |
The spread in the table is mainly explained by service-boundary choices and how revenue is recognized and converted across regions. When scope is kept to environmental consulting work and the pricing and currency assumptions are kept current and cross-checked, the resulting total is easier to trace back to clear drivers and to update consistently over time.
Key Questions Answered in the Report
What is the projected value of the environmental consulting market in 2031?
The environmental consulting market is expected to reach USD 65.72 billion by 2031.
Which service type is growing fastest within environmental consulting?
ESG Reporting and Sustainability Strategy leads growth at a 6.12% CAGR through 2031.
Which region is forecast to post the highest growth rate?
Asia-Pacific is projected to expand at a 6.31% CAGR through 2031, driven by regulatory tightening and industrial decarbonization mandates.
How large is public-sector demand for consulting services?
Public-sector engagements are the fastest-growing end-user segment with a 6.72% CAGR to 2031, underpinned by infrastructure stimulus and climate-resilience planning.
What factors are putting pressure on consulting fees?
Multi-year framework contracts that bundle services and mandate annual cost-downs compress margins for commoditized compliance work.
Which technology trend is most disruptive for consultant workflows?
AI-enabled site-characterization tools that combine remote sensing and machine learning sharply reduce due-diligence timelines and alter traditional field-based service models.