
Enterprise Performance Management Market Size and Share
Market Overview
| Study Period | 2020 - 2031 |
|---|---|
| Market Size (2026) | USD 7.69 Billion |
| Market Size (2031) | USD 11.89 Billion |
| Growth Rate (2026 - 2031) | 9.11 % |
| Fastest Growing Market | Asia Pacific |
| Largest Market | North America |
| Market Concentration | Medium |
Major Players *Disclaimer: Major Players sorted in no particular order Image © Mordor Intelligence. Reuse requires attribution under CC BY 4.0. | |
Enterprise Performance Management Market Analysis by Mordor Intelligence
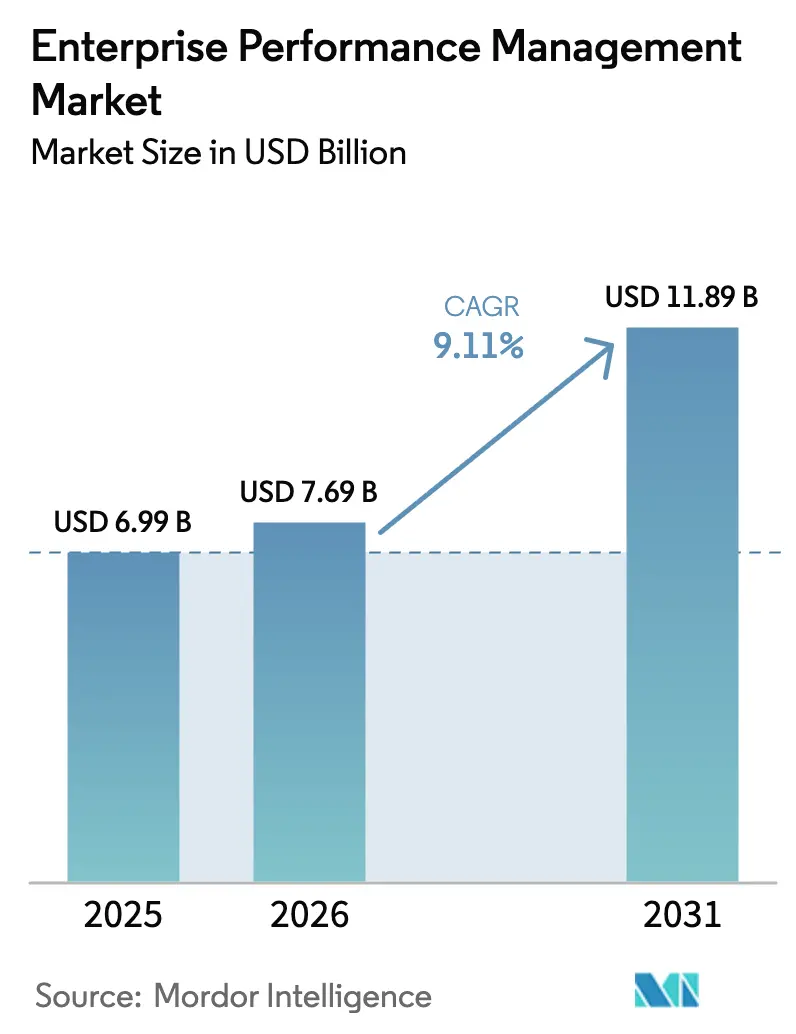
The Enterprise Performance Management Market size is projected to expand from USD 6.99 billion in 2025 and USD 7.69 billion in 2026 to USD 11.89 billion by 2031, registering a CAGR of 9.11% between 2026 to 2031.
Continuous, AI-assisted scenario modelling is supplanting legacy annual budgeting, allowing finance teams to recalibrate quarterly forecasts in hours. Mandatory disclosures such as the European Union’s Corporate Sustainability Reporting Directive are pulling non-financial data most notably carbon-intensity metrics into the same planning workflows that govern cash-flow projections. Mid-market organizations in North America are accelerating cloud migration to cut close cycles by up to 40%, while large banks integrate climate-risk stress tests directly into EPM models to meet updated regulatory guidelines. Competitive dynamics favour vendors able to embed generative AI and ESG functionality natively, pushing the market toward unified data models that eliminate reconciliation overhead.
Key Report Takeaways
- By component, solutions captured 71.42% of 2025 revenue, whereas services are advancing at a 9.89% CAGR through 2031.
- By deployment mode, cloud installations accounted for 66.58% of the 2025 base, and the segment is expanding at a 9.57% CAGR to 2031.
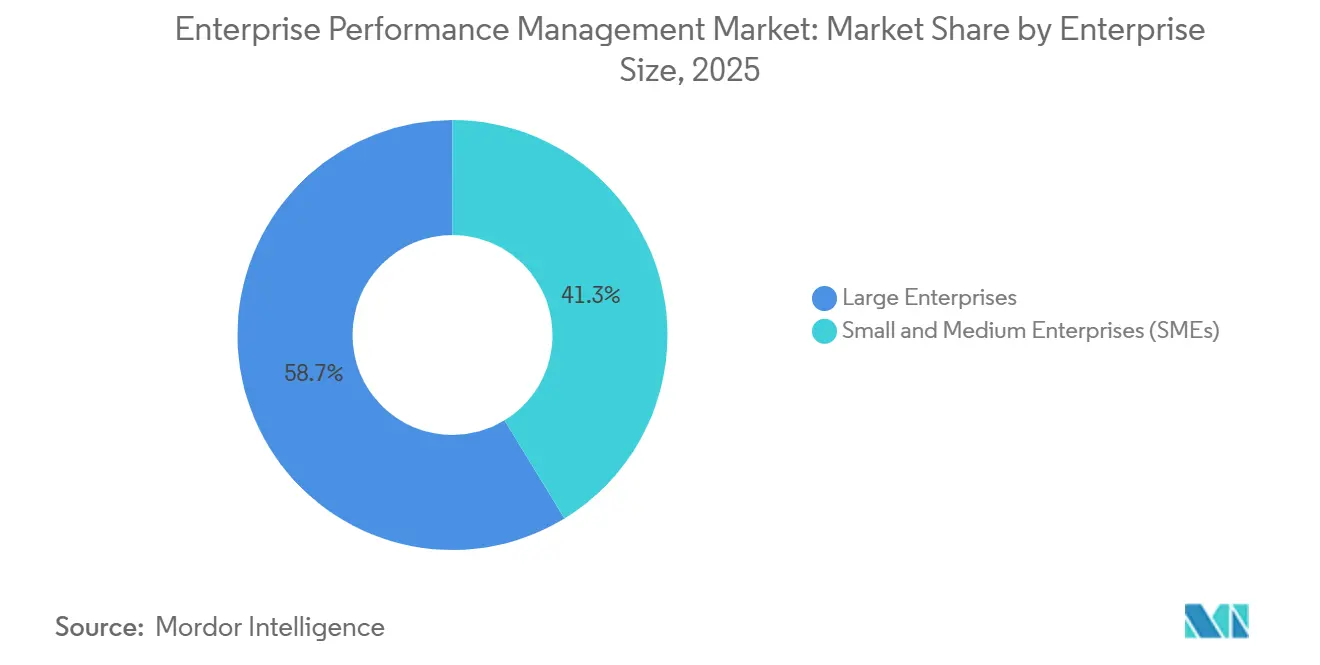
- By enterprise size, large enterprises owned 58.72% of 2025 spending, but small and medium enterprises are set to grow at a 10.01% CAGR.
- By end-user industry, banking, financial services, and insurance held 24.29% of 2025 spending, while healthcare is forecast to rise at a 10.34% CAGR to 2031.
- By geography, North America accounted for 41.37% of the market in 2025, while Asia Pacific represented 10.46% of global revenue, with the remaining 48.17% contributed by other regions.
Note: Market size and forecast figures in this report are generated using Mordor Intelligence’s proprietary estimation framework, updated with the latest available data and insights as of January 2026.
Market Trends and Insights
Drivers Impact Analysis of Enterprise Performance Management Market*
| Driver | (~) % Impact on CAGR Forecast | Geographic Relevance | Impact Timeline |
|---|---|---|---|
| Shift to Cloud-Native EPM Suites for Real-Time FP&A in Mid-Market North America | +1.80% | North America, spillover to Europe and Asia Pacific | Medium term (2-4 years) |
| Integration of AI/ML for Scenario Modeling in European Multinationals | +1.50% | Europe, North America, Asia Pacific | Medium term (2-4 years) |
| Convergence of EPM with ESG and Integrated Reporting Mandates in EU | +1.30% | Europe, expanding to North America and Asia Pacific | Long term (≥ 4 years) |
| Digital Finance Transformation Programs Spurred by US SOX Modernization Act | +1.00% | North America, multinational corporations globally | Short term (≤ 2 years) |
| Adoption of xP&A Across Global Retail Supply Chains | +1.20% | Global, with concentration in North America, Europe, Asia Pacific | Medium term (2-4 years) |
| Rise of API-First Composable Finance Architectures Enabling Plug-and-Play EPM Modules | +1.40% | Global, early adoption in North America and Europe | Medium term (2-4 years) |
| Source: Mordor Intelligence | |||
Shift to Cloud-Native EPM Suites for Real-Time FP-and-A in Mid-Market North America
Mid-market companies are discarding on-premises consolidation tools in favour of cloud suites that deliver real-time variance analysis and rolling forecasts. Subscription pricing removes upfront capital expenditure, while mobile access supports remote work patterns. Oracle reported 25% year-over-year growth in Fusion Cloud EPM bookings for organizations with USD 500 million-USD 2 billion in annual revenue.[1] Workday noted that its Adaptive Planning customer count exceeded 6,500 in early 2025, up 30% from 2024, attributing the expansion to embedded anomaly-detection models.[2] Natural-language query interfaces are widening user adoption beyond finance specialists.
Integration of AI and ML for Scenario Modelling in European Multinationals
European manufacturers and pharmaceutical firms have embraced probabilistic forecasting to account for currency swings and supply-chain shocks. Anaplan disclosed that 40% of its European customers adopted the Predictive Insights engine within 12 months of launch. IBM added automated what-if generation to Planning Analytics in late 2024, enabling thousands of scenario permutations in minutes. Regulatory drivers amplify demand: updated European Banking Authority stress tests require climate-risk simulations over decade-long horizons.
Convergence of EPM with ESG and Integrated Reporting Mandates in the EU
The Corporate Sustainability Reporting Directive obliges roughly 50,000 companies to publish environmental and social metrics alongside financials, forcing alignment between sustainability and finance data pipelines.[3] Wolters Kluwer launched an ESG module for CCH Tagetik that cuts manual data entry by 60%, while OneStream embedded carbon accounting into its unified platform in 2025. Early adopters report 30% shorter audit preparation cycles because non-financial disclosures now share lineage with statutory actuals.
Adoption of xP-and-A Across Global Retail Supply Chains
Retailers link procurement, inventory, and promotions within a single planning model to manage volatile demand. Board International’s Intelligent Planning Platform helped a European grocer reduce stockouts by 18% while safeguarding margins. Workday’s 2025 roadmap introduced workforce-planning modules that connect store labour budgets to traffic forecasts, tightening alignment between operations and finance. McKinsey research found 20-30% gains in seasonal forecast accuracy when merchants integrated point-of-sale data and weather information.
Restraints Impact Analysis of Enterprise Performance Management Market*
| Restraint | (~) % Impact on CAGR Forecast | Geographic Relevance | Impact Timeline |
|---|---|---|---|
| Data-Quality Silos in Decentralized ERP Landscapes of Large Asian Conglomerates | -0.90% | Asia Pacific, particularly China, India, Japan, South Korea | Medium term (2-4 years) |
| Shortage of FPandA Talent Restricting Advanced EPM Rollouts in Europe | -0.70% | Europe, spillover to North America | Long term (≥ 4 years) |
| Perceived Security Risks Hindering Cloud Migration in Middle East Financial Institutions | -0.50% | Middle East, particularly UAE, Saudi Arabia | Short term (≤ 2 years) |
| High TCO for Multi-Module EPM Suites among Latin American SMEs | -0.60% | Latin America, particularly Brazil, Argentina | Medium term (2-4 years) |
| Source: Mordor Intelligence | |||
Shortage of FP-and-A Talent Restricting Advanced EPM Rollouts in Europe
CFOs struggle to recruit analysts who can configure driver-based models and interpret machine-learning outputs. PwC’s 2025 workforce survey indicated that 58% of European finance leaders cite FP-and-A talent shortages as a top three obstacle. Deloitte observed that average project timelines have stretched to nine months, versus six in North America, due to extended user training. Professional bodies have launched cloud-EPM certifications, yet supply remains insufficient.
Perceived Security Risks Hindering Cloud Migration in Middle East Financial Institutions
Banks in the UAE and Saudi Arabia hesitate to place balance-sheet data on global clouds given data-sovereignty rules. The UAE Data Protection Law mandates local storage of resident data, complicating single-tenant deployments. Saudi guidelines require regulatory approval before transferring critical information abroad. Oracle and SAP have opened regional cloud regions, but premium pricing and lengthy audits dilute immediate ROI. Analysts expect convergence toward international standards within two to three years.
*Our forecasts treat driver/restraint impacts as directional, not additive. The impact forecasts reflect baseline growth, mix effects, and variable interactions.
Enterprise Performance Management Market Segment Analysis
By Component:
Services Gain as Implementation Complexity RisesSolutions accounted for 71.42% of 2025 revenue, reaffirming software subscriptions as the primary spending driver in the Enterprise Performance Management market. Services, however, are growing faster at a 9.89% CAGR because multi-module deployments across finance, sales, and supply-chain functions require change-management, data-integration, and training expertise that most organizations lack internally. Advisory firms reported 35% headcount growth in EPM practices to meet this demand.
Service momentum is sustained by subscription-based managed offerings that provide monthly close assistance and model tuning. Implementation projects average six to nine months, and enterprises allocate 40-50% of their budgets to workshops that align operational and financial metrics. As generative-AI copilots proliferate, user-training packages are expanding to include prompt-engineering curricula, further lifting services revenue.

By Deployment Mode:
Cloud Dominance DeepensCloud installations represented 66.58% of the 2025 base and are advancing at a 9.57% CAGR, underscoring a decisive shift in the Enterprise Performance Management market toward subscription delivery. API-first architectures allow finance leaders to layer best-of-breed modules onto existing ERP cores without disruptive replacements. On-premises footprints persist in defense and certain financial sectors with strict data-localization mandates.
Quarterly feature updates on multi-tenant clouds shrink the innovation gap, delivering AI forecasting and natural-language query tools without protracted upgrades. Hybrid deployments, mixing on-premises transaction processing with cloud planning, are emerging in jurisdictions such as China where residency rules remain stringent. Sovereign-cloud offerings promise further momentum by satisfying local compliance without sacrificing elasticity.
By Enterprise Size:
SMEs Accelerate AdoptionLarge enterprises claimed 58.72% of 2025 spending thanks to complex consolidation needs, yet SMEs are set to grow at a 10.01% CAGR, widening overall penetration in the Enterprise Performance Management market. Low-code platforms priced between USD 10,000 and USD 50,000 annually have lowered barriers for finance teams of fewer than ten employees. Subscription models let smaller firms add modules incrementally as scale dictates.
Large organizations maintain absolute spending leadership due to multi-currency consolidations and integrated ESG reporting. Still, SME-targeted vendors such as Vena and Prophix reported double-digit growth by packaging pre-built templates and low-code configuration wizards. Private-equity ownership accelerates adoption as portfolio companies standardize reporting.
By End-User Industry:
Healthcare Surges on Value-Based CareBFSI captured 24.29% of 2025 expenditure, driven by Basel III capital reporting and real-time profitability analysis, yet healthcare is the fastest-rising segment at a 10.34% CAGR as providers pivot to value-based reimbursement. Hospitals leverage EPM to tie clinical outcomes such as readmission rates to financial forecasts, positioning the Enterprise Performance Management market to support dynamic cost-allocation across departments.
Financial institutions continue to expand models to incorporate climate-risk adjustments under evolving regulatory regimes, while manufacturers and retailers embed xP-and-A to align production and inventory with volatile demand. Government agencies adopt EPM to meet transparency mandates requiring monthly budget-versus-actual disclosures.
Geography Analysis
North America Enterprise Performance Management Market
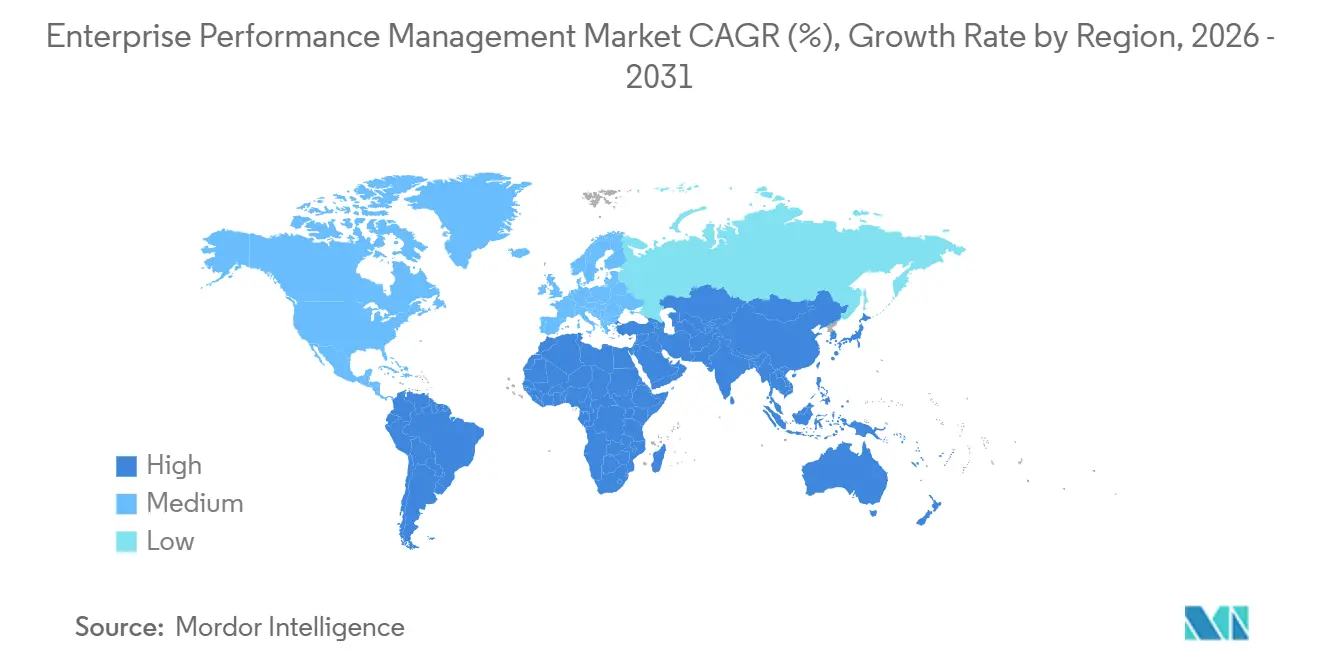
North America retained 41.37% of 2025 revenue, reflecting early cloud adoption and Sarbanes-Oxley driven audit controls. U.S. mid-market firms migrate to AI-enabled suites to trim close cycles, whereas Canadian corporates integrate ESG data to comply with federal climate-disclosure rules. Mexico’s shared-service expansion fuels multi-currency consolidation demand. Platform consolidation trends favour unified suites that lower total cost of ownership.
APAC Enterprise Performance Management Market
Asia Pacific is the fastest-growing region at a 10.46% CAGR, led by transformation programs in India and China where conglomerates standardize planning across numerous subsidiaries. Japanese reforms mandating quarterly guidance accelerate cloud-planning uptake. Data-quality silos, however, lengthen implementations by up to 50% in decentralized ERP environments.
EMEA and LATAM Enterprise Performance Management Market
Europe’s trajectory is shaped by ESG reporting convergence, with large corporates integrating carbon metrics into statutory workflows. The Middle East faces adoption headwinds due to security concerns, despite new in-country cloud regions, while Latin American SMEs wrestle with total cost of ownership amidst currency volatility. Africa’s nascent market centers on South African and Nigerian banks implementing EPM to support regional expansion.
Regulatory Landscape
EPM deployments increasingly sit inside regulated disclosure and assurance workflows, especially as sustainability reporting and AI-assisted decision support move deeper into finance planning. In the European Union, the Corporate Sustainability Reporting Directive (CSRD) is pulling non-financial metrics into the same planning, consolidation, and audit-prep processes used for statutory reporting, which raises requirements for data lineage, controls, and documentation inside EPM environments.
Software governance and security standards also shape vendor selection and deployment architecture. In the United States, NIST updated guidance that ties cybersecurity to enterprise risk management, including the NIST Cybersecurity Framework 2.0 quick-start materials (March 2026) and NIST Special Publication 800-18r2 (June 30, 2026). Separately, EU AI Act obligations (Regulation (EU) 2024/1689) introduce transparency and governance requirements for certain AI uses, influencing how organizations configure AI features, human oversight, and logging in enterprise software used for automated decisions and monitoring.
Competitive Landscape
The top five vendors Oracle, SAP, Workday, IBM, and Anaplan held roughly 45-50% of 2025 revenue, indicating moderate concentration within the Enterprise Performance Management market. ERP incumbents cross-sell planning modules that inherit native data integrations, but pure plays such as OneStream, Planful, Vena, and Prophix win multi-ERP environments through unified data models that eliminate reconciliation. OneStream surpassed 1,400 customers by combining consolidation, planning, reporting, and ESG in a single platform.
Strategic focus converges on three themes: embedding generative AI to automate variance narratives, expanding into ESG and supply-chain planning, and deepening vertical specialization. SAP’s Joule copilot enables natural-language queries, while Oracle patented ML algorithms that flag consolidation anomalies. Talent shortages in Europe create service-partner opportunities, prompting vendors to add low-code configuration to reduce dependency on scarce FP-and-A experts.
Midsized healthcare and retail remain white-space opportunities, as unified EPM-ESG and xP-and-A capabilities are still nascent in those verticals. Sovereign-cloud offerings are emerging as a regional differentiator in markets with stringent residency rules, potentially reshuffling regional vendor rankings over the next four years.
Enterprise Performance Management Industry Leaders
-
IBM Corporation
-
SAP SE
-
Oracle Corporation
-
CA Technologies (Broadcom Inc.)
-
Capgemini SE
- *Disclaimer: Major Players sorted in no particular order

Enterprise Performance Management Market Companies Covered in this Report
- Oracle Corporation
- SAP SE
- IBM Corporation
- Broadcom Inc. (CA Technologies)
- Capgemini SE
- Workday Inc.
- Anaplan Inc.
- Infor Inc.
- Wolters Kluwer N.V. (CCH Tagetik)
- Board International S.A.
- OneStream Software LLC
- Planful Inc.
- Vena Solutions Inc.
- Prophix Software Inc.
- Jedox AG
- Solver Inc.
- Kepion Inc.
- Longview Solutions Inc.
- BlackLine Inc.
- Kaufman Hall and Associates LLC (Axiom)
- Unit4 N.V.
- Centage Corporation
- Host Analytics Inc. (legacy)
- Insightsoftware Inc.
- Syntellis Performance Solutions
Read Analysis of Enterprise Performance Management Companies
Market Opportunities and Future Outlook
Unified finance and sustainability data models remain a clear whitespace as CSRD-driven reporting expands the breadth of non-financial KPIs managed alongside budgets, forecasts, and consolidation. Vendors that natively connect ESG data capture, audit trails, and disclosure-ready reporting inside core EPM workflows are drawing attention, including Wolters Kluwer adding an ESG module to CCH Tagetik and OneStream embedding carbon accounting into its platform (2025). This supports regulated industries and multinational groups that benefit from shared lineage between financial actuals and non-financial disclosures during audit preparation.
A second opportunity is operationalizing continuous planning and AI-assisted finance processes beyond annual budgeting, particularly in cloud-first mid-market segments and multi-ERP enterprises that want to reduce reconciliation overhead. Pull-through is visible in adoption signals and platform roadmaps, including Workday reporting an Adaptive Planning customer count exceeding 6,500 in early 2025, and Oracle highlighting mid-market momentum in Fusion Cloud EPM bookings. Oracle’s Cloud EPM generative AI capabilities are tied to specific platform updates (26.04 or later), which effectively creates a defined upgrade cycle through mid-2026 and can increase services demand for integration, controls, and model governance as organizations move from pilot AI features to production-grade planning and close workflows.
Recent Industry Developments in Enterprise Performance Management Market
- July 2026: SAP and IBM highlighted continued client momentum using IBM technology with SAP Cloud ERP Private to support AI innovation. The update reinforces enterprise demand for private-cloud deployment options that keep planning and core ERP controls aligned while still enabling AI-enabled planning workflows. It also strengthens the partner ecosystem narrative around deploying AI capabilities in regulated and control-heavy environments.
- May 2026: SAP announced an agreement to acquire Dremio to unify SAP and non-SAP data for agentic AI use cases. The acquisition targets a key EPM implementation bottleneck, data fragmentation across ERP and non-ERP sources, and supports more reliable scenario modeling and planning on unified data layers. It raises competitive pressure on EPM platforms to improve interoperability and data management for multi-system customers.
- January 2025: IBM announced plans to acquire Application Software Technology LLC (AST), a consultancy focused on Oracle Cloud Applications including Oracle Cloud EPM. Expanding Oracle Cloud EPM services capacity supports faster migrations and more complex multi-module deployments where customers rely on external implementation and change management expertise. The deal also signals continued consolidation among service partners supporting cloud EPM rollouts.
Enterprise Performance Management Market Report Scope and Research Methodology
Market Definition and Coverage
The enterprise performance management market covers software and related services that help organizations plan, budget, forecast, consolidate results, and track performance through reporting and analytics across functions.
In scope exclusions, we leave out basic spreadsheets and general purpose dashboards that do not provide purpose-built EPM workflows for planning, consolidation, and performance tracking.
Segments Covered in This Report
- By Component
- Solutions
- Services
- By Deployment Mode
- Cloud
- On-Premise
- By Enterprise Size
- Small and Medium Enterprises (SMEs)
- Large Enterprises
- By End-user Industry
- BFSI
- IT and Telecom
- Healthcare
- Manufacturing
- Retail and E-Commerce
- Energy and Utilities
- Government and Public Sector
- Other End-user Industries
- By Geography
- North America
- United States
- Canada
- Mexico
- Europe
- Germany
- United Kingdom
- France
- Italy
- Spain
- Rest of Europe
- Asia Pacific
- China
- Japan
- India
- South Korea
- Southeast Asia
- Rest of Asia Pacific
- South America
- Brazil
- Argentina
- Rest of South America
- Middle East
- UAE
- Saudi Arabia
- Turkey
- Rest of Middle East
- Africa
- South Africa
- Nigeria
- Rest of Africa
- North America
Data Sources, Market Sizing, and Validation
Desk Research
Desk research was used to build a starting point for demand signals and adoption context, before any numbers were modeled. We referenced public sources such as US SEC filings and annual reports, investor presentations, and product documentation to understand how EPM is packaged, priced, and commonly deployed.
To ground the model in external indicators, we also reviewed US Bureau of Economic Analysis data and US Bureau of Labor Statistics employment series for finance and analytics roles, along with OECD digital economy indicators and World Bank macro data to gauge business spending direction. We scanned patents and peer reviewed research to track changes in planning and analytics features, and used a paid subscription for company financials plus a patent database to speed up cross checks. These examples are not exhaustive, and other public sources were used for data collection, validation, and clarification during the research.
Primary Interviews and Surveys
Primary interviews and surveys were used to pressure test what desk research cannot resolve well, including module mix, cloud migration pace, and typical implementation and support attach rates. We spoke with a mix of solution providers, implementation partners, and enterprise buyers across APAC, EMEA, and the Americas, so adoption and renewal assumptions could be adjusted to reflect how budgets are released and renewed in practice.
Distribution of primary research fieldwork respondents
| Company type | Respondent position | Region |
|---|---|---|
| Top tier: 39% | CXOs: 14% | APAC: 41% |
| Mid tier: 47% | Functional/Unit leaders: 35% | EMEA: 33% |
| Smaller Players: 14% | Managers: 51% | Americas: 26% |
Market-Sizing & Forecasting
The sizing starts with a top-down approach where overall enterprise software and analytics spending patterns are reconstructed into an EPM demand pool using adoption and deployment cues from public filings and expert feedback. After building that ceiling, we corroborate it with selective bottom-up approximations, including sampled vendor revenue mix, channel checks from service partners, and volume by deal size bands multiplied by typical annual contract values, then adjust to avoid double counting.
Key inputs in the model include the cloud versus on-premise mix, the share of services attached to software rollouts (implementation, integration, training, and support), the frequency of renewals and expansions, and the split of finance-led versus cross functional deployments that bring in sales and supply chain use cases. We also track regional enterprise digitization indicators, macro conditions that influence budgeting cycles, and observable changes in reporting and compliance workloads that tend to increase consolidation and planning needs.
For forecasting, we ran scenario analysis anchored on expected cloud adoption and services attach rates, followed by sensitivity checks for macro spending and periods when IT budgets are more cautious. Where bottom-up signals were incomplete in smaller regions or niche industries, we applied ratio-based scaling from better observed markets, and then rechecked the results with interview feedback.
Data Validation & Update Cycle
Validation is done through repeated triangulation across the model outputs, public revenue signals, and independent adoption indicators so the final number stays explainable. Outliers are reviewed when regional splits, growth rates, or implied pricing move away from what respondents describe as realistic, and we re-contact stakeholders when a key assumption shifts.
Before sign-off, the work is reviewed through multi-step analyst checks, with variance checks run across time series to challenge and reconcile sudden jumps. Reports are refreshed annually, with interim updates when material events affect demand, pricing, or delivery models, and a final pre-delivery pass is completed so clients receive the most current view.
Mordor Intelligence's Enterprise Performance Management Market Estimate Compared With Other Published Estimates
Published market sizes for enterprise performance management do not always match, because each publisher makes different choices on what is counted, which year is treated as the anchor, and how fast cloud and services revenue is assumed to grow.
The differences usually come from scope edges like whether services are fully included, how multi module suites are treated versus adjacent planning and analytics tools, and whether reported numbers reflect an aggressive or conservative spending cycle. Currency conversion timing and refresh cadence also matter because pricing and renewals can shift quickly when budgeting sentiment changes.
Benchmark comparison
| Source | Market Size | Gaps in Research Methodology |
|---|---|---|
| Mordor Intelligence | USD 6.99 B (2025) | |
| Global Consultancy A | USD 6.30 B (2025) | This estimate tends to land lower when services are treated as a narrower add-on and when multi-module rollouts are not fully counted until after stabilization, which reduces near-term recognized value. |
| Industry Publisher B | USD 7.16 B (2025) | This figure is higher partly because the outlook assumes faster cloud expansion and broader inclusion of adjacent performance analytics and planning tools, which can pull in spend that some buyers still treat as general analytics. |
The table shows a spread around the same year. In Mordor Intelligence's model, the market includes solutions plus the commonly attached implementation and support services, with cloud and on-premise counted only when they meet the EPM workflow definition. When scope edges and growth assumptions are clarified in this way, the resulting total stays traceable to repeatable inputs like deployment mix, attach rates, renewals, and region level spending signals.
Key Questions Answered in the Report
What is the projected value of the Enterprise Performance Management market by 2031?
The market is forecast to reach USD 11.89 billion in 2031, rising at a 9.11% CAGR from 2026.
Which deployment mode is growing fastest in Enterprise Performance Management?
Cloud deployment is expanding at a 9.57% CAGR, driven by API-first architectures and subscription pricing.
Why are services outpacing software growth in Enterprise Performance Management?
Organizations need external expertise to configure multi-module suites, integrate ESG data, and train users on AI features, lifting services to a 9.89% CAGR.
Which region is expected to grow quickest through 2031?
Asia Pacific leads with a 10.46% CAGR, propelled by large-scale finance-transformation programs in China and India.
How is ESG regulation influencing Enterprise Performance Management adoption?
EU mandates require companies to consolidate non-financial KPIs with financials, spurring demand for unified EPM-ESG platforms that cut audit prep time by 30%.
What competitive advantage do pure-play vendors hold over ERP incumbents?
Pure plays offer unified data models and vertical-specific features that minimize reconciliation work in heterogeneous ERP landscapes, winning deals in multi-system environments.