
Enterprise Manufacturing Intelligence Market Size and Share
Market Overview
| Study Period | 2020 - 2031 |
|---|---|
| Market Size (2026) | USD 5.03 Billion |
| Market Size (2031) | USD 13.92 Billion |
| Growth Rate (2026 - 2031) | 22.60% CAGR |
| Fastest Growing Market | Asia Pacific |
| Largest Market | North America |
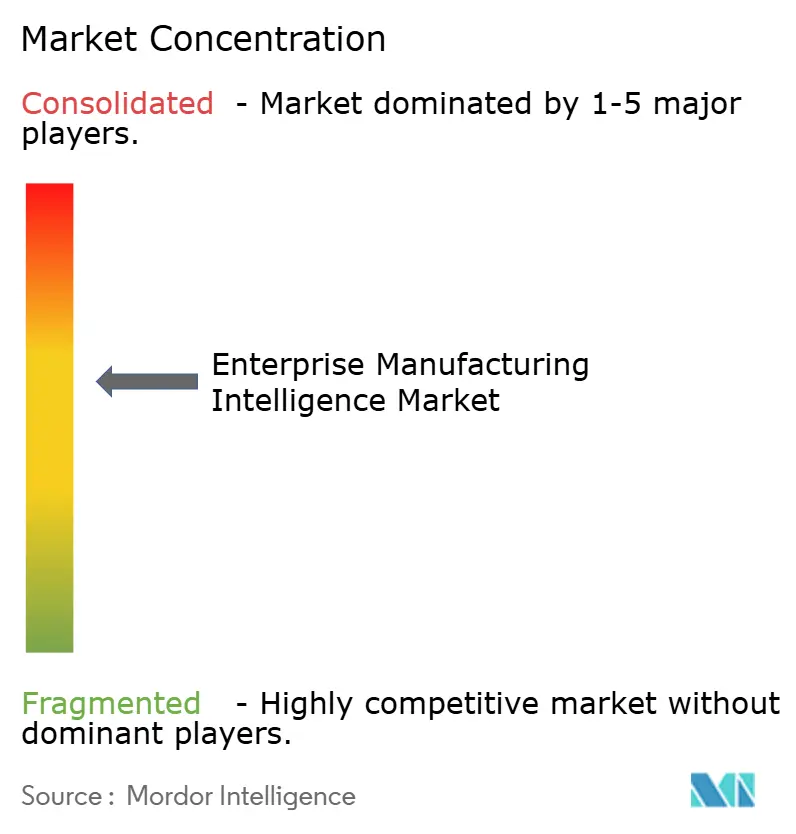
| Market Concentration | Medium |
Major Players *Disclaimer: Major Players sorted in no particular order Image © Mordor Intelligence. Reuse requires attribution under CC BY 4.0. | |
Enterprise Manufacturing Intelligence Market Analysis by Mordor Intelligence
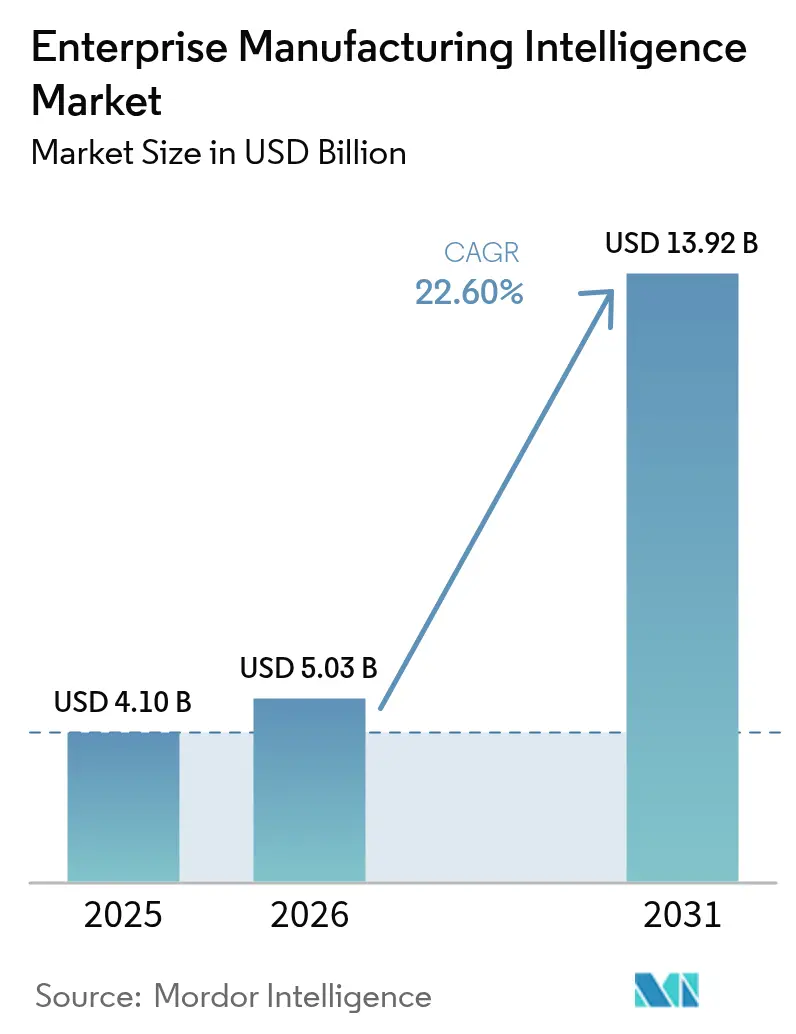
The Enterprise Manufacturing Intelligence market size was valued at USD 4.1 billion in 2025 and estimated to grow from USD 5.03 billion in 2026 to reach USD 13.92 billion by 2031, at a CAGR of 22.6% during the forecast period (2026-2031). Robust demand stems from manufacturers replacing stand-alone automation with predictive systems that blend operational technology and artificial intelligence. Continuous investments in private 5G networks, edge computing, and digital twins shorten decision cycles, while policy incentives link overall equipment effectiveness (OEE) to green financing. Moderate competitive intensity lets incumbents monetize installed bases even as cloud-native specialists court fast adopters. Heightened cyber-security risks, talent gaps in IT-OT integration, and macro-economic uncertainty remain headwinds, but documented returns such as 10-15% OEE gains and up to 60% lower quality-control costs sustain capital allocation.[1]European Commission, “Clean Industrial Deal Factsheet,” europa.eu
Key Report Takeaways
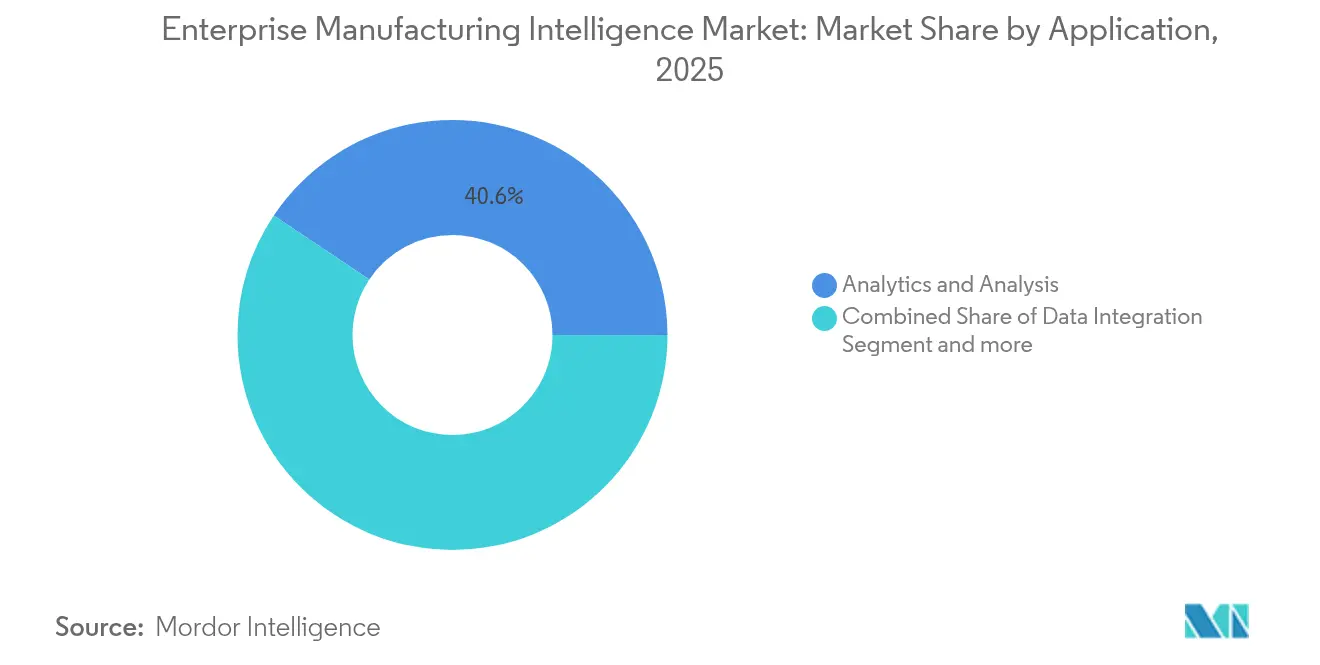
- By application, Analytics and Analysis led with 40.62% revenue share in 2025; Workflow and KPI Management is forecast to advance at a 27.09% CAGR through 2031.
- By end-user industry, automotive held 23.52% of the Enterprise Manufacturing Intelligence market share in 2025, while pharmaceuticals and biotechnology are set to expand at a 25.54% CAGR to 2031.
- By deployment mode, on-premises accounted for 54.22% of the Enterprise Manufacturing Intelligence market size in 2025; cloud-native deployments will grow at a 27.68% CAGR through 2031.
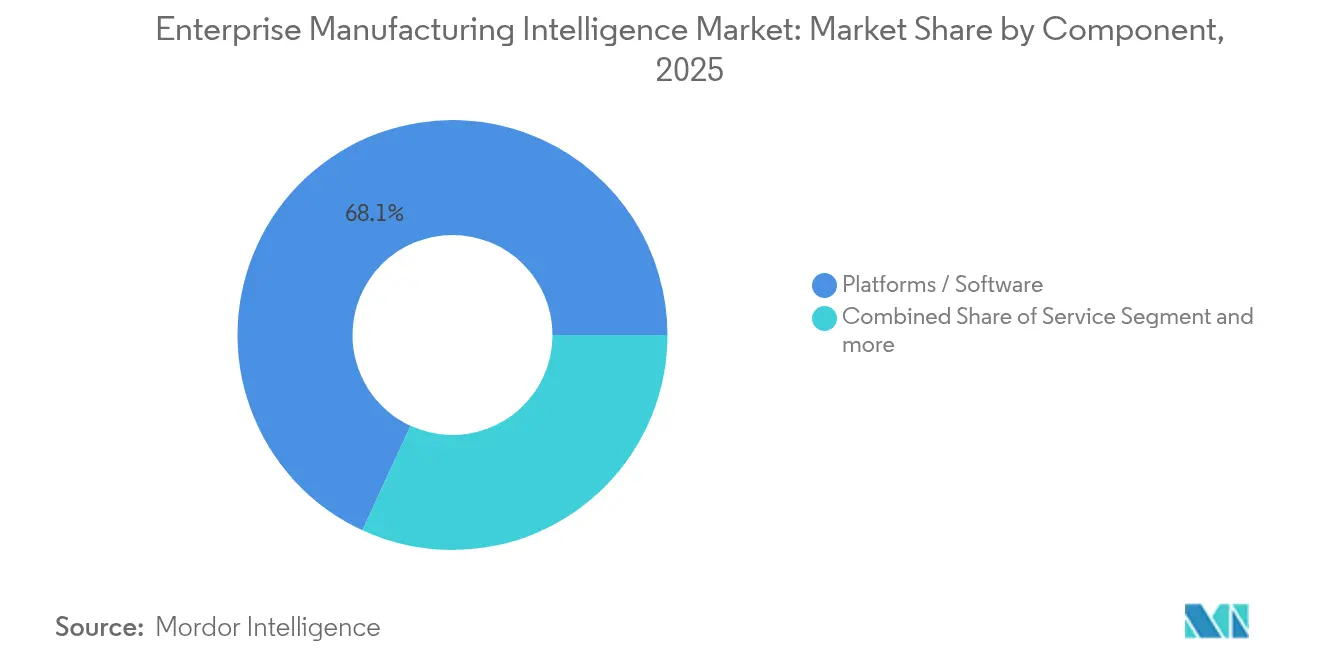
- By component, platforms/software captured 68.12% revenue share in 2025; services record the highest projected CAGR at 27.63% to 2031. North America commanded 37.71% of global revenue in 2025; Asia-Pacific is the fastest-growing region at a 26.41% CAGR through 2031.
Note: Market size and forecast figures in this report are generated using Mordor Intelligence’s proprietary estimation framework, updated with the latest available data and insights as of 2026.
Global Enterprise Manufacturing Intelligence Market Trends and Insights
Drivers Impact Analysis*
| Driver | (~) % Impact on CAGR Forecast | Geographic Relevance | Impact Timeline |
|---|---|---|---|
| Shift-left analytics enables real-time quality-by-design | 4.20% | Global, with early adoption in North America & Europe | Medium term (2-4 years) |
| Digital thread requirements in smart factories | 3.80% | APAC core, spill-over to North America | Long term (≥ 4 years) |
| Integration of industrial 5G & edge AI | 3.50% | Global, led by APAC and North America | Medium term (2-4 years) |
| Economies' green-deal subsidies linked to OEE KPIs | 2.90% | Europe primary, expanding to North America | Long term (≥ 4 years) |
| Rising use of low-code composable apps by operators | 2.10% | Global, with faster adoption in developed markets | Short term (≤ 2 years) |
| Source: Mordor Intelligence | |||
Shift-left Analytics Enables Real-time Quality-by-design
Real-time analytics embedded into production detect deviations at origin and have lowered scrap by as much as 30% at facilities such as Samsung Biologics, where computational fluid-dynamics models run inline to adjust biopharma parameters instantly. Machine-learning algorithms now forecast quality outcomes from upstream signals, closing the gap between design intent and manufacturing reality. Regulated industries gain added value because early defect detection prevents recalls and regulatory penalties. When integrated with execution platforms, AI-powered control loops keep processes within specification while maximizing throughput. These outcomes strengthen executive support for scaled deployments across multi-site networks. [2]Samsung Biologics, “Digital Bioprocessing for Real-time Quality Control,” samsungbiologics.com
Digital Thread Requirements in Smart Factories
End-to-end digital threads connect design, production, and service data, letting manufacturers trace issues back to specific process settings and material lots. Aerospace supplier Safran Aero Boosters uses PTC ThingWorx to link engineering models with shop-floor execution, enabling predictive maintenance and continuous improvement. The concept is expanding to suppliers through blockchain-backed traceability that ensures data integrity for audit readiness. Seamless connectivity also lets global plants adopt best practices in real time, accelerating product launches and shortening change-management cycles.
Integration of Industrial 5G and Edge AI
Private 5G networks eliminate latency barriers and support millisecond-level control required for autonomous mobile robots and vision inspection. Hyundai Motor and Samsung demonstrated RedCap 5G that delivers dedicated wireless capacity for mission-critical tasks in smart factories. Edge AI processes video and sensor data locally, addressing sovereignty concerns and improving resilience when cloud links falter. Combined, these technologies enable adaptive cells that self-optimize workflow orchestration without human intervention.
Economies’ Green-deal Subsidies Linked to OEE KPIs
European Clean Industrial Deal programs reward measurable efficiency, prompting factories to install intelligence platforms that track energy use and waste against real-time OEE dashboards. Subsidy eligibility hinges on continuous monitoring, accelerating platform demand among producers seeking preferential financing. Solutions that integrate sustainability metrics with production analytics now form a core requirement in supplier RFPs across automotive and food processing plants.
Restraints Impact Analysis*
| Restraint | (~) % Impact on CAGR Forecast | Geographic Relevance | Impact Timeline |
|---|---|---|---|
| Pay-back hesitation in brown-field retrofits | -2.80% | Global, particularly in mature industrial regions | Medium term (2-4 years) |
| Persistent data ownership uncertainty in multi-tier supply chains | -1.90% | Global, with higher impact in regulated industries | Long term (≥ 4 years) |
| Talent shortage in IT-OT data engineering | -1.50% | Global, acute in developed markets | Short term (≤ 2 years) |
| Source: Mordor Intelligence | |||
Pay-back Hesitation in Brown-field Retrofits
Legacy plants struggle to justify sensor retrofits and integration work that interrupt production and stretch pay-back periods. Managers favour projects with immediate savings, delaying holistic intelligence rollouts. The risk of disrupting long-lifecycle assets, alongside capex freezes in cyclical sectors, pushes many firms to pilot limited scopes rather than commit to enterprise-wide deployments.
Persistent Data Ownership Uncertainty in Multi-tier Supply Chains
Multi-stakeholder networks face conflicting expectations over who controls granular production data. OEMs demand transparency for quality assurance, while suppliers fear IP exposure. Absent clear legal frameworks for liability, parties hesitate to share data across cloud platforms, slowing adoption of cross-enterprise analytics—especially in pharmaceuticals, where strict validation rules raise additional compliance costs.
*Our forecasts treat driver/restraint impacts as directional, not additive. The impact forecasts reflect baseline growth, mix effects, and variable interactions.
Segment Analysis
By Application: Analytics and KPI Platforms Anchor Adoption
Analytics and Analysis held a 40.62% slice of 2025 revenue, confirming that insight generation underpins every deployment of the Enterprise Manufacturing Intelligence market. Workflow and KPI Management, forecast at a 27.09% CAGR, reflects the pivot from static reports to real-time, closed-loop performance control. Visualization tools and data-integration layers round out typical stacks but spend concentrates where algorithms deliver measurable throughput gains.
Enterprises now tie operator workflows to machine learning outputs that guide decision steps, creating self-adjusting lines. Honeywell’s explainable-AI modules exemplify how contextual guidance slashes downtime and training overhead. As generative interfaces mature, query-by-voice dashboards let frontline staff interrogate live plant metrics, shrinking the barrier between domain experts and shop-floor data.


By End-user Industry: Automotive Dominance, Pharma Momentum
Automotive producers accounted for 23.52% revenue in 2025 through extensive platform rollouts for body-shop robotics and final-assembly sequencing. Pharmaceuticals and biotechnology will post the fastest 25.54% CAGR as regulators mandate continuous process verification and digital twins. The Enterprise Manufacturing Intelligence market size for drug makers is forecast to expand fastest because batch genealogy and sterile conditions require granular, time-stamped datasets.
GlaxoSmithKline’s digital twin vaccines project reports tangible yield increases after virtual validation of recipe changes. Aerospace and defense firms concentrate on digital-thread traceability to meet export-control audits, while semiconductor fabs exploit inline analytics for sub-micron defect detection. Food processors also climb the adoption curve due to stringent safety protocols.
By Component: Platforms Dominate, Services Accelerate
Software platforms captured 68.12% share in 2025 as buyers prioritize configurable suites over point solutions. Yet services will outpace at 27.63% CAGR because multi-disciplinary expertise is needed to harmonize legacy devices, retrain staff, and iterate models. Siemens’ AI consulting practice addresses this gap, packaging change management with turnkey deployments. Embedded hardware evolves towards AI-on-chip gateways that run inference locally, shrinking data transfer and enabling lights-out cells in clean-room environments. Vendors co-design reference architectures to guarantee deterministic behaviour from sensor to dashboard, further lowering integration risk.
By Deployment Mode: Cloud-native Surges Past Early Security Doubts
On-premises installations represented 54.22% of the Enterprise Manufacturing Intelligence market size in 2025 because operators favoured local control over latency-sensitive assets. Cloud-native offerings, projected at a 27.68% CAGR, now integrate zero-trust architectures and region-restricted storage to alleviate sovereignty fears. Hybrid edge-cloud models provide deterministic response on-site while routing heavy analytics to the cloud.
Microsoft’s industry-specific data services grant manufacturers managed Kubernetes clusters that host real-time models adjacent to ERP data, reducing integration complexity. The resulting elasticity helps seasonal producers flex capacity without stranded hardware costs, accelerating budget approvals for cloud expansions.
Geography Analysis
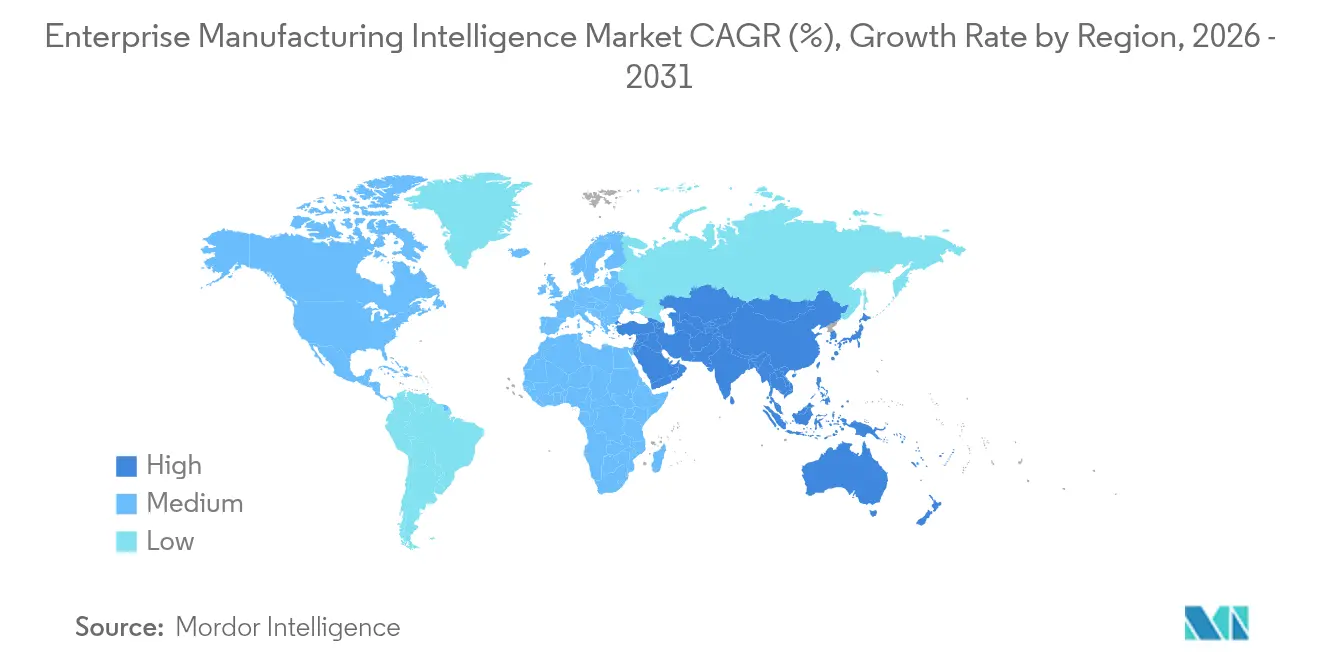
North America controlled 37.71% of 2025 global revenue as early adopters such as Procter and Gamble embedded hybrid cloud execution systems that unify more than 100 plants. Federal reshoring incentives and partnerships with hyperscalers reinforce momentum by funding lighthouse sites that showcase OEE boosts. An extensive ecosystem of system integrators supplies talent pipelines that de-risk rollouts for mid-sized manufacturers.
Asia-Pacific will post the fastest 26.41% CAGR through 2031. China, Japan, and South Korea funnel state grants into Industry 4.0 pilots, while Singapore’s nation-wide digital-factory roadmap prescribes baseline connectivity standards. Electronics and battery producers lead adoption to offset tight labour markets and meet export quality thresholds. Regional cloud providers now operate local availability zones to satisfy data-residency regulations, widening access for tier-2 suppliers. Europe leverages regulatory levers such as the Clean Industrial Deal, steering capital towards platforms that document emissions alongside OEE. German automotive clusters pilot blockchain provenance to certify recycled steel, and Italian food-processing lines deploy AI to cut energy use. Brexit-triggered supply-chain shocks elevate the need for inventory visibility from Midlands aerospace plants to mainland tier-1 suppliers, cementing Enterprise Manufacturing Intelligence adoption as a resilience strategy.

Regulatory Landscape
Cross-border Enterprise Manufacturing Intelligence deployments are increasingly shaped by horizontal cybersecurity rules and interoperability standards that influence how industrial software, edge devices, and connected products are designed, secured, and maintained. In the European Union, Regulation (EU) 2024/2847 (Cyber Resilience Act) entered into force in December 2024, setting cybersecurity requirements for products with digital elements and prompting manufacturers and automation vendors to formalize secure development, vulnerability handling, and lifecycle support as part of plant connectivity programs.
Standards activity is also tightening data-model consistency across OT and IT stacks used for manufacturing intelligence. ISO/TS 23164:2025 established a common industrial data vocabulary, while ISO 29002:2026 (characteristic data exchange) and ISO 23247-5:2026 (digital thread framework for manufacturing digital twins) add structure for interoperable analytics, digital thread traceability, and digital-twin-based process governance. Industrial cybersecurity programs commonly reference the IEC/ISA-IEC 62443 series for secure industrial automation and control systems, which raises the compliance baseline for platform vendors, system integrators, and connected equipment suppliers serving regulated or export-oriented production sites.
Value Chain Analysis
The value chain for enterprise manufacturing intelligence covers industrial data generation and connectivity on the shop floor (sensors, PLC/DCS, edge gateways, and private 5G), data integration and contextualization layers that normalize assets, events, and batch/lot records, and application-layer software (analytics, dashboards, workflow and KPI management) delivered via on-premise, hybrid, or cloud-native architectures. System integrators and OT service providers translate ISA-95-aligned plant models into deployable solutions, while hyperscalers and data platform vendors supply the scalable compute, storage, and governance foundation used for multi-site rollouts.
Recent partnerships point to where value is concentrating: tighter coupling between industrial software suites and AI/data platforms to reduce middleware and accelerate closed-loop decisioning. These include Siemens and NVIDIA collaborating on AI-accelerated industrial solutions, with the Siemens Electronics Factory in Erlangen positioned as a blueprint site (January 2026), AVEVA and AWS aligning AVEVA CONNECT with AWS for SaaS-based industrial intelligence (May 2026), and Siemens working with Databricks and FFT to stream contextualized production data to Databricks via FFT DataBridge (June 2026). Differentiation is largely centered on contextual data models, secure data-sharing, and rapid deployment toolchains, while services continue to be pivotal for brownfield integration, model tuning, and change management across operators and engineering teams.
Competitive Landscape
Industry incumbents including Siemens, ABB, and Honeywell bundle software upgrades with their automation footprints, offering seamless migration paths for existing PLC and DCS estates. Siemens’ USD 10 billion acquisition of Altair Engineering in 2025 augments the portfolio with CAE and AI-driven simulation, reinforcing its digital-thread narrative. These firms exploit lifetime service contracts to cross-sell cloud analytics modules and sustain revenue beyond hardware.
Mid-market challengers such as Sight Machine focus on rapid ROI via pre-built data models for discrete manufacturing, while Tulip’s low-code apps empower operators to digitize forms without coding. Partnerships, not zero-sum rivalry, shape go-to-market strategies: cloud hyperscalers integrate OT connectors, and MES vendors white-label analytics engines to extend reach. Co-innovation labs involving suppliers and OEMs streamline validation cycles in regulated contexts like pharma.
Start-ups secure funding by specializing in niche pain points such as serialization compliance or AI vision kits. Venture arms of OEMs scout these innovators to plug feature gaps; Mitsubishi Electric’s stake in Formic Technologies exemplifies such moves to deliver robot-as-a-service for SMEs. Despite deal activity, no single vendor controls a dominant share, preserving customer leverage in procurement negotiations. [4]Siemens AG, “Siemens to Acquire Altair Engineering to Strengthen Simulation and AI Portfolio,” press.siemens.com
Enterprise Manufacturing Intelligence Industry Leaders
Siemens AG
Rockwell Automation Inc.
Honeywell International Inc.
Emerson Electric Co.
AVEVA Group plc
- *Disclaimer: Major Players sorted in no particular order

Market Opportunities and Future Outlook
A key whitespace remains between widespread MES presence and true enterprise integration across plants, suppliers, and enterprise systems. Rockwell Automation survey findings published in July 2026 highlighted this gap, reporting that 93% of manufacturers have MES, but only 23% have fully integrated IT across operations. That leaves room for enterprise manufacturing intelligence layers that unify OT telemetry with ERP, quality, and maintenance workflows, especially in multi-site expansions.
Interoperability and trusted data exchange also represent a practical opportunity as manufacturers move toward digital threads and digital twins across the product lifecycle. Standards and public roadmaps such as IEC 63339:2024 (smart manufacturing reference model) and NISTs 2026 roadmap on AI and machine learning in smart manufacturing provide structure for lifecycle interoperability, model governance, and OT-IT alignment. ISO 23247-5:2026 and ISO 29002:2026 further codify digital-twin digital thread concepts and characteristic data exchange, which helps vendors position platforms around lifecycle traceability, edge inference, secure industrial networking, and validated change control to address regulated and multi-tier supply chain use cases where data ownership and auditability constraints have slowed cross-enterprise analytics deployments.
Recent Industry Developments
- July 2026: Schneider Electric announced an agreement to acquire Cognite Holding B.V. for USD 3.1 billion in cash, with plans to integrate Cognites industrial data contextualization capabilities with AVEVA. The acquisition strengthens Schneider Electric's industrial AI stack for enterprise-scale analytics, generative AI use cases, and autonomous operational workflows across connected plants.
- April 2026: Emerson consolidated Aspen Technology into its Control Systems and Software segment to sharpen focus on software-led, AI-enabled industrial automation. The integration supports tighter coupling between process control, industrial data infrastructure, and advanced analytics used in enterprise manufacturing intelligence deployments.
- December 2024: Regulation (EU) 2024/2847, the EU Cyber Resilience Act, entered into force, establishing cybersecurity requirements for products with digital elements. This regulatory step raises secure-by-design, vulnerability management, and lifecycle support expectations for connected industrial software and edge components used in manufacturing intelligence architectures.


Research Methodology Framework and Report Scope
Market Definition and Coverage
For this study, the enterprise manufacturing intelligence market is defined as the revenue earned from software and related services that convert plant and enterprise production data into usable performance insights for manufacturers.
Scope exclusions: It excludes general enterprise IT analytics that is not used for manufacturing operations decisions, and it also excludes pure hardware-only sensing and connectivity revenue.
Segmentation Overview
- By Application
- Data Integration
- Analytics & Analysis
- Visualization / Dashboards
- Workflow & KPI management
- By End-user Industry
- Automotive
- Aerospace & Defense
- Electronics & Semiconductors
- Food & Beverage
- Chemicals & Materials
- Pharmaceuticals & Biotech
- By Deployment Mode
- On-premise
- Hybrid (Edge + Cloud)
- Cloud-native
- By Component
- Platforms / Software
- Services
- Embedded Analytics Hardware
- By Geography
- North America
- United States
- Canada
- Mexico
- South America
- Brazil
- Argentina
- Europe
- Italy
- France
- United Kingdom
- Germany
- Asia-Pacific
- China
- India
- Japan
- South Korea
- Middle East
- United Arab Emirates
- Saudi Arabia
- Turkey
- Africa
- Nigeria
- South Africa
- Kenya
- North America
Data Sources, Market Sizing, and Validation
Desk Research
Desk research is used to set the starting structure of the market and to anchor the model to measurable manufacturing activity. We refer to public sources such as the US Census Bureau and Bureau of Labor Statistics, Eurostat, UN Comtrade trade series, and industrial production indicators published by the OECD. For manufacturing digitization context, we also review guidance and data points from sources such as NIST publications, standards bodies, and peer reviewed journals that track factory analytics and OT-IT integration topics.
To convert these inputs into a usable sizing view, we map where manufacturing intelligence software is typically purchased and how it is deployed across plants and enterprise teams. Company annual reports, investor decks, product documentation, and credible press interviews are reviewed to understand typical offering mix, delivery model changes, and regional go to market patterns. Where needed, approved paid subscriptions are used for company financials and intelligence, news and financials, and patent databases to validate timelines and identify overlaps with adjacent software categories. The sources listed here are illustrative only, and many other public references were used to collect, cross check, and clarify data.
Primary Interviews and Surveys
Primary work is used to pressure test the boundaries of what buyers call manufacturing intelligence versus nearby MES, MOM, and general analytics tools, and to confirm what gets budgeted as an enterprise purchase. We interview a mix of manufacturers, system integrators, and software practitioners across APAC, EMEA, and the Americas so adoption drivers, deployment constraints, and pricing direction can be checked across different plant maturity levels. Feedback is then used to adjust assumptions around attach rates to installed systems, average contract value ranges, and services intensity by use case.
Distribution of primary research fieldwork respondents
| Company type | Respondent position | Region |
|---|---|---|
| Top tier: 34% | CXOs: 12% | APAC: 44% |
| Mid tier: 52% | Functional/Unit leaders: 34% | EMEA: 29% |
| Smaller Players: 14% | Managers: 54% | Americas: 27% |
Market-Sizing & Forecasting
Sizing starts from a top-down demand pool, where manufacturing output and plant activity indicators are reconstructed by region and then filtered through an estimated share of sites and lines that use enterprise level intelligence applications. From there, the model is translated into spend using practical inputs such as the number of multi site manufacturers, the rate of OT-IT data integration projects, typical software subscription and maintenance levels, and the share of deployments that include analytics services. To keep totals realistic, the outputs are corroborated with selective bottom-up approximations using sampled pricing ranges and volume proxies (for example, estimated deployed seats or sites), then adjusted when the two views disagree.
For forecasting, scenario analysis is used because investment behavior shifts with factory utilization and capex cycles, and the scenarios are cross checked against expert expectations gathered in interviews. Key forward-looking drivers include smart factory program rollouts, cloud migration pace for operational apps, cybersecurity spending priorities that can slow or accelerate deployment, and the speed at which data historians and MES systems are connected into enterprise reporting. Where bottom-up checks have gaps, they are filled using transparent assumptions tied to observable indicators, followed by sensitivity checks so the final forecast does not depend on one unknown variable.
Data Validation & Update Cycle
Before sign off, the numbers are checked from multiple angles, including reconciling growth rates with manufacturing production trends and reviewing whether implied spend per site stays within realistic budgeting patterns. Outliers are flagged when regional splits, year over year jumps, or implied pricing drifts look inconsistent with what practitioners report, then the assumptions are revisited and corrected. A separate analyst review is completed to confirm that definitions, conversions, and steps are traceable.
Reports are refreshed annually, and interim updates are triggered when a material event changes adoption or pricing assumptions, such as major regulation, a clear shift in cloud deployment patterns, or a step change in manufacturing investment sentiment. Before delivery, a final pass is done so clients receive the most current view available at that time.
Mordor Intelligence's Enterprise Manufacturing Intelligence Market Size Versus Other Published Estimates
Published values for enterprise manufacturing intelligence often differ because the scope line between intelligence software, adjacent MOM layers, and broader analytics is drawn differently, and pricing is treated in different ways. Year labeling also adds spread, since some sources show a base year value while others lead with the first forecast year.
The table shows a tight cluster around the 2025 value, but a wider spread in implied growth, and in Mordor Intelligence's model the count focuses on enterprise manufacturing intelligence software value and related services tied to manufacturing performance use cases, instead of bundling wider manufacturing execution or generic enterprise BI spend.
Benchmark comparison
| Source | Market Size | Gaps in Research Methodology |
|---|---|---|
| Mordor Intelligence | USD 4.10 B (2025) | |
| Industry Research Publisher A | USD 4.20 B (2025) | This estimate tends to include a broader application bucket that blends manufacturing intelligence with plant management software layers, which can raise the total even when the year matches. |
| Global Consultancy B | USD 3.86 B (2025) | This figure uses a narrower demand pool and conservative adoption assumptions, and it often treats services as limited to initial deployment rather than recurring analytics and optimization support. |
Taken together, the differences mostly come from what is counted as manufacturing intelligence versus adjacent operational software, plus how recurring services are handled. By keeping each input tied to observable manufacturing activity and interview validated adoption and pricing ranges, the final number stays explainable and repeatable.


Key Questions Answered in the Report
What is the current value of the Enterprise Manufacturing Intelligence market?
The market stands at USD 5.03 billion in 2026 and is forecast to reach USD 13.92 billion by 2031, reflecting a 22.6% CAGR.
Which region holds the largest Enterprise Manufacturing Intelligence market share today?
North America leads with 37.71% of global revenue in 2025 due to early AI-driven smart-factory investments.
Which application segment is growing the fastest?
Workflow and KPI Management applications are projected to expand at a 27.09% CAGR between 2026 and 2031.
Why are pharmaceuticals adopting Enterprise Manufacturing Intelligence platforms rapidly?
Strict regulatory demands for real-time batch tracking and digital twins push pharmaceutical companies toward 25.54% CAGR adoption.
How are private 5G networks influencing manufacturing intelligence deployments?
Dedicated 5G reduces latency to millisecond levels, enabling edge AI for autonomous robots and real-time quality inspection on the shop floor.
What limits Enterprise Manufacturing Intelligence uptake in legacy plants?
Brown-field retrofit projects often face extended pay-back periods, making executives cautious about full-scale platform installation.
Page last updated on:






