
Enterprise Governance, Risk And Compliance Market Size and Share
Market Overview
| Study Period | 2020 - 2031 |
|---|---|
| Market Size (2026) | USD 23.62 Billion |
| Market Size (2031) | USD 42.19 Billion |
| Growth Rate (2026 - 2031) | 12.30 % |
| Fastest Growing Market | Asia Pacific |
| Largest Market | North America |
| Market Concentration | Medium |
Major Players *Disclaimer: Major Players sorted in no particular order Image © Mordor Intelligence. Reuse requires attribution under CC BY 4.0. | |
Enterprise Governance, Risk And Compliance Market Analysis by Mordor Intelligence
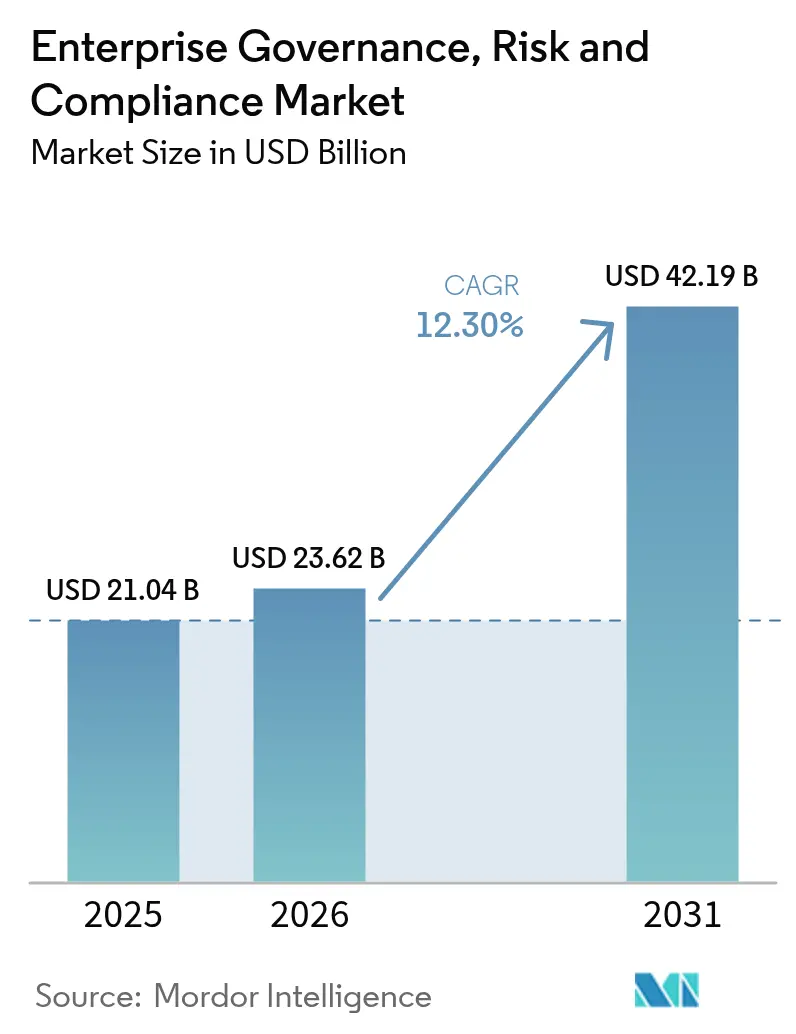
The enterprise governance risk compliance market size is expected to grow from USD 21.04 billion in 2025 to USD 23.62 billion in 2026 and is forecast to reach USD 42.19 billion by 2031 at 12.3% CAGR over 2026-2031. Demand accelerates as organizations confront a surge in regulatory obligations, most notably the Digital Operational Resilience Act (DORA), while adopting AI to automate controls, interpret fast-changing rules, and flag anomalies in real time. Platform uptake intensifies because integrated suites consolidate previously siloed audit, policy, and cybersecurity workflows into a single source of truth, producing measurable cost savings and faster issue resolution. Early adopters report efficiency gains of up to 42% in false-positive reduction after embedding AI-driven compliance analytics alongside security telemetry. Momentum is further reinforced by insurers that now price coverage using real-time GRC metrics, translating strong governance performance into premium discounts and competitive advantage.
Key Report Takeaways
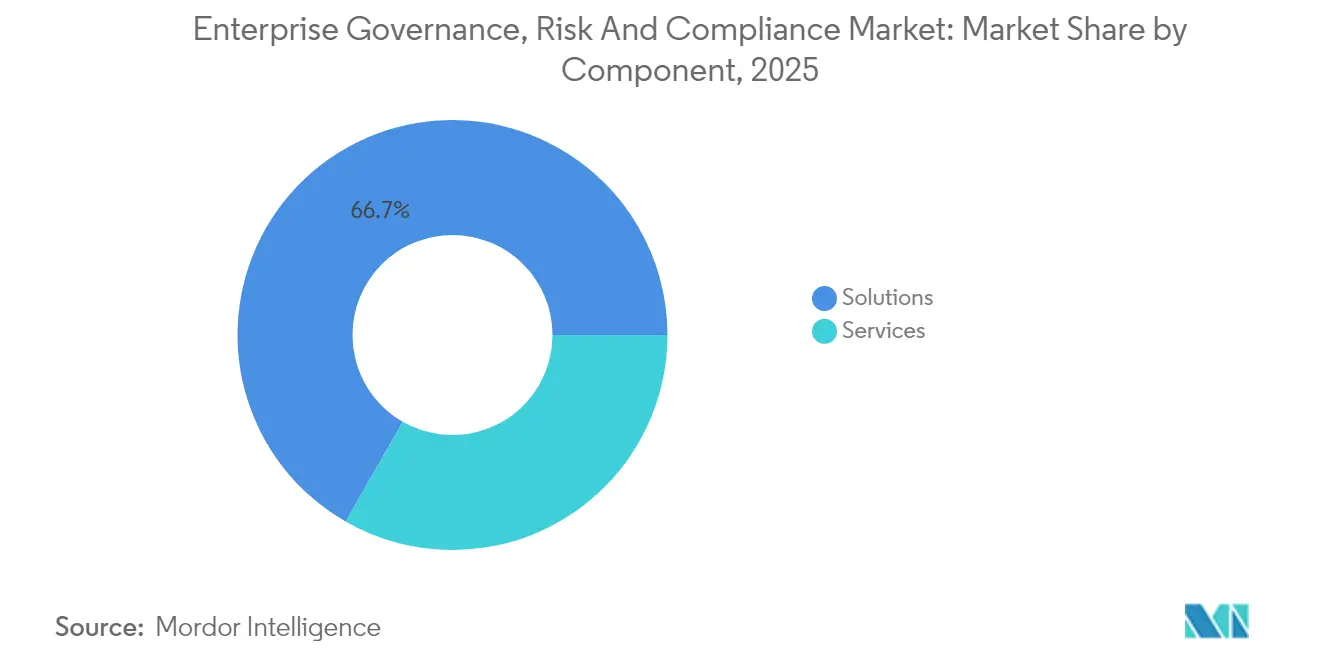
- By component, Solutions held 66.72% of enterprise governance risk compliance market share in 2025, whereas Services are forecast to post the fastest 12.6% CAGR through 2031.
- By deployment model, on-premise installations accounted for 53.40% revenue in 2025, but cloud platforms are projected to grow at 13.3% CAGR to 2031.
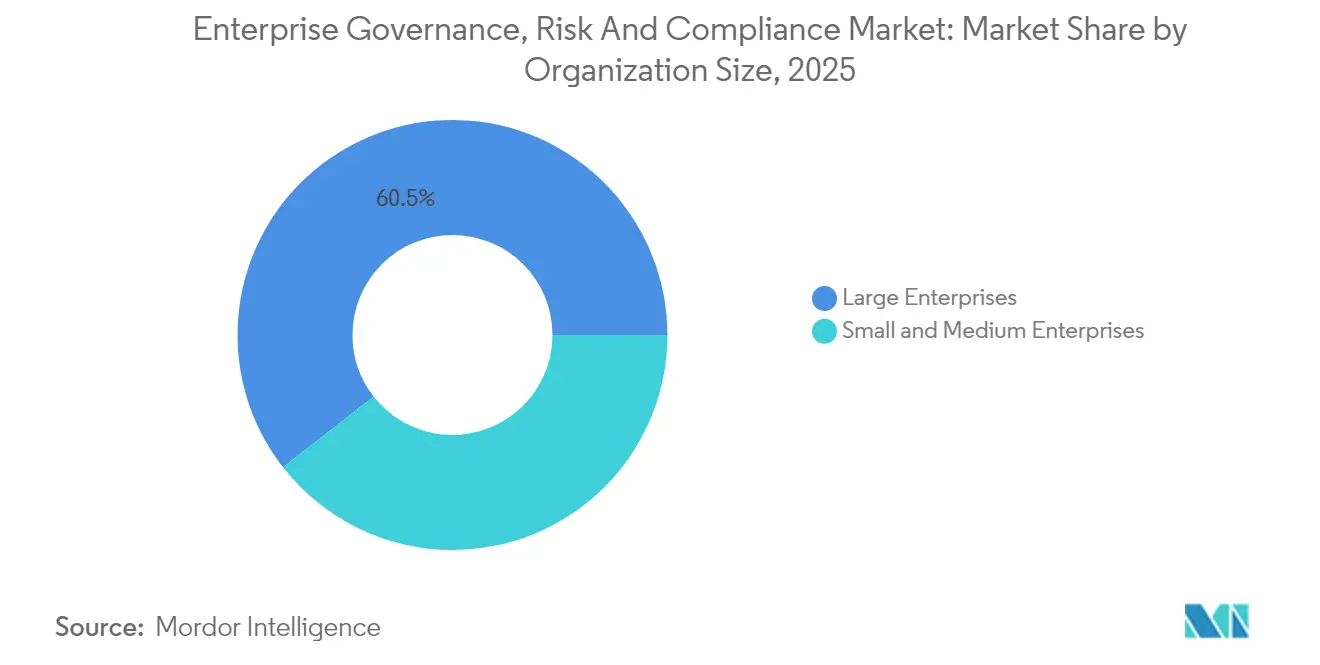
- By organisation size, Large Enterprises captured 60.55% of 2025 revenue, yet SMEs will expand at a 14.1% CAGR on the back of cloud-based offerings.
- By end-user industry, Healthcare and Life Sciences commanded 34.25% revenue in 2025; BFSI is expected to lead growth at 12.7% CAGR through 2031.
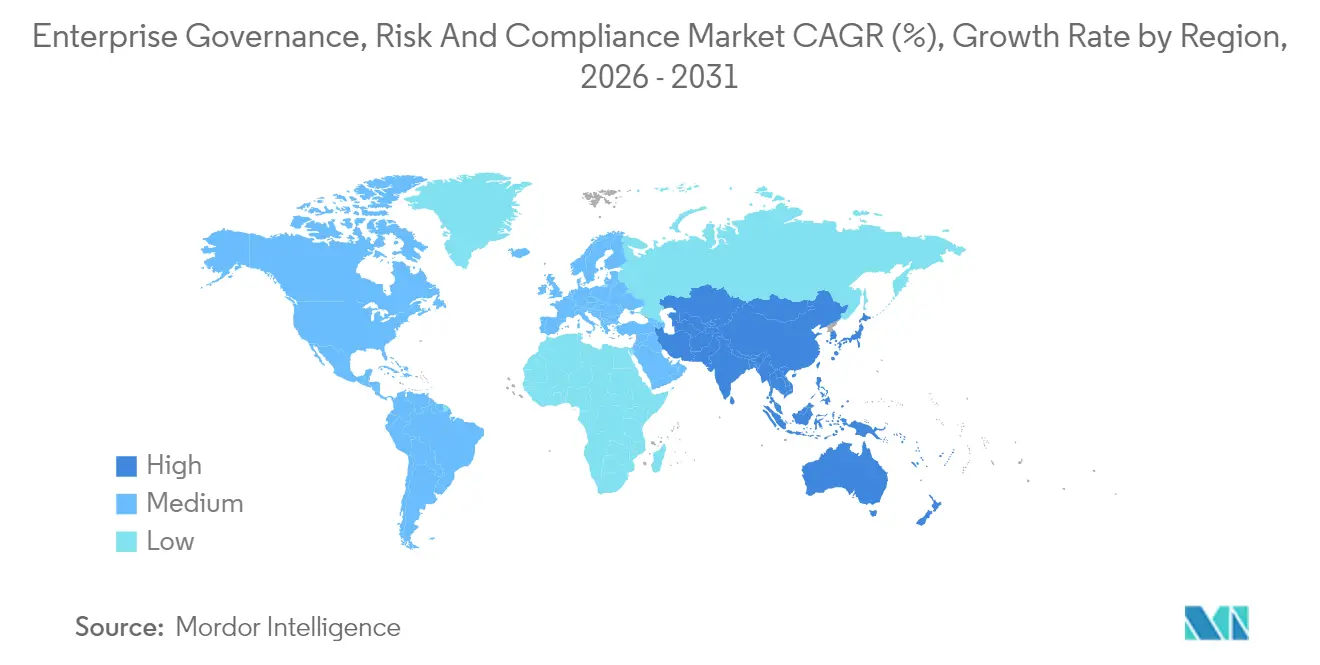
- By geography, North America led with 34.80% share in 2025, while Asia-Pacific is anticipated to register the highest 12.9% CAGR to 2031.
Note: Market size and forecast figures in this report are generated using Mordor Intelligence’s proprietary estimation framework, updated with the latest available data and insights as of 2026.
Market Trends and Insights
Drivers Impact Analysis of Enterprise Governance, Risk And Compliance Market*
| Driver | (~) % Impact on CAGR Forecast | Geographic Relevance | Impact Timeline |
|---|---|---|---|
| Stringent government regulations and mandates | +2.8% | Global with focus in EU and North America | Medium term (2-4 years) |
| Rising cybersecurity threats with digital transformation | +2.1% | Global, pronounced in APAC and North America | Short term (≤ 2 years) |
| Move toward integrated risk-management platforms | +1.9% | North America and EU leading | Medium term (2-4 years) |
| ESG reporting pressure and non-financial disclosure rules | +1.7% | EU primary driver | Long term (≥ 4 years) |
| AI-powered predictive compliance analytics adoption | +2.3% | North America and EU early adopters | Short term (≤ 2 years) |
| Insurance underwriting dependencies on real-time GRC metrics | +1.5% | Global, mature insurance markets | Medium term (2-4 years) |
| Source: Mordor Intelligence | |||
Stringent government regulations and mandates drive platform consolidation
Heightened rulemaking continues to swell the enterprise governance risk compliance market as DORA, effective January 2025, obliges EU financial entities to embed ICT risk frameworks covering incident response, resilience testing, and third-party oversight.[1] Firms now monitor more than 250 regulatory changes each day, a pace that outstrips manual processes. Machine-learning models parse new statutes, rank their relevance, and route tasks to accountable owners within minutes, enabling compliance teams to redeploy effort toward strategic risk analysis. Vendors offering multijurisdictional mapping and automated update engines have therefore moved to the top of enterprise shortlists. Failure to comply risks both material penalties and reputational damage, whereas early movers secure investor confidence by demonstrating operational resilience.
Rising cybersecurity threats accelerate GRC technology integration
Cyber incidents spiked 75% in 2024, pushing CISOs to embed security posture metrics into core governance dashboards instead of handling them in isolation. A single console that overlays policy checks onto threat telemetry cuts duplication and shrinks time to remediate vulnerabilities across hybrid environments. Healthcare providers adopting AI-enabled GRC suites recorded 37% stronger risk detection rates and 42% fewer false positives, illustrating the value of unifying compliance and security data. Because 70% of organizations label current cloud-risk assignment processes ineffective, appetite for centralised, cloud-agnostic controls has intensified.[2] Suppliers that deliver actionable dashboards—rather than raw alerts—win traction by easing user fatigue and freeing specialists to focus on high-impact threats.
AI-powered predictive compliance analytics transform risk management
Two-thirds of enterprises intend to fund AI initiatives for risk oversight, yet only 14% have completed integration, signalling broad runway for the enterprise governance risk compliance market. Generative AI engines now interpret draft laws with 95% accuracy and push automatic policy updates, turning compliance from reactive box-ticking into forward-looking advisory. Bespoke small language models let firms retain data residency while reducing compute costs, an attractive proposition for regulated industries. Early adopters have shortened audit cycles, eliminated redundant controls, and produced predictive heat maps that guide board spending on mitigation. Consequently, AI capability is becoming a baseline buyer requirement rather than a premium feature.
ESG reporting pressure creates new compliance categories
European regulations converted ESG disclosures from voluntary to mandatory, compelling firms to track carbon footprints, social-impact metrics, and governance practices alongside financial statements. Integrated platforms now ingest energy data, supplier ethics scores, and diversity statistics, generating investor-ready dashboards that align with frameworks such as CSRD. AI-powered ESG auditors scrape unstructured sources—utility bills, sensor feeds, supplier attestations—and auto-populate reports, cutting manual effort while raising accuracy. Vendors that link ESG scores to risk appetite statements extend their value proposition, positioning the enterprise governance risk compliance market as a central hub for sustainability intelligence.
Restraints Impact Analysis of Enterprise Governance, Risk And Compliance Market*
| Restraint | (~) % Impact on CAGR Forecast | Geographic Relevance | Impact Timeline |
|---|---|---|---|
| Lack of skilled GRC professionals | -1.8% | Global, acute in Asia-Pacific | Long term (≥ 4 years) |
| High initial integration cost for legacy environments | -2.1% | North America and EU | Medium term (2-4 years) |
| Data-residency and sovereignty complexity in multi-cloud | -1.3% | Worldwide | Short term (≤ 2 years) |
| Organisational GRC-fatigue and alert overload | -1.6% | Mature markets | Medium term (2-4 years) |
| Source: Mordor Intelligence | |||
High initial integration costs challenge legacy system modernization
Annual subscriptions for leading suites range from USD 50,000 to USD 500,000, while implementation often costs two to six times the license fees, straining budgets for firms running ageing ERP backbones.[3] SaaS inflation running at 11.3% further heightens price sensitivity as vendors impose 25% hikes despite flat headcount. Integrating modern GRC tools with bespoke finance, HR, and manufacturing systems often demands custom APIs and change-management programmes that extend timelines. Outcome-based licensing and low-code connectors are gaining popularity by shifting capital expenditure to operating expense and demonstrating payback through quantifiable risk-reduction metrics.
Organizational GRC-fatigue impedes platform adoption
Users inundated by non-stop alerts disengage, diminishing system value. In 2024, 60% of firms cited overwhelmed staff as the top barrier to realizing full benefits from their platforms. Over-automation without context delivers data dumps rather than insights, compelling buyers to demand AI filters that rank issues by criticality and present tailored dashboards for each role. Suppliers answering this pain point improve stickiness and reduce churn, positioning themselves strongly as enterprises rationalize overlapping systems.
*Our forecasts treat driver/restraint impacts as directional, not additive. The impact forecasts reflect baseline growth, mix effects, and variable interactions.
Enterprise Governance, Risk And Compliance Market Segment Analysis
By Component:
Solutions Dominance Drives Service InnovationSolutions generated 66.72% of 2025 revenue, underscoring buyer preference for end-to-end suites that blend policy libraries, audit trails, risk scoring, and incident response into one stack. This dominance reflects how enterprises value single-vendor accountability and consistent user experience across all functions of the enterprise governance risk compliance market. Consulting, integration, and managed services, though smaller in absolute value, are set to grow 12.6% through 2031 as buyers turn to external experts for regulatory interpretation and complex system rollouts. Risk Management and Audit Management modules experience the fastest take-up because they replace spreadsheet workflows and provide real-time analytics that executives can track on mobile apps. Demand for Business Continuity features surged after supply-chain shocks averaged USD 184 million in losses, prompting firms to link continuity plans directly to supplier scorecards.

By Deployment Model:
Cloud Migration Accelerates Despite Security ConcernsOn-premise installations retained 53.40% of 2025 revenue because banks and hospitals must store sensitive records locally, but cloud subscriptions will expand 13.3% annually through 2031 as CIOs favor elastic compute for AI workloads. Cloud platforms automate upgrades, shorten implementation cycles, and empower remote teams, making them attractive to SMEs and multinationals alike. Regulatory scrutiny on third-party resilience through DORA pushes firms to demand continuous oversight of external cloud providers-a capability that cloud-native GRC suites embed by design. Hybrid models, which keep critical data on-site while shifting analytics to the cloud, enable risk-averse firms to test the waters without breaching residency rules.
Providers mitigate perceived security gaps by offering customer-managed encryption keys and sovereign-cloud regions certified for local compliance regimes. They also streamline deployment through infrastructure-as-code templates that stand up full environments in hours rather than weeks. As AI algorithms require large training sets and scalable GPUs, cloud deployments become the default choice for predictive compliance analytics-cementing their role in the future landscape of the enterprise governance risk compliance market.
By Organisation Size:
SME Adoption Accelerates Through SaaS ModelsLarge Enterprises contributed 60.55% of 2025 sales, driven by multi-jurisdictional operations that necessitate sophisticated workflow orchestration and advanced analytics. These organizations integrate platforms with ERP and IT-service-management systems to gain cross-functional transparency and automated evidence collection. However, SMEs will outpace them with a 14.1% CAGR because subscription-based offerings strip away hefty capital outlays and deliver pre-configured controls tailored to sector needs. Vendors promote rapid, low-touch deployments that go live in weeks, meeting smaller teams' resource constraints while satisfying auditors' demands.
SaaS inflation does present budgetary pressure, but SMEs balance higher fees against the risk of non-compliance penalties, reputational damage, and lost tenders. Outcome-based pricing-charging only when audit checkpoints pass or incidents close within SLA-encourages adoption by tying cost to value delivered. The playbook resonates in emerging markets where regulators ramp oversight yet local talent pools remain thin, propelling the enterprise governance risk compliance market into new customer segments.
By End-User Industry:
Healthcare Leadership Reflects Regulatory IntensityHealthcare and Life Sciences accounted for 34.25% of 2025 revenue on the back of strict patient-safety norms, HIPAA, and FDA guidelines. AI-enabled platforms that automatically scan electronic medical records flag privacy violations and ensure audit readiness, reducing manual review workload by thousands of hours. Manufacturing and Energy firms increasingly connect shop-floor IoT devices to GRC hubs, monitoring safety compliance in real time and linking findings to maintenance tickets. BFSI lines up as the fastest-growing vertical at 12.7% CAGR because soaring financial crime costs-USD 61 billion annually in North America-make automated surveillance indispensable.
Retailers invest to manage supply-chain transparency mandates, while government agencies deploy platforms to boost accountability and citizen trust. Cross-industry, ESG reporting mandates ensure every sector now needs structured data collection and auditable trails, expanding addressable demand for the enterprise governance risk compliance market.
Geography Analysis
North America Enterprise Governance, Risk and Compliance Market
North America generated 34.80% of global revenue in 2025, supported by mature regulatory ecosystems and robust technology budgets. Financial institutions spend USD 61 billion annually on compliance, and 99% expect costs to rise, reinforcing demand for automated solutions that lower expense ratios. Federal guidelines reward self-reporting and resilient operations, so firms treat GRC investment as a competitive edge. Partnerships such as ServiceNow-Visa illustrate how technology vendors co-create AI workflows that enhance dispute management while ensuring regulatory adherence.
APAC Enterprise Governance, Risk and Compliance Market
Asia-Pacific is projected to log a 12.9% CAGR, the highest globally. Governments in Singapore, Australia, and India introduce corporate liability rules mirroring the UK Bribery Act, compelling companies to invest in modern compliance architecture. APAC banks also confront USD 45 billion in financial-crime compliance costs, with 70% citing higher software spend in 2024, driving cloud-native uptake that aligns with rapid digitalization.
Regulatory Landscape
Enterprise GRC demand is being shaped by tighter, more prescriptive cyber, resilience, and privacy requirements across major economies, raising expectations for auditable controls, continuous monitoring, and third-party oversight. In the European Union, the Digital Operational Resilience Act (DORA) obligations that took effect in January 2025 have accelerated programmatic control mapping for ICT risk management, incident response, resilience testing, and vendor governance in financial services, and that operational-resilience posture is starting to influence cross-industry expectations for evidence collection and reporting.
In 2025, the United States reinforced standard-driven cybersecurity governance through NIST activity, including the August 2025 release of NIST SP 800-53 Release 5.2.0, which emphasized software update and patch reliability, and policy actions under Executive Order 14144 (June 2025) directing federal cybersecurity improvements. In June 2026, the United Kingdom issued a draft revised Telecommunications Security Code of Practice to support the Telecommunications (Security) Act and related security measures regulations, signaling more granular technical guidance that enterprises and suppliers can operationalize inside GRC workflows. At the same time, the European Commission advanced a 2026 Digital Networks Act proposal, pointing to continued policy work to harmonize digital connectivity-related rules that can cascade into enterprise risk and compliance requirements for telecom, cloud, and edge ecosystems.
Competitive Landscape
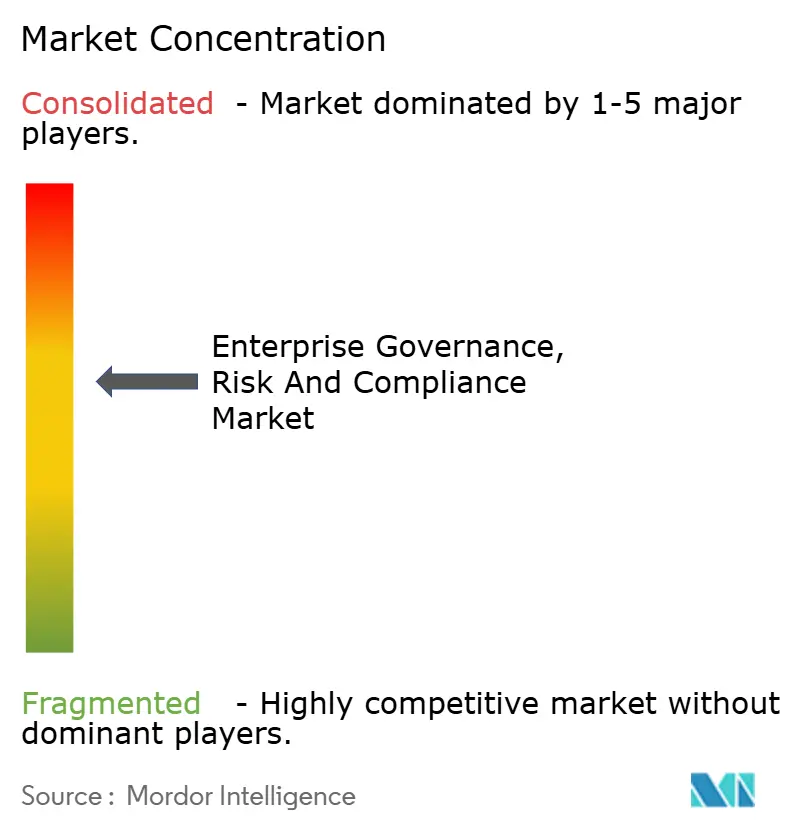
The enterprise governance risk compliance market shows moderate concentration. Technology majors—IBM, SAP, ServiceNow, and Oracle—hold significant share through broad portfolios and deep integration capabilities. IBM’s pending HashiCorp acquisition strengthens hybrid-cloud automation and positions its platform suite to orchestrate multi-cloud compliance. ServiceNow scales AI reach via partnerships with NVIDIA and Google Cloud, embedding generative agents that draft control remediations and summarize audit evidence.
Mid-tier specialists pursue vertical depth. Mitratech’s purchases of Prevalent and Preparis augment third-party risk and business continuity modules. Kroll’s takeover of Resolver fuses risk intelligence with cyber forensics, producing end-to-end visibility for incident teams. Disruptors like Scytale and Drata differentiate on outcome-based pricing, SOC 2 automation, and curated policy libraries for SMEs.
Innovation focuses on AI-guided control testing, low-code policy engines, and UX that filters noise through intelligent prioritization. Patent filings, such as ServiceNow’s automated vulnerability-remediation method, underscore the race to reduce manual toil. As vendors converge on core features, ecosystem strength—integrations, content partnerships, and developer communities—becomes the deciding factor for buyers evaluating long-term platform fit within the enterprise governance risk compliance market.
Enterprise Governance, Risk And Compliance Industry Leaders
-
Dell Technologies (incl. RSA Security)
-
SAP SE / GRC Suite
-
Oracle Corporation
-
MetricStream Inc.
-
IBM Corporation
- *Disclaimer: Major Players sorted in no particular order
Enterprise Governance, Risk And Compliance Market Companies Covered in this Report
- Dell Technologies (incl. RSA Security)
- IBM Corporation
- SAP SE / GRC Suite
- Oracle Corporation
- MetricStream Inc.
- Wolters Kluwer / Enablon
- SAS Institute Inc.
- Software AG
- NAVEX Global
- Thomson Reuters Corp.
- ServiceNow Inc.
- Riskonnect Inc.
- LogicManager Inc.
- OneTrust LLC
- Galvanize (Diligent)
- Ideagen Plc
- SAI Global
- AxiomSL (Adenza)
- Cura Software
- BWise (SandP Global)
- FutureShield Inc.
- Maclear LLC
- RSA Archer Suite
Read Analysis of Enterprise Governance, Risk And Compliance Companies
Market Opportunities and Future Outlook
One of the clearest whitespace areas for enterprise GRC platforms is the overlap between software supply chain trust, machine identity security, and AI governance, where compliance teams need continuous assurance rather than periodic assessments. Enterprise programs to harden open source and software delivery pipelines are creating demand for GRC capabilities that translate engineering evidence (SBOMs, patch and dependency status, secure configuration baselines, and exception workflows) into board-ready risk reporting. For example, IBM and Red Hat announced a USD 5 billion commitment (May 2026) to secure open source software using large-scale engineering capacity and AI-driven validation, which aligns with demand for policy-as-code, automated control testing, and unified evidence models that connect security telemetry with audit and compliance outcomes.
A second opportunity area is cryptographic and identity governance for AI-era environments, where inventories, ownership, rotation, and incident response for certificates and machine identities become compliance-critical across hybrid and multi-cloud estates. Keyfactor disclosed a USD 1 billion-plus strategic growth investment led by Summit Partners (July 2026) to expand machine identity security for AI and post-quantum environments, reinforcing enterprise spend shifting toward automated trust infrastructure. With data residency constraints and third-party resilience scrutiny also in play, buyers are looking for integrated platforms that support multi-jurisdictional mapping (including DORA-aligned controls), automate workflows to reduce alert overload, and enable deployment patterns that keep sensitive evidence local while still supporting AI-assisted analytics at scale.
Recent Industry Developments in Enterprise Governance, Risk And Compliance Market
- May 2026: MetricStream released the Euphrates-II Update 7 for its AI-first Connected GRC platform, adding capabilities such as OAuth 2.0 support for Microsoft Outlook Calendar integration and enhancements to MetricStream Assistant and Policy Assistant. The update underscores vendor focus on embedding AI into day-to-day governance workflows and improving usability for evidence capture and task orchestration across audit and compliance teams.
- June 2025: ServiceNow and NVIDIA unveiled the Apriel Nemotron 15B model to power real-time workflow agents. This strengthened the push toward agentic automation in GRC-adjacent workflows by accelerating how enterprises route, summarize, and remediate compliance tasks across integrated platforms.
- April 2024: Kroll completed its acquisition of Resolver. By combining risk intelligence and incident response capabilities with cyber and investigations expertise, the deal supported more end-to-end risk visibility for enterprises managing governance, compliance, and operational response in a single program.
Enterprise Governance, Risk And Compliance Market Report Scope and Research Methodology
Market Definition and Coverage
This market covers the revenue earned from enterprise governance, risk, and compliance solutions that help organizations set policies, manage controls, run audits, track risks, and meet regulatory obligations, along with related implementation and support services.
Scope exclusions: We exclude general IT security tools that are not used for governance or compliance workflows, and we also exclude pure legal case management and standalone accounting software.
Segments Covered in This Report
- By Component
- Solutions
- Policy and Compliance Management
- Audit Management
- Risk Management
- Incident Management
- Business Continuity and Disaster Recovery
- Services
- Consulting
- Integration and Implementation
- Training and Support
- Solutions
- By Deployment Model
- On-premises
- Cloud
- By Organisation Size
- Small and Medium Enterprises
- Large Enterprises
- By End-user Industry
- BFSI
- Healthcare and Life Sciences
- Manufacturing
- IT and Telecom
- Energy and Utilities
- Retail and Consumer Goods
- Government and Public Sector
- By Geography
- North America
- United States
- Canada
- Mexico
- South America
- Brazil
- Argentina
- Rest of South America
- Europe
- Germany
- United Kingdom
- France
- Russia
- Rest of Europe
- Asia-Pacific
- China
- Japan
- India
- Australia
- South Korea
- Rest of Asia-Pacific
- Middle East
- Saudi Arabia
- United Arab Emirates
- Turkey
- Rest of Middle East
- Africa
- South Africa
- Nigeria
- Rest of Africa
- North America
Data Sources, Market Sizing, and Validation
Desk Research
Desk research starts with a clear view of what gets counted as eGRC revenue and what does not, because adjacent software categories can inflate totals. For this, we rely on public and official references such as SEC filings and annual reports, NIST guidance, the US FTC and EU Commission updates on privacy and digital rules, and standards bodies and audit-related publications such as ISO and PCAOB materials.
Next, the model inputs are built using data points that are visible in the open domain, such as enterprise IT spending indicators, cloud adoption signals, and sector level compliance pressure (for example, financial services and healthcare). We also use general secondary sources such as investor presentations, earnings call transcripts, association sites, and reputable press coverage. We limit paid subscriptions to company financials and news for triangulation, and to patent databases to understand product focus areas. These desk sources are not exhaustive, and additional public references were used to fill gaps and cross-check assumptions.
Primary Interviews and Surveys
Primary work is used to pressure test what we saw in desk research, especially around how buyers bundle software with services and how cloud pricing and renewals are being structured. We speak with a mix of solution providers, system integrators, compliance leaders, risk owners, and internal audit teams across APAC, EMEA, and the Americas, so the model reflects differences in regulatory intensity and adoption maturity.
Distribution of primary research fieldwork respondents
| Company type | Respondent position | Region |
|---|---|---|
| Top tier: 31% | CXOs: 13% | APAC: 43% |
| Mid tier: 49% | Functional/Unit leaders: 28% | EMEA: 36% |
| Smaller Players: 20% | Managers: 59% | Americas: 21% |
Market-Sizing & Forecasting
Sizing is built using a top-down approach where enterprise software and IT services spend is reconstructed by region, then filtered by the share that typically goes to governance, risk, audit, and compliance use cases. Those totals are then corroborated with selective bottom-up approximations, such as sampled vendor revenue splits, channel checks with integrators, and a simple ASP times volume view for common license and subscription patterns. This helps us adjust when the first pass looks too high or too low.
A few market fingerprints are used as inputs and kept practical so they can be re-checked each year. Examples include the mix of software versus services in eGRC programs, the on-premises versus cloud shift, regulated industry penetration, and the pace of audit and control automation projects, which often track broader digitization budgets. For forecasting, we mainly use scenario analysis supported by a light multivariate regression where adoption rates, cloud migration pace, and compliance burden indicators are the key drivers. We then align assumptions to what interviewees expect for renewal cycles and new module uptake. When bottom-up signals are missing for smaller geographies, we fill gaps using region-specific adoption proxies and validate the implied per-enterprise spend against interview ranges.
Data Validation & Update Cycle
Validation is done in layers so that one source does not drive the final number. We compare the model outputs against independent signals like regional IT spending direction, hiring trends in risk and compliance roles, and the software to services revenue mix that is repeatedly mentioned in public filings. When a variance looks unusual, we revisit the assumptions, re-check currency conversion timing, and re-contact a small set of experts to understand what changed.
Before sign-off, the work goes through analyst review steps that include logic checks, year-over-year anomaly review, and reconciliation of segment adds to totals. Reports are refreshed annually, and interim updates are done when there is a material event such as a major regulatory change or a clear shift in pricing and deployment preference. Right before delivery, a fresh pass is completed so clients receive the latest updated view.
Mordor Intelligence's Enterprise Governance Risk and Compliance Market Size Versus Other Published Estimates
Published numbers for enterprise GRC do not always match, and it usually comes down to what is counted as eGRC revenue and how much adjacent software is pulled into the total. Differences also show up when one estimate leans on aggressive cloud adoption assumptions, while another stays conservative on services attachment and renewal uplift.
Key gaps we see in this market include whether broad cyber security platforms and consulting-heavy transformation work are included, and whether the study uses a strict software plus implementation scope or a wider enterprise risk umbrella. The spread can also be driven by how on-premises maintenance is treated, how currency timing is handled for multi-region totals, and how often assumptions are refreshed when regulatory topics change quickly.
Benchmark comparison
| Source | Market Size | Gaps in Research Methodology |
|---|---|---|
| Mordor Intelligence | USD 21.04 B (2025) | |
| Global Consultancy A | USD 49.85 B (2025) | This figure appears to apply a wider enterprise risk and compliance scope where spend tied to adjacent security and broader advisory work is more likely to be counted, which can lift totals beyond software plus eGRC services directly linked to governance and audit workflows. |
| Industry Publisher B | USD 20.81 B (2025) | This estimate aligns closely on year, but it can differ based on how deployment revenue is captured, especially if cloud subscriptions are netted differently from on-premises maintenance, and if business function coverage is used as a proxy instead of explicit eGRC use case mapping. |
The table shows that scope choices explain most of the variation, with the largest gap coming from how far the definition stretches into adjacent risk and consulting spend. By keeping the count anchored to eGRC software plus directly related services, and by re-checking the software to services mix and deployment split each cycle, the model stays traceable to repeatable inputs, a choice applied by Mordor Intelligence.
Key Questions Answered in the Report
What is the current size of the enterprise governance risk compliance market?
The market stands at USD 23.62 billion in 2026 and is projected to reach USD 42.19 billion by 2031.
Which component segment dominates the enterprise governance risk compliance market?
Software solutions lead with 66.72% revenue in 2025, while services are growing fastest at a 12.6% CAGR.
Why is Asia-Pacific the fastest-growing region?
Rapid regulatory evolution and RegTech expansion are driving a 12.9% CAGR through 2031 in the region.
How are AI technologies reshaping GRC platforms?
Generative models now interpret regulations with 95% accuracy, automate policy updates, and cut false positives by 42%.