| Study Period | 2017 - 2029 |
| Base Year For Estimation | 2023 |
| Forecast Data Period | 2024 - 2029 |
| Market Size (2024) | USD 122.81 Billion |
| Market Size (2029) | USD 171.45 Billion |
| CAGR (2024 - 2029) | 6.90 % |
| Market Concentration | Low |
Major Players*Disclaimer: Major Players sorted in no particular order |

Engineering Plastics Market Analysis
The Engineering Plastics Market size is estimated at 122.81 billion USD in 2024, and is expected to reach 171.45 billion USD by 2029, growing at a CAGR of 6.90% during the forecast period (2024-2029).
The engineering plastics industry is experiencing significant transformation driven by sustainability initiatives and technological advancements across major end-use sectors. Manufacturing companies are increasingly focusing on developing eco-friendly alternatives and sustainable production methods to meet stringent environmental regulations and changing consumer preferences. For instance, major industry players are investing in recycling capabilities and bio-based materials development. Global plastic packaging production reached 134 million tons in 2022, representing a 4.17% increase from the previous year, highlighting the growing demand for sustainable packaging solutions.
The industry is witnessing a notable shift toward advanced manufacturing technologies and smart manufacturing practices. The integration of automation, artificial intelligence, and Industry 4.0 principles is revolutionizing production processes and improving efficiency. Companies are investing in research and development to create innovative materials with enhanced properties. This technological evolution is particularly evident in the electrical and electronics sector, which generated substantial revenue of USD 32.6 billion in 2022, driven by the increasing adoption of engineering plastics in electronic components and devices.
The market is experiencing a significant transformation in end-use applications, particularly in the automotive and aerospace sectors. The growing emphasis on vehicle lightweighting and fuel efficiency is driving the adoption of engineering plastics as metal replacements. Manufacturers are developing specialized grades of engineering plastics with improved heat resistance, strength, and durability to meet the demanding requirements of these industries. The trend toward electric vehicles and advanced aerospace applications is further accelerating the development of high-performance engineering plastics with enhanced thermal and electrical properties.
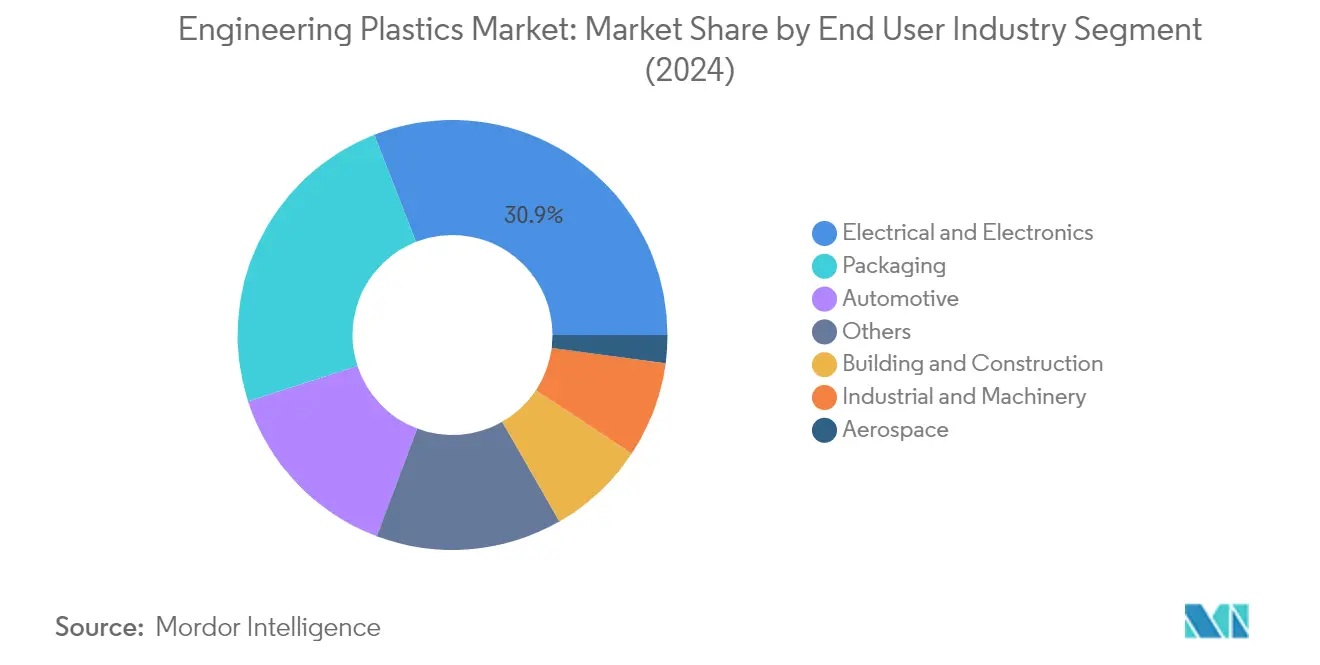
The industry is witnessing increased focus on circular economy principles and recycling initiatives. Major manufacturers are implementing innovative recycling technologies and developing closed-loop systems to reduce waste and improve resource efficiency. The packaging and electrical/electronics sectors, which accounted for approximately 24.07% and 30.93% of the market revenue respectively in 2022, are leading the adoption of recycled materials and sustainable practices. Companies are investing in advanced recycling facilities and developing new grades of recycled engineering plastics to meet the growing demand for sustainable materials while maintaining performance characteristics.
The plastic industry overview highlights the growing importance of sustainability and technological advancements. The plastics market size is expanding as companies adopt innovative practices to meet environmental goals. The plastics industry trends indicate a shift towards eco-friendly solutions, with the engineering plastics industry playing a crucial role in this transformation. As the plastic market trends evolve, the focus remains on developing engineered plastics and technical plastics that offer superior performance and sustainability.
Global Engineering Plastics Market Trends
Technological advancements in electronics industry may foster the growth
- The rapid pace of technological innovation in electronic products is driving the consistent demand for new and fast electrical and electronic products. In 2022, the global revenue of electrical and electronics stood at USD 5,807 billion, with Asia-Pacific holding a 74% market share, followed by Europe with a 13% share. The global electrical and electronics market is expected to record a CAGR of 6.61% during the forecast period.
- In 2018, the Asia-Pacific region witnessed strong economic growth owing to rapid industrialization in China, South Korea, Japan, India, and ASEAN countries. In 2020, due to the pandemic, there was a slowdown in global electrical and electronics production due to the shortage of chips and inefficiencies in the supply chain, which led to a stagnant growth rate of 0.1% in revenue compared to the previous year. This growth was driven by the demand for consumer electronics for remote working and home entertainment as people were forced to remain indoors during the pandemic.
- The demand for advanced technologies, such as digitalization, robotics, virtual reality, augmented reality, IoT (Internet of Things), and 5G connectivity, is expected to grow during the forecast period. Global electrical and electronics production is expected to register a growth rate of 5.9% in 2027. As a result of technological advancements, the demand for consumer electronics is expected to rise during the forecast period. For instance, the global consumer electronics industry is projected to witness a revenue reach of around USD 904.6 billion in 2027, compared to USD 719.1 billion in 2023. As a result, technological development is projected to lead the demand for electrical and electronic products during the forecast period.

Understand The Key Trends Shaping This Market
Download PDF
OTHER KEY INDUSTRY TRENDS COVERED IN THE REPORT
- Fast-paced growth of aviation industry and increased aircraft contracts may aid market growth
- Fast-paced urbanization and investments in Asia-Pacific region may boost the industry
- China to lead global import and export of fluoropolymer
- South Korea to emerge as significant polycarbonate exporter alongside China
- Automotive industry's growth to bolster trade of PMMA
- Demand from automotive industry to boost trade of ABS and SAN
- With government regulations and initiatives, the recycling rates are projected to grow across the world
- Global recycled PET production capacity is around 30 million tons with PET waste accounting for 141.2 million tons
- Growing demand for electric vehicles may boost automobile industry growth
- Demand for flexible packaging from the food and beverage industry boosting market growth
- Automotive production to increase German imports
- United States, Japan, and China to dominate imports of PET
- China, Belgium, and Germany are the top importers of POM resin
- Fluctuating crude oil prices impacting the cost of engineering plastics
- Polycarbonate plastics to pose a challenge because of the poor quality of the recovered material
- Governments around the world are encouraging the recycling of ABS and increasing recycling rates
Segment Analysis: End User Industry
Electrical & Electronics Segment in Engineering Plastics Market
The electrical and electronics industry represents the dominant segment in the global engineering plastics market, accounting for approximately 31% of the total market value in 2024. This segment's leadership position is driven by the widespread applications of engineering plastics, particularly styrene copolymers, polycarbonate, and polyamide, in advanced and smart electrical devices. The rapid pace of technological innovation is driving consistent demand for newer and faster electrical and electronic products, with applications ranging from casings and housings to circuit breaker housings, conduits, cable and wire insulation, and circuit boards. The segment is experiencing robust growth with a projected CAGR of around 8% during 2024-2029, primarily driven by the increasing adoption of advanced materials, organic electronics, miniaturization, and disruptive technologies like AI and IoT that may boost the adoption of smart manufacturing practices.
Remaining Segments in End User Industry
The engineering plastics market encompasses several other significant end-user segments, including packaging, automotive, building and construction, industrial and machinery, and aerospace industries. The packaging segment holds a substantial market share due to the growing demand for functional, prepackaged, and convenient food products. The automotive plastics sector utilizes engineering plastics for various applications, from exterior body panels to interior components, driven by the need for lightweight materials and enhanced fuel efficiency. The building and construction sector employs these materials for their durability and versatility in applications ranging from pipes to insulation. The industrial and machinery segment leverages engineering plastics for their high performance in demanding applications, while the aerospace plastics sector utilizes them for their exceptional strength-to-weight ratio and thermal stability properties.
Segment Analysis: Resin Type
PET Segment in Engineering Plastics Market
Polyethylene terephthalate (PET) dominates the engineering plastics market, holding approximately 23% of the global market share in 2024. The segment's prominence is primarily driven by its extensive applications in packaging, particularly in bottle manufacturing, container packaging, and films or sheets. PET's popularity stems from its unique properties, including excellent transparency, high strength, and recyclability, making it particularly suitable for food and beverage packaging applications. The segment's growth is further supported by increasing demand for sustainable packaging solutions in the food, beverage, and packaged drinking water industries. Major manufacturers are focusing on developing eco-friendly PET variants and expanding their production capacities to meet the rising global demand, particularly in emerging economies where packaging requirements continue to grow.
Fluoropolymer Segment in Engineering Plastics Market
The fluoropolymer segment is emerging as the most dynamic sector in the engineering plastics market, projected to grow at approximately 8% CAGR from 2024 to 2029. This remarkable growth is driven by increasing applications in high-performance industries such as aerospace, automotive, and electronics, where their exceptional properties, including high thermal stability, chemical resistance, and weather resistance, are highly valued. The segment's expansion is particularly notable in emerging applications like semiconductor manufacturing and 5G infrastructure development. Manufacturers are investing in research and development to enhance the performance characteristics of fluoropolymers, while also focusing on developing more sustainable production methods. The segment is witnessing increased adoption in medical devices and renewable energy applications, further driving its growth trajectory.
Remaining Segments in Resin Type
The engineering plastics market encompasses several other significant resin types, each serving specific industrial applications. Liquid Crystal Polymer (LCP) and PEEK plastic are gaining prominence in high-performance applications, particularly in the electronics and aerospace industries. Polyamide (PA), polycarbonate (PC), and Polybutylene Terephthalate (PBT) continue to be crucial in automotive and industrial applications due to their mechanical strength and thermal stability. Polymethyl Methacrylate (PMMA) and Polyoxymethylene (POM) serve specialized applications in construction and precision engineering. Styrene copolymers (ABS plastic and SAN) maintain their significance in consumer electronics and automotive applications. Each of these segments contributes uniquely to the market's diversity and growth, driven by continuous innovations in material science and expanding application areas.
Engineering Plastics Market Geography Segment Analysis
Engineering Plastics Market in Africa
The African engineering plastics market demonstrates significant regional variations in consumption patterns and industrial applications. The market is primarily driven by South Africa and Nigeria, with these countries showing distinct growth trajectories based on their industrial development and economic conditions. The region's growth is supported by increasing investments in automotive manufacturing, packaging applications, and construction activities, with different countries focusing on specific end-use industries based on their economic strengths and industrial policies.
Engineering Plastics Market in South Africa
South Africa dominates the African engineering plastics market through its well-established manufacturing base and diverse industrial applications. The country's market is primarily driven by its robust automotive sector, aerospace industry, and growing packaging applications. South Africa holds approximately 30% market share of engineering plastics in 2024, supported by its key position in vehicle production and aerospace component manufacturing. The country's engineering plastics consumption is particularly strong in the automotive sector, where it maintains its position as a significant manufacturing hub in Africa.
Engineering Plastics Market in Nigeria
Nigeria represents the most dynamic growth market for industrial engineering plastics in Africa, with a projected growth rate of approximately 6% during 2024-2029. The country's market expansion is primarily driven by increasing investments in vehicle production and the growing packaging industry. Nigeria's position as Africa's largest vehicle producer has created substantial opportunities for engineering plastics applications, particularly in automotive components and parts. The country's growth is further supported by its expanding industrial base and increasing domestic manufacturing activities.
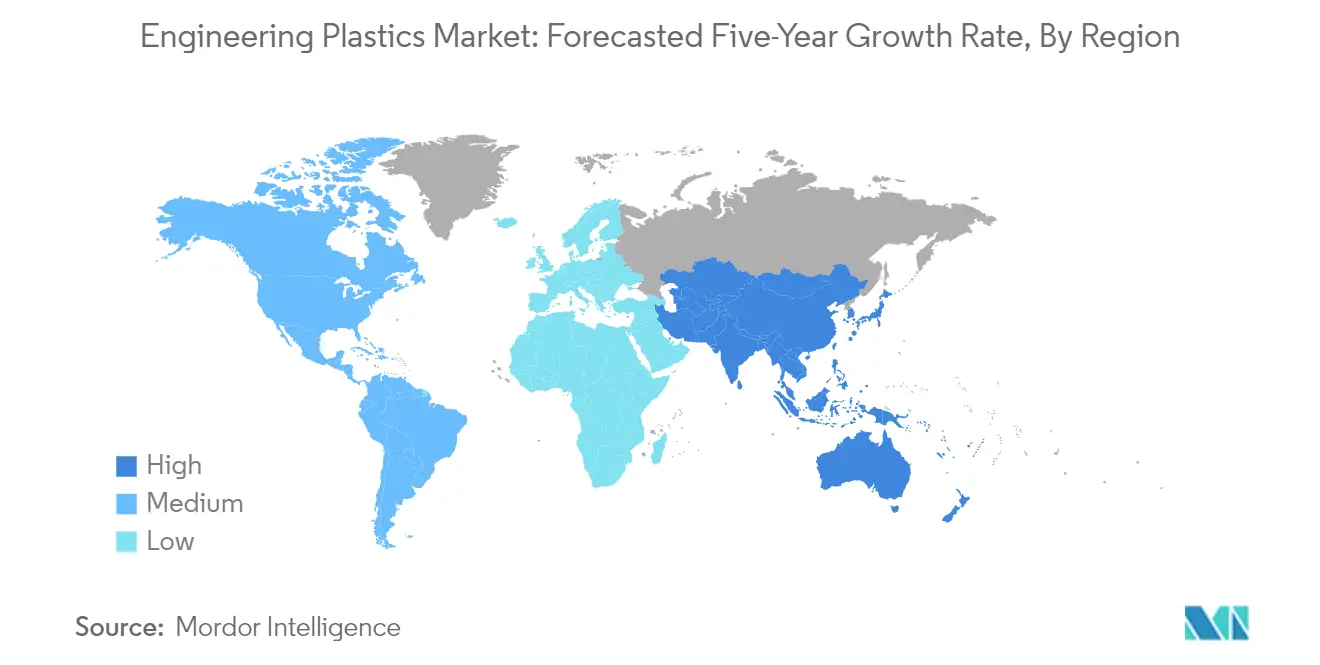
Engineering Plastics Market in Asia-Pacific
The Asia-Pacific region represents the largest market for engineering plastics globally, characterized by diverse industrial applications and varying levels of market maturity across countries. The region encompasses major manufacturing hubs like China, Japan, and South Korea, alongside emerging markets such as India and Malaysia. The market is driven by robust growth in electrical and electronics manufacturing, automotive production, and packaging applications across these countries.
Engineering Plastics Market in China
China maintains its position as the dominant force in the Asia-Pacific engineering plastics market, holding approximately 63% market share in 2024. The country's market leadership is built on its massive manufacturing base, particularly in electrical and electronics production, automotive manufacturing, and packaging industries. China's market is characterized by significant domestic production capacity and a well-developed supply chain network, supported by continued investments in manufacturing capabilities and technological advancement.
Engineering Plastics Market Growth in China
China also leads the region in terms of growth, with a projected CAGR of approximately 8% during 2024-2029. The country's growth trajectory is driven by rapid expansion in electric vehicle production, increasing electronics manufacturing, and growing domestic consumption. The Chinese market benefits from government initiatives promoting industrial upgrading and technological innovation, particularly in sectors like automotive and electronics manufacturing, which are major consumers of engineering plastics.
Engineering Plastics Market in Europe
The European engineering plastics market is characterized by its mature industrial base and high technological standards across various manufacturing sectors. The region's market is led by Germany, with significant contributions from Italy, France, Russia, and the United Kingdom. The market benefits from strong automotive manufacturing, advanced aerospace industry, and growing emphasis on sustainable manufacturing practices across these countries.
Engineering Plastics Market in Germany
Germany maintains its position as the largest market for engineering plastics in Europe, driven by its robust automotive industry, advanced manufacturing capabilities, and strong focus on technological innovation. The country's dominance is reflected in its approximately 20% market share in 2024. Germany's market is particularly strong in automotive applications, electrical and electronics manufacturing, and industrial machinery production.
Engineering Plastics Market in United Kingdom
The United Kingdom emerges as the fastest-growing market for engineering plastics in Europe, with a projected growth rate of approximately 7% during 2024-2029. The country's growth is primarily driven by its strong aerospace industry, expanding electronics sector, and increasing investments in sustainable manufacturing technologies. The UK market particularly benefits from its position as a major hub for aerospace manufacturing and technological innovation.
Engineering Plastics Market in Middle East
The Middle Eastern engineering plastics market is characterized by growing industrial diversification and increasing investments in manufacturing capabilities. Saudi Arabia leads the regional market, while the United Arab Emirates shows the fastest growth trajectory. The region's market is primarily driven by packaging applications, construction activities, and growing investments in electrical and electronics manufacturing. The market benefits from ongoing industrial development programs and increasing focus on economic diversification across these countries.
Engineering Plastics Market in North America
The North American engineering plastics market demonstrates strong technological advancement and diverse industrial applications across its key countries. The United States leads the regional market, leveraging its strong manufacturing base and technological capabilities, while Mexico emerges as the fastest-growing market. The region's market is characterized by robust demand from automotive manufacturing, aerospace applications, and packaging industries, supported by strong research and development capabilities and established manufacturing infrastructure.
Engineering Plastics Market in South America
The South American engineering plastics market shows significant potential for growth, with Brazil leading the regional market while Argentina demonstrates the fastest growth rate. The market is characterized by increasing investments in automotive manufacturing, growing packaging applications, and expanding industrial infrastructure. The region's development is supported by government initiatives promoting industrial growth and increasing domestic manufacturing capabilities across various sectors.
Get Analysis on Important Geographic Markets
Download PDF
Engineering Plastics Industry Overview
Top Companies in Engineering Plastics Market
The engineering plastics market is characterized by intense competition among major manufacturers who are actively pursuing innovation and expansion strategies. Companies are focusing on developing sustainable solutions, including recycled content products and bio-based alternatives, to meet growing environmental concerns. Operational agility is demonstrated through strategic production facility locations near key markets and research centers, enabling better quality control and faster response to market demands. Manufacturers are expanding their global footprint through joint ventures and partnerships, particularly in high-growth regions like Asia-Pacific. Product innovation efforts are largely centered on developing specialized grades for emerging applications in electric vehicles, 5G infrastructure, and medical devices. Companies are also investing in mechanical recycling facilities and circular economy initiatives while strengthening their distribution networks through strategic partnerships with regional distributors.
Market Dominated by Diversified Chemical Conglomerates
The global engineering plastics market exhibits a fragmented competitive landscape with a mix of large multinational chemical conglomerates and specialized manufacturers. Major players leverage their integrated supply chains, extensive R&D capabilities, and broad product portfolios to maintain market positions across multiple regions. The market structure varies by resin type, with some segments like PEEK and LCP being highly consolidated while others like PET and PA remain relatively fragmented. Asian manufacturers, particularly from China, are increasingly gaining market share through capacity expansions and competitive pricing strategies.
The industry has witnessed significant consolidation through mergers and acquisitions, particularly in specialized segments like high-performance polymers. Companies are acquiring technology-focused firms to enhance their product portfolios and gain access to proprietary manufacturing processes. Vertical integration strategies are becoming prominent as manufacturers seek to secure raw material supply and strengthen their position in the value chain. Regional players are forming strategic alliances with global companies to expand their market presence and access advanced technologies, while established players are acquiring local manufacturers to penetrate emerging markets. This dynamic is evident in the analysis of the plastics market, which highlights the strategic maneuvers of key players.
Innovation and Sustainability Drive Future Success
Success in the engineering plastics market increasingly depends on companies' ability to develop sustainable solutions while maintaining performance standards. Incumbent players must focus on expanding their recycled content offerings, investing in circular economy initiatives, and developing bio-based alternatives to maintain their competitive edge. Building strong relationships with end-users through technical support and customization capabilities is becoming crucial for market success. Companies need to strengthen their position in high-growth applications like electric vehicles and electronics while maintaining a balanced geographic presence across mature and emerging markets.
New entrants and challenger companies can gain market share by focusing on specialized applications and niche markets where larger players may have limited presence. Success factors include developing innovative solutions for specific industry challenges, establishing strong distribution networks, and forming strategic partnerships with established players. Companies must also consider potential regulatory changes regarding recycling and environmental protection, which could significantly impact market dynamics. Building manufacturing capabilities in key growth regions while maintaining flexibility to adapt to changing market conditions will be crucial for long-term success in the market. The role of technology in engineering plastics in driving innovation cannot be overstated, as it underpins the development of advanced products made from engineering plastics tailored to emerging needs.
Engineering Plastics Market Leaders
-
Alfa S.A.B. de C.V.
-
CHIMEI
-
Far Eastern New Century Corporation
-
Indorama Ventures Public Company Limited
-
SABIC
- *Disclaimer: Major Players sorted in no particular order

Need More Details on Market Players and Competiters?
Download PDF
Engineering Plastics Market News
- March 2023: Victrex PLC introduced a new type of implantable PEEK-OPTIMA polymer that is specifically designed for use in the manufacturing processes of medical device additives, such as fused deposition modeling (FDM) and fused filament fabrication (FFF).
- February 2023: Victrex PLC revealed its plans to invest in the expansion of its medical division, Invibio Biomaterial Solutions, which includes establishing a new product development facility in Leeds, United Kingdom.
- February 2023: Covestro AG introduced Makrolon 3638 polycarbonate for healthcare and life sciences applications such as drug delivery devices, wellness and wearable devices, and single-use containers for biopharmaceutical manufacturing.
Free With This Report
We provide a complimentary and exhaustive set of data points on global and regional metrics that present the fundamental structure of the industry. Presented in the form of 15+ free charts, the section covers rare data on various end-user production trends including passenger vehicle production, commercial vehicle production, motorcycle production, aerospace components production, electrical and electronics production, and regional data for engineering plastics demand etc.


Engineering Plastics Market Report - Table of Contents
1. EXECUTIVE SUMMARY & KEY FINDINGS
2. REPORT OFFERS
3. INTRODUCTION
- 3.1 Study Assumptions & Market Definition
- 3.2 Scope of the Study
- 3.3 Research Methodology
4. KEY INDUSTRY TRENDS
-
4.1 End User Trends
- 4.1.1 Aerospace
- 4.1.2 Automotive
- 4.1.3 Building and Construction
- 4.1.4 Electrical and Electronics
- 4.1.5 Packaging
-
4.2 Import And Export Trends
- 4.2.1 Fluoropolymer Trade
- 4.2.2 Polyamide (PA) Trade
- 4.2.3 Polycarbonate (PC) Trade
- 4.2.4 Polyethylene Terephthalate (PET) Trade
- 4.2.5 Polymethyl Methacrylate (PMMA) Trade
- 4.2.6 Polyoxymethylene (POM) Trade
- 4.2.7 Styrene Copolymers (ABS and SAN) Trade
- 4.3 Price Trends
-
4.4 Recycling Overview
- 4.4.1 Polyamide (PA) Recycling Trends
- 4.4.2 Polycarbonate (PC) Recycling Trends
- 4.4.3 Polyethylene Terephthalate (PET) Recycling Trends
- 4.4.4 Styrene Copolymers (ABS and SAN) Recycling Trends
-
4.5 Regulatory Framework
- 4.5.1 Argentina
- 4.5.2 Australia
- 4.5.3 Brazil
- 4.5.4 Canada
- 4.5.5 China
- 4.5.6 EU
- 4.5.7 India
- 4.5.8 Japan
- 4.5.9 Malaysia
- 4.5.10 Mexico
- 4.5.11 Nigeria
- 4.5.12 Russia
- 4.5.13 Saudi Arabia
- 4.5.14 South Africa
- 4.5.15 South Korea
- 4.5.16 United Arab Emirates
- 4.5.17 United Kingdom
- 4.5.18 United States
- 4.6 Value Chain & Distribution Channel Analysis
5. MARKET SEGMENTATION (includes market size in Value in USD and Volume, Forecasts up to 2029 and analysis of growth prospects)
-
5.1 End User Industry
- 5.1.1 Aerospace
- 5.1.2 Automotive
- 5.1.3 Building and Construction
- 5.1.4 Electrical and Electronics
- 5.1.5 Industrial and Machinery
- 5.1.6 Packaging
- 5.1.7 Other End-user Industries
-
5.2 Resin Type
- 5.2.1 Fluoropolymer
- 5.2.1.1 By Sub Resin Type
- 5.2.1.1.1 Ethylenetetrafluoroethylene (ETFE)
- 5.2.1.1.2 Fluorinated Ethylene-propylene (FEP)
- 5.2.1.1.3 Polytetrafluoroethylene (PTFE)
- 5.2.1.1.4 Polyvinylfluoride (PVF)
- 5.2.1.1.5 Polyvinylidene Fluoride (PVDF)
- 5.2.1.1.6 Other Sub Resin Types
- 5.2.2 Liquid Crystal Polymer (LCP)
- 5.2.3 Polyamide (PA)
- 5.2.3.1 By Sub Resin Type
- 5.2.3.1.1 Aramid
- 5.2.3.1.2 Polyamide (PA) 6
- 5.2.3.1.3 Polyamide (PA) 66
- 5.2.3.1.4 Polyphthalamide
- 5.2.4 Polybutylene Terephthalate (PBT)
- 5.2.5 Polycarbonate (PC)
- 5.2.6 Polyether Ether Ketone (PEEK)
- 5.2.7 Polyethylene Terephthalate (PET)
- 5.2.8 Polyimide (PI)
- 5.2.9 Polymethyl Methacrylate (PMMA)
- 5.2.10 Polyoxymethylene (POM)
- 5.2.11 Styrene Copolymers (ABS and SAN)
-
5.3 Region
- 5.3.1 Africa
- 5.3.1.1 By Country
- 5.3.1.1.1 Nigeria
- 5.3.1.1.2 South Africa
- 5.3.1.1.3 Rest of Africa
- 5.3.2 Asia-Pacific
- 5.3.2.1 By Country
- 5.3.2.1.1 Australia
- 5.3.2.1.2 China
- 5.3.2.1.3 India
- 5.3.2.1.4 Japan
- 5.3.2.1.5 Malaysia
- 5.3.2.1.6 South Korea
- 5.3.2.1.7 Rest of Asia-Pacific
- 5.3.3 Europe
- 5.3.3.1 By Country
- 5.3.3.1.1 France
- 5.3.3.1.2 Germany
- 5.3.3.1.3 Italy
- 5.3.3.1.4 Russia
- 5.3.3.1.5 United Kingdom
- 5.3.3.1.6 Rest of Europe
- 5.3.4 Middle East
- 5.3.4.1 By Country
- 5.3.4.1.1 Saudi Arabia
- 5.3.4.1.2 United Arab Emirates
- 5.3.4.1.3 Rest of Middle East
- 5.3.5 North America
- 5.3.5.1 By Country
- 5.3.5.1.1 Canada
- 5.3.5.1.2 Mexico
- 5.3.5.1.3 United States
- 5.3.6 South America
- 5.3.6.1 By Country
- 5.3.6.1.1 Argentina
- 5.3.6.1.2 Brazil
- 5.3.6.1.3 Rest of South America
6. COMPETITIVE LANDSCAPE
- 6.1 Key Strategic Moves
- 6.2 Market Share Analysis
- 6.3 Company Landscape
-
6.4 Company Profiles (includes Global Level Overview, Market Level Overview, Core Business Segments, Financials, Headcount, Key Information, Market Rank, Market Share, Products and Services, and Analysis of Recent Developments).
- 6.4.1 Alfa S.A.B. de C.V.
- 6.4.2 BASF SE
- 6.4.3 Celanese Corporation
- 6.4.4 CHIMEI
- 6.4.5 Covestro AG
- 6.4.6 Dongyue Group
- 6.4.7 DuPont
- 6.4.8 Far Eastern New Century Corporation
- 6.4.9 Indorama Ventures Public Company Limited
- 6.4.10 LG Chem
- 6.4.11 Mitsubishi Chemical Corporation
- 6.4.12 SABIC
- 6.4.13 Solvay
- 6.4.14 Toray Industries, Inc.
- 6.4.15 Victrex
7. KEY STRATEGIC QUESTIONS FOR ENGINEERING PLASTICS CEOS
8. APPENDIX
-
8.1 Global Overview
- 8.1.1 Overview
- 8.1.2 Porter’s Five Forces Framework (Industry Attractiveness Analysis)
- 8.1.3 Global Value Chain Analysis
- 8.1.4 Market Dynamics (DROs)
- 8.2 Sources & References
- 8.3 List of Tables & Figures
- 8.4 Primary Insights
- 8.5 Data Pack
- 8.6 Glossary of Terms
You Can Purchase Parts Of This Report. Check Out Prices For Specific Sections
Get Price Break-up Now
List of Tables & Figures
- Figure 1:
- PRODUCTION REVENUE OF AEROSPACE COMPONENTS, USD, GLOBAL, 2017 - 2029
- Figure 2:
- PRODUCTION VOLUME OF AUTOMOBILES, UNITS, GLOBAL, 2017 - 2029
- Figure 3:
- FLOOR AREA OF NEW CONSTRUCTION, SQUARE FEET, GLOBAL, 2017 - 2029
- Figure 4:
- PRODUCTION REVENUE OF ELECTRICAL AND ELECTRONICS, USD, GLOBAL, 2017 - 2029
- Figure 5:
- PRODUCTION VOLUME OF PLASTIC PACKAGING, TONS, GLOBAL, 2017 - 2029
- Figure 6:
- IMPORT REVENUE OF FLUOROPOLYMER TRADE BY TOP COUNTRIES, USD, GLOBAL, 2017 - 2021
- Figure 7:
- EXPORT REVENUE OF FLUOROPOLYMER TRADE BY TOP COUNTRIES, USD, GLOBAL, 2017 - 2021
- Figure 8:
- IMPORT REVENUE OF POLYAMIDE (PA) TRADE BY TOP COUNTRIES, USD, GLOBAL, 2017 - 2021
- Figure 9:
- EXPORT REVENUE OF POLYAMIDE (PA) TRADE BY TOP COUNTRIES, USD, GLOBAL, 2017 - 2021
- Figure 10:
- IMPORT REVENUE OF POLYCARBONATE (PC) TRADE BY TOP COUNTRIES, USD, GLOBAL, 2017 - 2021
- Figure 11:
- EXPORT REVENUE OF POLYCARBONATE (PC) TRADE BY TOP COUNTRIES, USD, GLOBAL, 2017 - 2021
- Figure 12:
- IMPORT REVENUE OF POLYETHYLENE TEREPHTHALATE (PET) TRADE BY TOP COUNTRIES, USD, GLOBAL, 2017 - 2021
- Figure 13:
- EXPORT REVENUE OF POLYETHYLENE TEREPHTHALATE (PET) TRADE BY TOP COUNTRIES, USD, GLOBAL, 2017 - 2021
- Figure 14:
- IMPORT REVENUE OF POLYMETHYL METHACRYLATE (PMMA) TRADE BY TOP COUNTRIES, USD, GLOBAL, 2017 - 2021
- Figure 15:
- EXPORT REVENUE OF POLYMETHYL METHACRYLATE (PMMA) TRADE BY TOP COUNTRIES, USD, GLOBAL, 2017 - 2021
- Figure 16:
- IMPORT REVENUE OF POLYOXYMETHYLENE (POM) TRADE BY TOP COUNTRIES, USD, GLOBAL, 2017 - 2021
- Figure 17:
- EXPORT REVENUE OF POLYOXYMETHYLENE (POM) TRADE BY TOP COUNTRIES, USD, GLOBAL, 2017 - 2021
- Figure 18:
- IMPORT REVENUE OF STYRENE COPOLYMERS (ABS AND SAN) TRADE BY TOP COUNTRIES, USD, GLOBAL, 2017 - 2021
- Figure 19:
- EXPORT REVENUE OF STYRENE COPOLYMERS (ABS AND SAN) TRADE BY TOP COUNTRIES, USD, GLOBAL, 2017 - 2021
- Figure 20:
- PRICE OF ENGINEERING PLASTICS BY RESIN TYPE, USD PER KG, UNITED STATES, 2017 - 2021
- Figure 21:
- PRICE OF ENGINEERING PLASTICS BY RESIN TYPE, USD PER KG, CHINA, 2017 - 2021
- Figure 22:
- VOLUME OF ENGINEERING PLASTICS CONSUMED, TONS, GLOBAL, 2017 - 2029
- Figure 23:
- VALUE OF ENGINEERING PLASTICS CONSUMED, USD, GLOBAL, 2017 - 2029
- Figure 24:
- VOLUME OF ENGINEERING PLASTICS CONSUMED BY END USER INDUSTRY, TONS, GLOBAL, 2017 - 2029
- Figure 25:
- VALUE OF ENGINEERING PLASTICS CONSUMED BY END USER INDUSTRY, USD, GLOBAL, 2017 - 2029
- Figure 26:
- VOLUME SHARE OF ENGINEERING PLASTICS CONSUMED BY END USER INDUSTRY, %, GLOBAL, 2017, 2023, AND 2029
- Figure 27:
- VALUE SHARE OF ENGINEERING PLASTICS CONSUMED BY END USER INDUSTRY, %, GLOBAL, 2017, 2023, AND 2029
- Figure 28:
- VOLUME OF ENGINEERING PLASTICS CONSUMED IN AEROSPACE INDUSTRY, TONS, GLOBAL, 2017 - 2029
- Figure 29:
- VALUE OF ENGINEERING PLASTICS CONSUMED IN AEROSPACE INDUSTRY, USD, GLOBAL, 2017 - 2029
- Figure 30:
- VALUE SHARE OF ENGINEERING PLASTICS CONSUMED IN AEROSPACE INDUSTRY BY RESIN TYPE, %, GLOBAL, 2022 VS 2029
- Figure 31:
- VOLUME OF ENGINEERING PLASTICS CONSUMED IN AUTOMOTIVE INDUSTRY, TONS, GLOBAL, 2017 - 2029
- Figure 32:
- VALUE OF ENGINEERING PLASTICS CONSUMED IN AUTOMOTIVE INDUSTRY, USD, GLOBAL, 2017 - 2029
- Figure 33:
- VALUE SHARE OF ENGINEERING PLASTICS CONSUMED IN AUTOMOTIVE INDUSTRY BY RESIN TYPE, %, GLOBAL, 2022 VS 2029
- Figure 34:
- VOLUME OF ENGINEERING PLASTICS CONSUMED IN BUILDING AND CONSTRUCTION INDUSTRY, TONS, GLOBAL, 2017 - 2029
- Figure 35:
- VALUE OF ENGINEERING PLASTICS CONSUMED IN BUILDING AND CONSTRUCTION INDUSTRY, USD, GLOBAL, 2017 - 2029
- Figure 36:
- VALUE SHARE OF ENGINEERING PLASTICS CONSUMED IN BUILDING AND CONSTRUCTION INDUSTRY BY RESIN TYPE, %, GLOBAL, 2022 VS 2029
- Figure 37:
- VOLUME OF ENGINEERING PLASTICS CONSUMED IN ELECTRICAL AND ELECTRONICS INDUSTRY, TONS, GLOBAL, 2017 - 2029
- Figure 38:
- VALUE OF ENGINEERING PLASTICS CONSUMED IN ELECTRICAL AND ELECTRONICS INDUSTRY, USD, GLOBAL, 2017 - 2029
- Figure 39:
- VALUE SHARE OF ENGINEERING PLASTICS CONSUMED IN ELECTRICAL AND ELECTRONICS INDUSTRY BY RESIN TYPE, %, GLOBAL, 2022 VS 2029
- Figure 40:
- VOLUME OF ENGINEERING PLASTICS CONSUMED IN INDUSTRIAL AND MACHINERY INDUSTRY, TONS, GLOBAL, 2017 - 2029
- Figure 41:
- VALUE OF ENGINEERING PLASTICS CONSUMED IN INDUSTRIAL AND MACHINERY INDUSTRY, USD, GLOBAL, 2017 - 2029
- Figure 42:
- VALUE SHARE OF ENGINEERING PLASTICS CONSUMED IN INDUSTRIAL AND MACHINERY INDUSTRY BY RESIN TYPE, %, GLOBAL, 2022 VS 2029
- Figure 43:
- VOLUME OF ENGINEERING PLASTICS CONSUMED IN PACKAGING INDUSTRY, TONS, GLOBAL, 2017 - 2029
- Figure 44:
- VALUE OF ENGINEERING PLASTICS CONSUMED IN PACKAGING INDUSTRY, USD, GLOBAL, 2017 - 2029
- Figure 45:
- VALUE SHARE OF ENGINEERING PLASTICS CONSUMED IN PACKAGING INDUSTRY BY RESIN TYPE, %, GLOBAL, 2022 VS 2029
- Figure 46:
- VOLUME OF ENGINEERING PLASTICS CONSUMED IN OTHER END-USER INDUSTRIES INDUSTRY, TONS, GLOBAL, 2017 - 2029
- Figure 47:
- VALUE OF ENGINEERING PLASTICS CONSUMED IN OTHER END-USER INDUSTRIES INDUSTRY, USD, GLOBAL, 2017 - 2029
- Figure 48:
- VALUE SHARE OF ENGINEERING PLASTICS CONSUMED IN OTHER END-USER INDUSTRIES INDUSTRY BY RESIN TYPE, %, GLOBAL, 2022 VS 2029
- Figure 49:
- VOLUME OF ENGINEERING PLASTICS CONSUMED BY RESIN TYPE, TONS, GLOBAL, 2017 - 2029
- Figure 50:
- VALUE OF ENGINEERING PLASTICS CONSUMED BY RESIN TYPE, USD, GLOBAL, 2017 - 2029
- Figure 51:
- VOLUME SHARE OF ENGINEERING PLASTICS CONSUMED BY RESIN TYPE, %, GLOBAL, 2017, 2023, AND 2029
- Figure 52:
- VALUE SHARE OF ENGINEERING PLASTICS CONSUMED BY RESIN TYPE, %, GLOBAL, 2017, 2023, AND 2029
- Figure 53:
- VOLUME OF FLUOROPOLYMER CONSUMED BY SUB RESIN TYPE, TONS, GLOBAL, 2017 - 2029
- Figure 54:
- VALUE OF FLUOROPOLYMER CONSUMED BY SUB RESIN TYPE, USD, GLOBAL, 2017 - 2029
- Figure 55:
- VOLUME SHARE OF FLUOROPOLYMER CONSUMED BY SUB RESIN TYPE, %, GLOBAL, 2017, 2023, AND 2029
- Figure 56:
- VALUE SHARE OF FLUOROPOLYMER CONSUMED BY SUB RESIN TYPE, %, GLOBAL, 2017, 2023, AND 2029
- Figure 57:
- VOLUME OF ETHYLENETETRAFLUOROETHYLENE (ETFE) CONSUMED, TONS, GLOBAL, 2017 - 2029
- Figure 58:
- VALUE OF ETHYLENETETRAFLUOROETHYLENE (ETFE) CONSUMED, USD, GLOBAL, 2017 - 2029
- Figure 59:
- VALUE SHARE OF ETHYLENETETRAFLUOROETHYLENE (ETFE) CONSUMED BY END USER INDUSTRY, %, GLOBAL, 2022 VS 2029
- Figure 60:
- VOLUME OF FLUORINATED ETHYLENE-PROPYLENE (FEP) CONSUMED, TONS, GLOBAL, 2017 - 2029
- Figure 61:
- VALUE OF FLUORINATED ETHYLENE-PROPYLENE (FEP) CONSUMED, USD, GLOBAL, 2017 - 2029
- Figure 62:
- VALUE SHARE OF FLUORINATED ETHYLENE-PROPYLENE (FEP) CONSUMED BY END USER INDUSTRY, %, GLOBAL, 2022 VS 2029
- Figure 63:
- VOLUME OF POLYTETRAFLUOROETHYLENE (PTFE) CONSUMED, TONS, GLOBAL, 2017 - 2029
- Figure 64:
- VALUE OF POLYTETRAFLUOROETHYLENE (PTFE) CONSUMED, USD, GLOBAL, 2017 - 2029
- Figure 65:
- VALUE SHARE OF POLYTETRAFLUOROETHYLENE (PTFE) CONSUMED BY END USER INDUSTRY, %, GLOBAL, 2022 VS 2029
- Figure 66:
- VOLUME OF POLYVINYLFLUORIDE (PVF) CONSUMED, TONS, GLOBAL, 2017 - 2029
- Figure 67:
- VALUE OF POLYVINYLFLUORIDE (PVF) CONSUMED, USD, GLOBAL, 2017 - 2029
- Figure 68:
- VALUE SHARE OF POLYVINYLFLUORIDE (PVF) CONSUMED BY END USER INDUSTRY, %, GLOBAL, 2022 VS 2029
- Figure 69:
- VOLUME OF POLYVINYLIDENE FLUORIDE (PVDF) CONSUMED, TONS, GLOBAL, 2017 - 2029
- Figure 70:
- VALUE OF POLYVINYLIDENE FLUORIDE (PVDF) CONSUMED, USD, GLOBAL, 2017 - 2029
- Figure 71:
- VALUE SHARE OF POLYVINYLIDENE FLUORIDE (PVDF) CONSUMED BY END USER INDUSTRY, %, GLOBAL, 2022 VS 2029
- Figure 72:
- VOLUME OF OTHER SUB RESIN TYPES CONSUMED, TONS, GLOBAL, 2017 - 2029
- Figure 73:
- VALUE OF OTHER SUB RESIN TYPES CONSUMED, USD, GLOBAL, 2017 - 2029
- Figure 74:
- VALUE SHARE OF OTHER SUB RESIN TYPES CONSUMED BY END USER INDUSTRY, %, GLOBAL, 2022 VS 2029
- Figure 75:
- VOLUME OF LIQUID CRYSTAL POLYMER (LCP) CONSUMED, TONS, GLOBAL, 2017 - 2029
- Figure 76:
- VALUE OF LIQUID CRYSTAL POLYMER (LCP) CONSUMED, USD, GLOBAL, 2017 - 2029
- Figure 77:
- VALUE SHARE OF LIQUID CRYSTAL POLYMER (LCP) CONSUMED BY END USER INDUSTRY, %, GLOBAL, 2022 VS 2029
- Figure 78:
- VOLUME OF POLYAMIDE (PA) CONSUMED BY SUB RESIN TYPE, TONS, GLOBAL, 2017 - 2029
- Figure 79:
- VALUE OF POLYAMIDE (PA) CONSUMED BY SUB RESIN TYPE, USD, GLOBAL, 2017 - 2029
- Figure 80:
- VOLUME SHARE OF POLYAMIDE (PA) CONSUMED BY SUB RESIN TYPE, %, GLOBAL, 2017, 2023, AND 2029
- Figure 81:
- VALUE SHARE OF POLYAMIDE (PA) CONSUMED BY SUB RESIN TYPE, %, GLOBAL, 2017, 2023, AND 2029
- Figure 82:
- VOLUME OF ARAMID CONSUMED, TONS, GLOBAL, 2017 - 2029
- Figure 83:
- VALUE OF ARAMID CONSUMED, USD, GLOBAL, 2017 - 2029
- Figure 84:
- VALUE SHARE OF ARAMID CONSUMED BY END USER INDUSTRY, %, GLOBAL, 2022 VS 2029
- Figure 85:
- VOLUME OF POLYAMIDE (PA) 6 CONSUMED, TONS, GLOBAL, 2017 - 2029
- Figure 86:
- VALUE OF POLYAMIDE (PA) 6 CONSUMED, USD, GLOBAL, 2017 - 2029
- Figure 87:
- VALUE SHARE OF POLYAMIDE (PA) 6 CONSUMED BY END USER INDUSTRY, %, GLOBAL, 2022 VS 2029
- Figure 88:
- VOLUME OF POLYAMIDE (PA) 66 CONSUMED, TONS, GLOBAL, 2017 - 2029
- Figure 89:
- VALUE OF POLYAMIDE (PA) 66 CONSUMED, USD, GLOBAL, 2017 - 2029
- Figure 90:
- VALUE SHARE OF POLYAMIDE (PA) 66 CONSUMED BY END USER INDUSTRY, %, GLOBAL, 2022 VS 2029
- Figure 91:
- VOLUME OF POLYPHTHALAMIDE CONSUMED, TONS, GLOBAL, 2017 - 2029
- Figure 92:
- VALUE OF POLYPHTHALAMIDE CONSUMED, USD, GLOBAL, 2017 - 2029
- Figure 93:
- VALUE SHARE OF POLYPHTHALAMIDE CONSUMED BY END USER INDUSTRY, %, GLOBAL, 2022 VS 2029
- Figure 94:
- VOLUME OF POLYBUTYLENE TEREPHTHALATE (PBT) CONSUMED, TONS, GLOBAL, 2017 - 2029
- Figure 95:
- VALUE OF POLYBUTYLENE TEREPHTHALATE (PBT) CONSUMED, USD, GLOBAL, 2017 - 2029
- Figure 96:
- VALUE SHARE OF POLYBUTYLENE TEREPHTHALATE (PBT) CONSUMED BY END USER INDUSTRY, %, GLOBAL, 2022 VS 2029
- Figure 97:
- VOLUME OF POLYCARBONATE (PC) CONSUMED, TONS, GLOBAL, 2017 - 2029
- Figure 98:
- VALUE OF POLYCARBONATE (PC) CONSUMED, USD, GLOBAL, 2017 - 2029
- Figure 99:
- VALUE SHARE OF POLYCARBONATE (PC) CONSUMED BY END USER INDUSTRY, %, GLOBAL, 2022 VS 2029
- Figure 100:
- VOLUME OF POLYETHER ETHER KETONE (PEEK) CONSUMED, TONS, GLOBAL, 2017 - 2029
- Figure 101:
- VALUE OF POLYETHER ETHER KETONE (PEEK) CONSUMED, USD, GLOBAL, 2017 - 2029
- Figure 102:
- VALUE SHARE OF POLYETHER ETHER KETONE (PEEK) CONSUMED BY END USER INDUSTRY, %, GLOBAL, 2022 VS 2029
- Figure 103:
- VOLUME OF POLYETHYLENE TEREPHTHALATE (PET) CONSUMED, TONS, GLOBAL, 2017 - 2029
- Figure 104:
- VALUE OF POLYETHYLENE TEREPHTHALATE (PET) CONSUMED, USD, GLOBAL, 2017 - 2029
- Figure 105:
- VALUE SHARE OF POLYETHYLENE TEREPHTHALATE (PET) CONSUMED BY END USER INDUSTRY, %, GLOBAL, 2022 VS 2029
- Figure 106:
- VOLUME OF POLYIMIDE (PI) CONSUMED, TONS, GLOBAL, 2017 - 2029
- Figure 107:
- VALUE OF POLYIMIDE (PI) CONSUMED, USD, GLOBAL, 2017 - 2029
- Figure 108:
- VALUE SHARE OF POLYIMIDE (PI) CONSUMED BY END USER INDUSTRY, %, GLOBAL, 2022 VS 2029
- Figure 109:
- VOLUME OF POLYMETHYL METHACRYLATE (PMMA) CONSUMED, TONS, GLOBAL, 2017 - 2029
- Figure 110:
- VALUE OF POLYMETHYL METHACRYLATE (PMMA) CONSUMED, USD, GLOBAL, 2017 - 2029
- Figure 111:
- VALUE SHARE OF POLYMETHYL METHACRYLATE (PMMA) CONSUMED BY END USER INDUSTRY, %, GLOBAL, 2022 VS 2029
- Figure 112:
- VOLUME OF POLYOXYMETHYLENE (POM) CONSUMED, TONS, GLOBAL, 2017 - 2029
- Figure 113:
- VALUE OF POLYOXYMETHYLENE (POM) CONSUMED, USD, GLOBAL, 2017 - 2029
- Figure 114:
- VALUE SHARE OF POLYOXYMETHYLENE (POM) CONSUMED BY END USER INDUSTRY, %, GLOBAL, 2022 VS 2029
- Figure 115:
- VOLUME OF STYRENE COPOLYMERS (ABS AND SAN) CONSUMED, TONS, GLOBAL, 2017 - 2029
- Figure 116:
- VALUE OF STYRENE COPOLYMERS (ABS AND SAN) CONSUMED, USD, GLOBAL, 2017 - 2029
- Figure 117:
- VALUE SHARE OF STYRENE COPOLYMERS (ABS AND SAN) CONSUMED BY END USER INDUSTRY, %, GLOBAL, 2022 VS 2029
- Figure 118:
- VOLUME OF ENGINEERING PLASTICS CONSUMED BY REGION, TONS, GLOBAL, 2017 - 2029
- Figure 119:
- VALUE OF ENGINEERING PLASTICS CONSUMED BY REGION, USD, GLOBAL, 2017 - 2029
- Figure 120:
- VOLUME SHARE OF ENGINEERING PLASTICS CONSUMED BY REGION, %, GLOBAL, 2017, 2023, AND 2029
- Figure 121:
- VALUE SHARE OF ENGINEERING PLASTICS CONSUMED BY REGION, %, GLOBAL, 2017, 2023, AND 2029
- Figure 122:
- VOLUME OF ENGINEERING PLASTICS CONSUMED BY COUNTRY, TONS, AFRICA, 2017 - 2029
- Figure 123:
- VALUE OF ENGINEERING PLASTICS CONSUMED BY COUNTRY, USD, AFRICA, 2017 - 2029
- Figure 124:
- VOLUME SHARE OF ENGINEERING PLASTICS CONSUMED BY COUNTRY, %, AFRICA, 2017, 2023, AND 2029
- Figure 125:
- VALUE SHARE OF ENGINEERING PLASTICS CONSUMED BY COUNTRY, %, AFRICA, 2017, 2023, AND 2029
- Figure 126:
- VOLUME OF ENGINEERING PLASTICS CONSUMED, TONS, NIGERIA, 2017 - 2029
- Figure 127:
- VALUE OF ENGINEERING PLASTICS CONSUMED, USD, NIGERIA, 2017 - 2029
- Figure 128:
- VALUE SHARE OF ENGINEERING PLASTICS CONSUMED BY END USER INDUSTRY, %, NIGERIA, 2022 VS 2029
- Figure 129:
- VOLUME OF ENGINEERING PLASTICS CONSUMED, TONS, SOUTH AFRICA, 2017 - 2029
- Figure 130:
- VALUE OF ENGINEERING PLASTICS CONSUMED, USD, SOUTH AFRICA, 2017 - 2029
- Figure 131:
- VALUE SHARE OF ENGINEERING PLASTICS CONSUMED BY END USER INDUSTRY, %, SOUTH AFRICA, 2022 VS 2029
- Figure 132:
- VOLUME OF ENGINEERING PLASTICS CONSUMED, TONS, REST OF AFRICA, 2017 - 2029
- Figure 133:
- VALUE OF ENGINEERING PLASTICS CONSUMED, USD, REST OF AFRICA, 2017 - 2029
- Figure 134:
- VALUE SHARE OF ENGINEERING PLASTICS CONSUMED BY END USER INDUSTRY, %, REST OF AFRICA, 2022 VS 2029
- Figure 135:
- VOLUME OF ENGINEERING PLASTICS CONSUMED BY COUNTRY, TONS, ASIA-PACIFIC, 2017 - 2029
- Figure 136:
- VALUE OF ENGINEERING PLASTICS CONSUMED BY COUNTRY, USD, ASIA-PACIFIC, 2017 - 2029
- Figure 137:
- VOLUME SHARE OF ENGINEERING PLASTICS CONSUMED BY COUNTRY, %, ASIA-PACIFIC, 2017, 2023, AND 2029
- Figure 138:
- VALUE SHARE OF ENGINEERING PLASTICS CONSUMED BY COUNTRY, %, ASIA-PACIFIC, 2017, 2023, AND 2029
- Figure 139:
- VOLUME OF ENGINEERING PLASTICS CONSUMED, TONS, AUSTRALIA, 2017 - 2029
- Figure 140:
- VALUE OF ENGINEERING PLASTICS CONSUMED, USD, AUSTRALIA, 2017 - 2029
- Figure 141:
- VALUE SHARE OF ENGINEERING PLASTICS CONSUMED BY END USER INDUSTRY, %, AUSTRALIA, 2022 VS 2029
- Figure 142:
- VOLUME OF ENGINEERING PLASTICS CONSUMED, TONS, CHINA, 2017 - 2029
- Figure 143:
- VALUE OF ENGINEERING PLASTICS CONSUMED, USD, CHINA, 2017 - 2029
- Figure 144:
- VALUE SHARE OF ENGINEERING PLASTICS CONSUMED BY END USER INDUSTRY, %, CHINA, 2022 VS 2029
- Figure 145:
- VOLUME OF ENGINEERING PLASTICS CONSUMED, TONS, INDIA, 2017 - 2029
- Figure 146:
- VALUE OF ENGINEERING PLASTICS CONSUMED, USD, INDIA, 2017 - 2029
- Figure 147:
- VALUE SHARE OF ENGINEERING PLASTICS CONSUMED BY END USER INDUSTRY, %, INDIA, 2022 VS 2029
- Figure 148:
- VOLUME OF ENGINEERING PLASTICS CONSUMED, TONS, JAPAN, 2017 - 2029
- Figure 149:
- VALUE OF ENGINEERING PLASTICS CONSUMED, USD, JAPAN, 2017 - 2029
- Figure 150:
- VALUE SHARE OF ENGINEERING PLASTICS CONSUMED BY END USER INDUSTRY, %, JAPAN, 2022 VS 2029
- Figure 151:
- VOLUME OF ENGINEERING PLASTICS CONSUMED, TONS, MALAYSIA, 2017 - 2029
- Figure 152:
- VALUE OF ENGINEERING PLASTICS CONSUMED, USD, MALAYSIA, 2017 - 2029
- Figure 153:
- VALUE SHARE OF ENGINEERING PLASTICS CONSUMED BY END USER INDUSTRY, %, MALAYSIA, 2022 VS 2029
- Figure 154:
- VOLUME OF ENGINEERING PLASTICS CONSUMED, TONS, SOUTH KOREA, 2017 - 2029
- Figure 155:
- VALUE OF ENGINEERING PLASTICS CONSUMED, USD, SOUTH KOREA, 2017 - 2029
- Figure 156:
- VALUE SHARE OF ENGINEERING PLASTICS CONSUMED BY END USER INDUSTRY, %, SOUTH KOREA, 2022 VS 2029
- Figure 157:
- VOLUME OF ENGINEERING PLASTICS CONSUMED, TONS, REST OF ASIA-PACIFIC, 2017 - 2029
- Figure 158:
- VALUE OF ENGINEERING PLASTICS CONSUMED, USD, REST OF ASIA-PACIFIC, 2017 - 2029
- Figure 159:
- VALUE SHARE OF ENGINEERING PLASTICS CONSUMED BY END USER INDUSTRY, %, REST OF ASIA-PACIFIC, 2022 VS 2029
- Figure 160:
- VOLUME OF ENGINEERING PLASTICS CONSUMED BY COUNTRY, TONS, EUROPE, 2017 - 2029
- Figure 161:
- VALUE OF ENGINEERING PLASTICS CONSUMED BY COUNTRY, USD, EUROPE, 2017 - 2029
- Figure 162:
- VOLUME SHARE OF ENGINEERING PLASTICS CONSUMED BY COUNTRY, %, EUROPE, 2017, 2023, AND 2029
- Figure 163:
- VALUE SHARE OF ENGINEERING PLASTICS CONSUMED BY COUNTRY, %, EUROPE, 2017, 2023, AND 2029
- Figure 164:
- VOLUME OF ENGINEERING PLASTICS CONSUMED, TONS, FRANCE, 2017 - 2029
- Figure 165:
- VALUE OF ENGINEERING PLASTICS CONSUMED, USD, FRANCE, 2017 - 2029
- Figure 166:
- VALUE SHARE OF ENGINEERING PLASTICS CONSUMED BY END USER INDUSTRY, %, FRANCE, 2022 VS 2029
- Figure 167:
- VOLUME OF ENGINEERING PLASTICS CONSUMED, TONS, GERMANY, 2017 - 2029
- Figure 168:
- VALUE OF ENGINEERING PLASTICS CONSUMED, USD, GERMANY, 2017 - 2029
- Figure 169:
- VALUE SHARE OF ENGINEERING PLASTICS CONSUMED BY END USER INDUSTRY, %, GERMANY, 2022 VS 2029
- Figure 170:
- VOLUME OF ENGINEERING PLASTICS CONSUMED, TONS, ITALY, 2017 - 2029
- Figure 171:
- VALUE OF ENGINEERING PLASTICS CONSUMED, USD, ITALY, 2017 - 2029
- Figure 172:
- VALUE SHARE OF ENGINEERING PLASTICS CONSUMED BY END USER INDUSTRY, %, ITALY, 2022 VS 2029
- Figure 173:
- VOLUME OF ENGINEERING PLASTICS CONSUMED, TONS, RUSSIA, 2017 - 2029
- Figure 174:
- VALUE OF ENGINEERING PLASTICS CONSUMED, USD, RUSSIA, 2017 - 2029
- Figure 175:
- VALUE SHARE OF ENGINEERING PLASTICS CONSUMED BY END USER INDUSTRY, %, RUSSIA, 2022 VS 2029
- Figure 176:
- VOLUME OF ENGINEERING PLASTICS CONSUMED, TONS, UNITED KINGDOM, 2017 - 2029
- Figure 177:
- VALUE OF ENGINEERING PLASTICS CONSUMED, USD, UNITED KINGDOM, 2017 - 2029
- Figure 178:
- VALUE SHARE OF ENGINEERING PLASTICS CONSUMED BY END USER INDUSTRY, %, UNITED KINGDOM, 2022 VS 2029
- Figure 179:
- VOLUME OF ENGINEERING PLASTICS CONSUMED, TONS, REST OF EUROPE, 2017 - 2029
- Figure 180:
- VALUE OF ENGINEERING PLASTICS CONSUMED, USD, REST OF EUROPE, 2017 - 2029
- Figure 181:
- VALUE SHARE OF ENGINEERING PLASTICS CONSUMED BY END USER INDUSTRY, %, REST OF EUROPE, 2022 VS 2029
- Figure 182:
- VOLUME OF ENGINEERING PLASTICS CONSUMED BY COUNTRY, TONS, MIDDLE EAST, 2017 - 2029
- Figure 183:
- VALUE OF ENGINEERING PLASTICS CONSUMED BY COUNTRY, USD, MIDDLE EAST, 2017 - 2029
- Figure 184:
- VOLUME SHARE OF ENGINEERING PLASTICS CONSUMED BY COUNTRY, %, MIDDLE EAST, 2017, 2023, AND 2029
- Figure 185:
- VALUE SHARE OF ENGINEERING PLASTICS CONSUMED BY COUNTRY, %, MIDDLE EAST, 2017, 2023, AND 2029
- Figure 186:
- VOLUME OF ENGINEERING PLASTICS CONSUMED, TONS, SAUDI ARABIA, 2017 - 2029
- Figure 187:
- VALUE OF ENGINEERING PLASTICS CONSUMED, USD, SAUDI ARABIA, 2017 - 2029
- Figure 188:
- VALUE SHARE OF ENGINEERING PLASTICS CONSUMED BY END USER INDUSTRY, %, SAUDI ARABIA, 2022 VS 2029
- Figure 189:
- VOLUME OF ENGINEERING PLASTICS CONSUMED, TONS, UNITED ARAB EMIRATES, 2017 - 2029
- Figure 190:
- VALUE OF ENGINEERING PLASTICS CONSUMED, USD, UNITED ARAB EMIRATES, 2017 - 2029
- Figure 191:
- VALUE SHARE OF ENGINEERING PLASTICS CONSUMED BY END USER INDUSTRY, %, UNITED ARAB EMIRATES, 2022 VS 2029
- Figure 192:
- VOLUME OF ENGINEERING PLASTICS CONSUMED, TONS, REST OF MIDDLE EAST, 2017 - 2029
- Figure 193:
- VALUE OF ENGINEERING PLASTICS CONSUMED, USD, REST OF MIDDLE EAST, 2017 - 2029
- Figure 194:
- VALUE SHARE OF ENGINEERING PLASTICS CONSUMED BY END USER INDUSTRY, %, REST OF MIDDLE EAST, 2022 VS 2029
- Figure 195:
- VOLUME OF ENGINEERING PLASTICS CONSUMED BY COUNTRY, TONS, NORTH AMERICA, 2017 - 2029
- Figure 196:
- VALUE OF ENGINEERING PLASTICS CONSUMED BY COUNTRY, USD, NORTH AMERICA, 2017 - 2029
- Figure 197:
- VOLUME SHARE OF ENGINEERING PLASTICS CONSUMED BY COUNTRY, %, NORTH AMERICA, 2017, 2023, AND 2029
- Figure 198:
- VALUE SHARE OF ENGINEERING PLASTICS CONSUMED BY COUNTRY, %, NORTH AMERICA, 2017, 2023, AND 2029
- Figure 199:
- VOLUME OF ENGINEERING PLASTICS CONSUMED, TONS, CANADA, 2017 - 2029
- Figure 200:
- VALUE OF ENGINEERING PLASTICS CONSUMED, USD, CANADA, 2017 - 2029
- Figure 201:
- VALUE SHARE OF ENGINEERING PLASTICS CONSUMED BY END USER INDUSTRY, %, CANADA, 2022 VS 2029
- Figure 202:
- VOLUME OF ENGINEERING PLASTICS CONSUMED, TONS, MEXICO, 2017 - 2029
- Figure 203:
- VALUE OF ENGINEERING PLASTICS CONSUMED, USD, MEXICO, 2017 - 2029
- Figure 204:
- VALUE SHARE OF ENGINEERING PLASTICS CONSUMED BY END USER INDUSTRY, %, MEXICO, 2022 VS 2029
- Figure 205:
- VOLUME OF ENGINEERING PLASTICS CONSUMED, TONS, UNITED STATES, 2017 - 2029
- Figure 206:
- VALUE OF ENGINEERING PLASTICS CONSUMED, USD, UNITED STATES, 2017 - 2029
- Figure 207:
- VALUE SHARE OF ENGINEERING PLASTICS CONSUMED BY END USER INDUSTRY, %, UNITED STATES, 2022 VS 2029
- Figure 208:
- VOLUME OF ENGINEERING PLASTICS CONSUMED BY COUNTRY, TONS, SOUTH AMERICA, 2017 - 2029
- Figure 209:
- VALUE OF ENGINEERING PLASTICS CONSUMED BY COUNTRY, USD, SOUTH AMERICA, 2017 - 2029
- Figure 210:
- VOLUME SHARE OF ENGINEERING PLASTICS CONSUMED BY COUNTRY, %, SOUTH AMERICA, 2017, 2023, AND 2029
- Figure 211:
- VALUE SHARE OF ENGINEERING PLASTICS CONSUMED BY COUNTRY, %, SOUTH AMERICA, 2017, 2023, AND 2029
- Figure 212:
- VOLUME OF ENGINEERING PLASTICS CONSUMED, TONS, ARGENTINA, 2017 - 2029
- Figure 213:
- VALUE OF ENGINEERING PLASTICS CONSUMED, USD, ARGENTINA, 2017 - 2029
- Figure 214:
- VALUE SHARE OF ENGINEERING PLASTICS CONSUMED BY END USER INDUSTRY, %, ARGENTINA, 2022 VS 2029
- Figure 215:
- VOLUME OF ENGINEERING PLASTICS CONSUMED, TONS, BRAZIL, 2017 - 2029
- Figure 216:
- VALUE OF ENGINEERING PLASTICS CONSUMED, USD, BRAZIL, 2017 - 2029
- Figure 217:
- VALUE SHARE OF ENGINEERING PLASTICS CONSUMED BY END USER INDUSTRY, %, BRAZIL, 2022 VS 2029
- Figure 218:
- VOLUME OF ENGINEERING PLASTICS CONSUMED, TONS, REST OF SOUTH AMERICA, 2017 - 2029
- Figure 219:
- VALUE OF ENGINEERING PLASTICS CONSUMED, USD, REST OF SOUTH AMERICA, 2017 - 2029
- Figure 220:
- VALUE SHARE OF ENGINEERING PLASTICS CONSUMED BY END USER INDUSTRY, %, REST OF SOUTH AMERICA, 2022 VS 2029
- Figure 221:
- MOST ACTIVE COMPANIES BY NUMBER OF STRATEGIC MOVES, GLOBAL, 2019 - 2021
- Figure 222:
- MOST ADOPTED STRATEGIES, COUNT, GLOBAL, 2019 - 2021
- Figure 223:
- PRODUCTION CAPACITY SHARE OF ENGINEERING PLASTICS BY MAJOR PLAYERS, %, GLOBAL, 2022
- Figure 224:
- PRODUCTION CAPACITY SHARE OF FLUOROPOLYMER BY MAJOR PLAYERS, %, GLOBAL, 2022
- Figure 225:
- PRODUCTION CAPACITY SHARE OF LIQUID CRYSTAL POLYMER (LCP) BY MAJOR PLAYERS, %, GLOBAL, 2022
- Figure 226:
- PRODUCTION CAPACITY SHARE OF POLYAMIDE (PA) BY MAJOR PLAYERS, %, GLOBAL, 2022
- Figure 227:
- PRODUCTION CAPACITY SHARE OF POLYBUTYLENE TEREPHTHALATE (PBT) BY MAJOR PLAYERS, %, GLOBAL, 2022
- Figure 228:
- PRODUCTION CAPACITY SHARE OF POLYCARBONATE (PC) BY MAJOR PLAYERS, %, GLOBAL, 2022
- Figure 229:
- PRODUCTION CAPACITY SHARE OF POLYETHER ETHER KETONE (PEEK) BY MAJOR PLAYERS, %, GLOBAL, 2022
- Figure 230:
- PRODUCTION CAPACITY SHARE OF POLYETHYLENE TEREPHTHALATE (PET) BY MAJOR PLAYERS, %, GLOBAL, 2022
- Figure 231:
- PRODUCTION CAPACITY SHARE OF POLYIMIDE (PI) BY MAJOR PLAYERS, %, GLOBAL, 2022
- Figure 232:
- PRODUCTION CAPACITY SHARE OF POLYMETHYL METHACRYLATE (PMMA) BY MAJOR PLAYERS, %, GLOBAL, 2022
- Figure 233:
- PRODUCTION CAPACITY SHARE OF POLYOXYMETHYLENE (POM) BY MAJOR PLAYERS, %, GLOBAL, 2022
- Figure 234:
- PRODUCTION CAPACITY SHARE OF STYRENE COPOLYMERS (ABS AND SAN) BY MAJOR PLAYERS, %, GLOBAL, 2022
Engineering Plastics Industry Segmentation
Aerospace, Automotive, Building and Construction, Electrical and Electronics, Industrial and Machinery, Packaging are covered as segments by End User Industry. Fluoropolymer, Liquid Crystal Polymer (LCP), Polyamide (PA), Polybutylene Terephthalate (PBT), Polycarbonate (PC), Polyether Ether Ketone (PEEK), Polyethylene Terephthalate (PET), Polyimide (PI), Polymethyl Methacrylate (PMMA), Polyoxymethylene (POM), Styrene Copolymers (ABS and SAN) are covered as segments by Resin Type. Africa, Asia-Pacific, Europe, Middle East, North America, South America are covered as segments by Region.| End User Industry | Aerospace | |||
| Automotive | ||||
| Building and Construction | ||||
| Electrical and Electronics | ||||
| Industrial and Machinery | ||||
| Packaging | ||||
| Other End-user Industries | ||||
| Resin Type | Fluoropolymer | By Sub Resin Type | Ethylenetetrafluoroethylene (ETFE) | |
| Fluorinated Ethylene-propylene (FEP) | ||||
| Polytetrafluoroethylene (PTFE) | ||||
| Polyvinylfluoride (PVF) | ||||
| Polyvinylidene Fluoride (PVDF) | ||||
| Other Sub Resin Types | ||||
| Liquid Crystal Polymer (LCP) | ||||
| Polyamide (PA) | By Sub Resin Type | Aramid | ||
| Polyamide (PA) 6 | ||||
| Polyamide (PA) 66 | ||||
| Polyphthalamide | ||||
| Polybutylene Terephthalate (PBT) | ||||
| Polycarbonate (PC) | ||||
| Polyether Ether Ketone (PEEK) | ||||
| Polyethylene Terephthalate (PET) | ||||
| Polyimide (PI) | ||||
| Polymethyl Methacrylate (PMMA) | ||||
| Polyoxymethylene (POM) | ||||
| Styrene Copolymers (ABS and SAN) | ||||
| Region | Africa | By Country | Nigeria | |
| South Africa | ||||
| Rest of Africa | ||||
| Asia-Pacific | By Country | Australia | ||
| China | ||||
| India | ||||
| Japan | ||||
| Malaysia | ||||
| South Korea | ||||
| Rest of Asia-Pacific | ||||
| Europe | By Country | France | ||
| Germany | ||||
| Italy | ||||
| Russia | ||||
| United Kingdom | ||||
| Rest of Europe | ||||
| Middle East | By Country | Saudi Arabia | ||
| United Arab Emirates | ||||
| Rest of Middle East | ||||
| North America | By Country | Canada | ||
| Mexico | ||||
| United States | ||||
| South America | By Country | Argentina | ||
| Brazil | ||||
| Rest of South America | ||||
Need A Different Region or Segment?
Customize Now
Market Definition
- End-user Industry - Packaging, Electrical & Electronics, Automotive, Building & Construction, and Others are the end-user industries considered under the engineering plastics market.
- Resin - Under the scope of the study, consumption of virgin resins like Fluoropolymer, Polycarbonate, Polyethylene Terephthalate, Polybutylene Terephthalate, Polyoxymethylene, Polymethyl Methacrylate, Styrene Copolymers, Liquid Crystal Polymer, Polyether Ether Ketone, Polyimide, and Polyamide in the primary forms are considered. Recycling has been provided separately under its individual chapter.
| Keyword | Definition |
|---|---|
| Acetal | This is a rigid material that has a slippery surface. It can easily withstand wear and tear in abusive work environments. This polymer is used for building applications such as gears, bearings, valve components, etc. |
| Acrylic | This synthetic resin is a derivative of acrylic acid. It forms a smooth surface and is mainly used for various indoor applications. The material can also be used for outdoor applications with a special formulation. |
| Cast film | A cast film is made by depositing a layer of plastic onto a surface then solidifying and removing the film from that surface. The plastic layer can be in molten form, in a solution, or in dispersion. |
| Colorants & Pigments | Colorants & Pigments are additives used to change the color of the plastic. They can be a powder or a resin/color premix. |
| Composite material | A composite material is a material that is produced from two or more constituent materials. These constituent materials have dissimilar chemical or physical properties and are merged to create a material with properties unlike the individual elements. |
| Degree of Polymerization (DP) | The number of monomeric units in a macromolecule, polymer, or oligomer molecule is referred to as the degree of polymerization or DP. Plastics with useful physical properties often have DPs in the thousands. |
| Dispersion | To create a suspension or solution of material in another substance, fine, agglomerated solid particles of one substance are dispersed in a liquid or another substance to form a dispersion. |
| Fiberglass | Fiberglass-reinforced plastic is a material made up of glass fibers embedded in a resin matrix. These materials have high tensile and impact strength. Handrails and platforms are two examples of lightweight structural applications that use standard fiberglass. |
| Fiber-reinforced polymer (FRP) | Fiber-reinforced polymer is a composite material made of a polymer matrix reinforced with fibers. The fibers are usually glass, carbon, aramid, or basalt. |
| Flake | This is a dry, peeled-off piece, usually with an uneven surface, and is the base of cellulosic plastics. |
| Fluoropolymers | This is a fluorocarbon-based polymer with multiple carbon-fluorine bonds. It is characterized by high resistance to solvents, acids, and bases. These materials are tough yet easy to machine. Some of the popular fluoropolymers are PTFE, ETFE, PVDF, PVF, etc. |
| Kevlar | Kevlar is the commonly referred name for aramid fiber, which was initially a Dupont brand for aramid fiber. Any group of lightweight, heat-resistant, solid, synthetic, aromatic polyamide materials that are fashioned into fibers, filaments, or sheets is called aramid fiber. They are classified into Para-aramid and Meta-aramid. |
| Laminate | A structure or surface composed of sequential layers of material bonded under pressure and heat to build up to the desired shape and width. |
| Nylon | They are synthetic fiber-forming polyamides formed into yarns and monofilaments. These fibers possess excellent tensile strength, durability, and elasticity. They have high melting points and can resist chemicals and various liquids. |
| PET preform | A preform is an intermediate product that is subsequently blown into a polyethylene terephthalate (PET) bottle or a container. |
| Plastic compounding | Compounding consists of preparing plastic formulations by mixing and/or blending polymers and additives in a molten state to achieve the desired characteristics. These blends are automatically dosed with fixed setpoints usually through feeders/hoppers. |
| Plastic pellets | Plastic pellets, also known as pre-production pellets or nurdles, are the building blocks for nearly every product made of plastic. |
| Polymerization | It is a chemical reaction of several monomer molecules to form polymer chains that form stable covalent bonds. |
| Styrene Copolymers | A copolymer is a polymer derived from more than one species of monomer, and a styrene copolymer is a chain of polymers consisting of styrene and acrylate. |
| Thermoplastics | Thermoplastics are defined as polymers that become soft material when it is heated and becomes hard when it is cooled. Thermoplastics have wide-ranging properties and can be remolded and recycled without affecting their physical properties. |
| Virgin Plastic | It is a basic form of plastic that has never been used, processed, or developed. It may be considered more valuable than recycled or already used materials. |
Need More Details on Market Definition?
Ask a Question
Research Methodology
Mordor Intelligence follows a four-step methodology in all our reports.
- Step-1: Identify Key Variables: The quantifiable key variables (industry and extraneous) pertaining to the specific product segment and country are selected from a group of relevant variables & factors based on desk research & literature review; along with primary expert inputs. These variables are further confirmed through regression modeling (wherever required).
- Step-2: Build a Market Model: In order to build a robust forecasting methodology, the variables and factors identified in Step-1 are tested against available historical market numbers. Through an iterative process, the variables required for market forecast are set and the model is built on the basis of these variables.
- Step-3: Validate and Finalize: In this important step, all market numbers, variables and analyst calls are validated through an extensive network of primary research experts from the market studied. The respondents are selected across levels and functions to generate a holistic picture of the market studied.
- Step-4: Research Outputs: Syndicated Reports, Custom Consulting Assignments, Databases & Subscription Platforms

Get More Details On Research Methodology
Download PDF


