
Energy Harvesting Systems Market Size and Share
Market Overview
| Study Period | 2020 - 2031 |
|---|---|
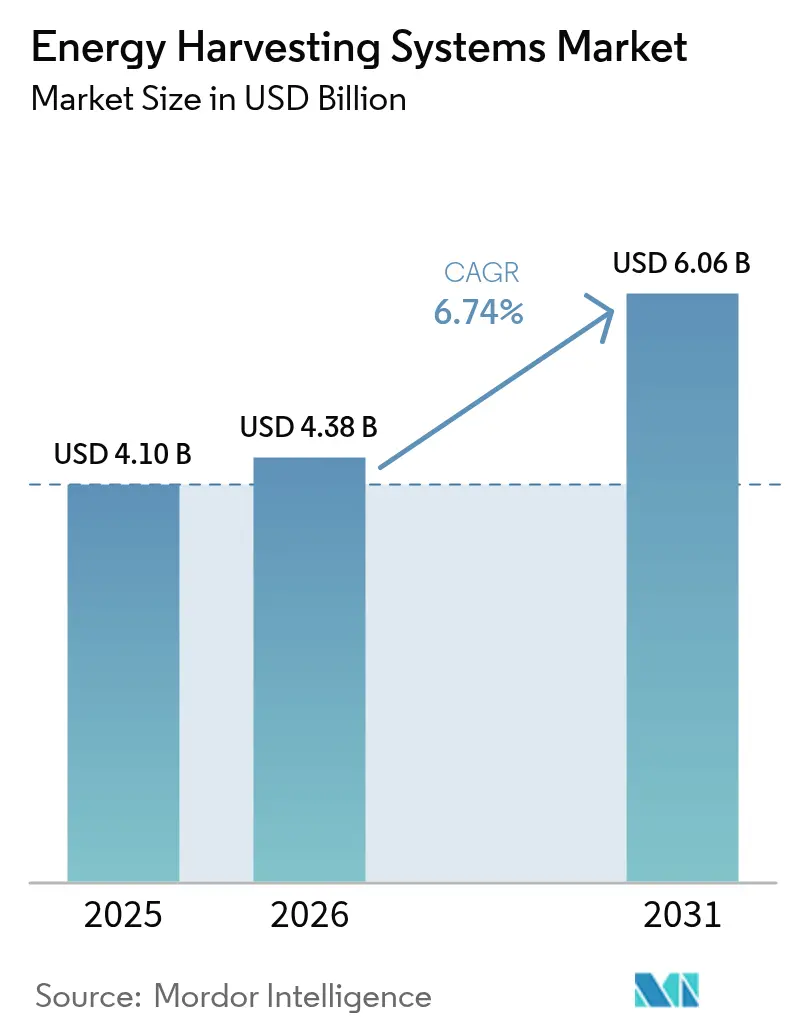
| Market Size (2026) | USD 4.38 Billion |
| Market Size (2031) | USD 6.06 Billion |
| Growth Rate (2026 - 2031) | 6.74 % |
| Fastest Growing Market | Middle East |
| Largest Market | Asia Pacific |
| Market Concentration | Medium |
Major Players *Disclaimer: Major Players sorted in no particular order Image © Mordor Intelligence. Reuse requires attribution under CC BY 4.0. | |
Energy Harvesting Systems Market Analysis by Mordor Intelligence
The energy harvesting systems market size in 2026 is estimated at USD 4.38 billion, growing from 2025 value of USD 4.10 billion with 2031 projections showing USD 6.06 billion, growing at 6.74% CAGR over 2026-2031. Rising demand for battery-free Internet-of-Things (IoT) devices and the spread of ultra-low-power electronics across industrial and consumer environments underpin this growth. Momentum stems from rapid miniaturization in power-management integrated circuits that now squeeze sophisticated regulation functions into sub-millimeter footprints, while policy pressure to cut disposable battery waste reinforces the value proposition for energy harvesting solutions. Developers also benefit from ecosystem partnerships that speed time-to-market for turnkey modules and reference designs, further lifting adoption in smart buildings, factories, and wearables. Together, these forces strengthen the energy harvesting systems market outlook during the current decade.
Key Report Takeaways
- By technology, light-based photovoltaic harvesters led with 41.65% of the energy harvesting systems market share in 2025; RF harvesting is projected to expand at a 10.62% CAGR through 2031.
- By application, building and home automation accounted for 29.55% of the energy harvesting systems market size in 2025, while industrial IoT is set to grow at a 9.62% CAGR to 2031.
- By component, power-management ICs held a 37.40% stake in the energy harvesting systems market share in 2025; energy-harvesting transducers represent the fastest-growing component at a 9.05% CAGR.
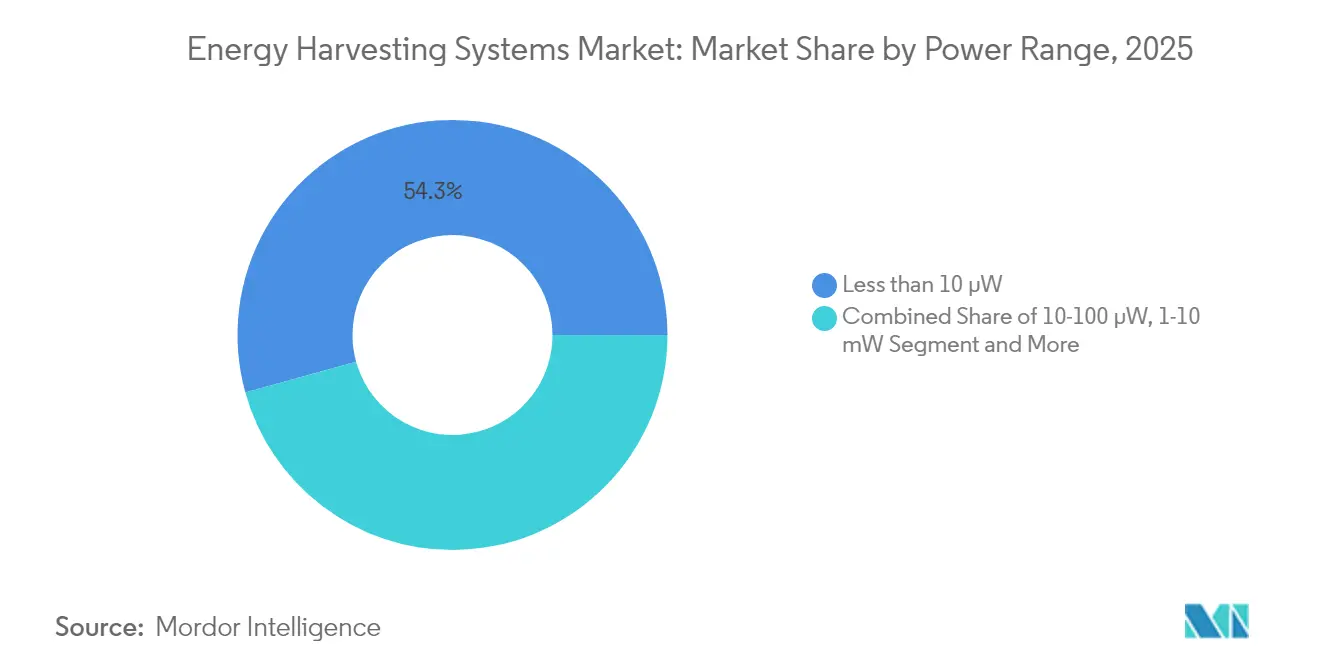
- By power range, the sub-10 µW class commanded 54.30% of shipments in 2025, whereas the 10-100 µW bracket records the highest projected CAGR at 7.62% to 2031.
- By geography, Asia retained 34.70% revenue share in 2025, and the Middle East is positioned for the quickest regional growth at a 8.78% CAGR.
Note: Market size and forecast figures in this report are generated using Mordor Intelligence’s proprietary estimation framework, updated with the latest available data and insights as of 2026.
Market Trends and Insights
Drivers Impact Analysis of Energy Harvesting Systems Market*
| DRIVER | (~) % IMPACT ON CAGR FORECAST | GEOGRAPHIC RELEVANCE | IMPACT TIMELINE |
|---|---|---|---|
| Proliferation of Battery-less IoT Sensor Nodes in Smart Buildings | +2.1% | Europe & North America | Medium term (2-4 years) |
| Mandates for Sustainable Low-Power Automation in APAC Factories | +1.8% | APAC core; spill-over to MEA | Short term (≤ 2 years) |
| Rapid Miniaturization of Ultra-Low-Power MCUs Enabling Sub-µW Thresholds | +1.5% | Global | Long term (≥ 4 years) |
| Growing Deployment of Wireless Condition-Monitoring in Rail & Aviation OEMs | +1.2% | North America & EU | Medium term (2-4 years) |
| Integration of Photovoltaic Harvesters into Wearables & Medical Patches | +0.9% | Global | Long term (≥ 4 years) |
| Smart-City Initiatives and Energy Diversification Mandates in GCC Nations | +0.7% | Middle East (GCC) | Short–Medium term (≤ 4 years) |
| Source: Mordor Intelligence | |||
Proliferation of Battery-less IoT Sensor Nodes in Smart Buildings
The European Union Ecodesign Regulation 2024/1781 obliges commercial properties to use energy-efficient control systems, which pushes building managers toward battery-free wireless sensors Demonstrations in Paris and Oviedo logged 36.8 kW average power savings after integrating solar and RF-powered sensors that communicate occupancy and environmental data. RF harvesters convert 10-50% of ambient energy and more than 70% in tuned indoor zones, keeping sensors operational for the entire building life cycle. Facility owners increasingly weigh total cost of ownership and find that three battery replacement cycles eclipse initial sensor hardware costs, accelerating migration to harvesting solutions. As procurement teams pivot budgets from maintenance to analytics-ready hardware, the energy harvesting systems market gains sustained demand from the commercial real-estate sector.[1]
Mandates for Sustainable Low-Power Automation in APAC Factories
Industrial groups across China, Japan, and South Korea install harvesters to satisfy corporate carbon pledges and cut unscheduled downtime tied to battery swaps. Telefónica Tech rolled out ATEX-certified thermoelectric generators that power vibration nodes in oil and gas refineries where battery access is tightly restricted. Researchers at the Korea Institute of Science and Technology combined thermoelectric and piezoelectric effects in a hybrid harvester that boosts power output by more than 50% for heavy-machinery monitoring. Dense manufacturing ecosystems allow quick feedback loops between pilot deployments and component suppliers, further trimming bill-of-materials cost. As regulatory audits emphasize energy baselines in production plants, executives increasingly standardize harvesting platforms across multiple factory sites, reinforcing regional momentum.
Rapid Miniaturization of Ultra-Low-Power MCUs Enabling Sub-µW Thresholds
STMicroelectronics’ STM32U3 family delivers 117 CoreMark per milliwatt while drawing only 10 µA per MHz in active mode, a benchmark that qualifies even indoor lighting as a reliable energy source. Renesas RA2A2 devices run at 100 µA per MHz and drop to 0.40 µA in standby, integrating power-budget algorithms for energy harvesting nodes. Lower power budgets widen the pool of viable harvester technologies, and higher harvesting conversion ratios now support edge inference workloads. This virtuous cycle reshapes design priorities so that the default bill-of-materials for next-generation IoT boards starts with a harvester and storage element rather than a primary cell, lifting long-term growth for the energy harvesting systems market.[2]
Growing Deployment of Wireless Condition-Monitoring in Rail & Aviation OEMs
European rolling-stock builders mount piezo harvesters on pantographs to feed vibration diagnostics that warn of contact wire fatigue. Aerospace integrators couple flexible piezo films to fuselage panels where flight-induced vibrations generate enough power for autonomous health-monitoring nodes. A prototype quadcopter from the University of Southern Denmark recharges through power lines while inspecting high-voltage cables, removing the downtime linked to battery swaps. Safety regimes in transport sectors justify premium pricing for high-reliability harvesters, and this willingness to pay shortens payback periods for suppliers. As a result, transport OEMs become key reference customers that validate performance claims for emerging harvester materials.
Restraints Impact Analysis of Energy Harvesting Systems Market*
| RESTRAINTS | (~) % IMPACT ON CAGR FORECAST | GEOGRAPHIC RELEVANCE | IMPACT TIMELINE |
|---|---|---|---|
| Low Energy Density of Ambient RF in Rural Installations | -1.4% | Global; acute in rural areas | Short term (≤ 2 years) |
| Absence of Universal Power-Management Standards | -1.1% | Global | Medium term (2-4 years) |
| High Upfront Cost of Hybrid Multi-Source Harvesting Architectures | -0.8% | Global | Short-Medium term (≤ 4 years) |
| Limited Interoperability Between Proprietary RF Harvesting Protocols | -0.6% | Global | Medium term (2-4 years) |
| Source: Mordor Intelligence | |||
Low Energy Density of Ambient RF in Rural Installations
Field trials show that 70% of growers abandon wireless sensor pilots because nodes exhaust batteries faster than expected, a gap magnified where RF density dips below harvestable levels. Agritech integrators now blend small solar tiles with vibration strips on irrigation pumps to hedge against cloudy seasons and weak RF signals. Even so, hybrid designs raise costs and complicate maintenance schedules, delaying wide deployment in cost-sensitive farms. Until rural connectivity infrastructure expands, this restraint caps immediate upside for the energy harvesting systems market in agriculture and environmental monitoring.
Absence of Universal Power-Management Standards
Power-management integrated circuits vary by harvester type and lack harmonized pinouts or firmware interfaces, which forces system integrators to maintain multiple design variants. Although the EU requires USB-C for external power supplies from 2025 onward, no comparable directive covers ambient energy modules. Custom engineering adds weeks to project timelines and inflates non-recurring expenses, discouraging procurement teams that value vendor-agnostic architectures. Standardization efforts under IEEE P2668 remain in early stages, so interoperability challenges will persist through the medium term and temper the pace at which the energy harvesting systems market penetrates multi-vendor IoT platforms.
*Our forecasts treat driver/restraint impacts as directional, not additive. The impact forecasts reflect baseline growth, mix effects, and variable interactions.
Energy Harvesting Systems Market Segment Analysis
By Technology:
RF Harvesting Drives Next-Generation Ambient IoTLight-based photovoltaic harvesters controlled 41.65% of the energy harvesting systems market share in 2025. Superior maturity, low cost per watt, and predictable diurnal energy profiles keep photovoltaics in pole position for building and outdoor installations. RF harvesting, however, posts an 10.62% CAGR to 2031 as dense 5G deployments raise ambient electromagnetic levels that can be scavenged for sensor power. Vibration and electromagnetic harvesters serve machinery where rotational energy is plentiful, while thermal Seebeck devices find niches in automotive exhaust and industrial furnaces. Hybrid architectures that blend multiple modalities deliver continuity during light or motion lulls, appealing to mission-critical use cases. The energy harvesting systems market gains resilience as integrators pair intelligent maximum-power-point tracking with adaptive storage to optimize yield across variable sources.
Hybrid proof points abound. Ambient Photonics records triple the power output in 200 lux compared with legacy cells, unlocking indoor remote controls and keyboards. Meanwhile, the Korea Institute of Science and Technology reports a 50% power bump by merging thermoelectric and piezoelectric channels in a cantilever platform. These advances compress payback periods and extend uptime guarantees, encouraging original-equipment manufacturers to specify multi-source designs in request-for-proposal documents. As RF harvesting efficiency rises and component prices drop, the energy harvesting systems market will witness converged modules that auto-select the most productive source every few milliseconds to sustain load demands.


By Component:
Power Management ICs Enable System IntegrationPower-management ICs captured 37.40% of the energy harvesting systems market size in 2025 by value because every harvester topology requires accurate voltage regulation and storage orchestration. Energy-harvesting transducers exhibit a 9.05% CAGR to 2031 as designers diversify beyond single-source architectures and need specialized conversion layers. Thin-film batteries and supercapacitors buffer intermittent energy streams, while ultra-low-power microcontrollers perform the analytics that justify sensor deployments. STMicroelectronics’ SPV1050 achieves up to 99% conversion efficiency for photovoltaic and thermoelectric inputs, highlighting how sophisticated regulation extends node lifetimes. Asahi Kasei’s AP4413 series integrates cell-balancing and trickle-charge control in a 1.43 mm² die, bringing harvesting solutions to cost-sensitive consumer gadgets.
Industry roadmaps converge on system-on-chip packages that embed harvesting front ends, buck-boost converters, and microcontrollers within a single laminate. This consolidation removes board-level interconnect losses and simplifies certification, expanding addressable use cases from industrial automation to smart toys. Over the forecast window, falling ASPs for integration-ready PMICs will spur volume shipments, further fortifying the energy harvesting systems market.
By Power Range:
Sub-10 µW Segment Dominates Ultra-Low-Power ApplicationsDevices operating below 10 µW represented 54.30% of shipments in 2025, reflecting widespread deployment of duty-cycled sensors that wake only to log temperature or occupancy. A new wave of edge-AI workloads lifts interest in the 10-100 µW band, which is set to grow at 7.62% annually. Above 1 mW sit condition-monitoring systems that sample high-resolution vibration signatures or transmit real-time video in defense settings. Researchers at Daegu Gyeongbuk Institute of Science and Technology unveiled a stretchable piezo film that boosts strain energy conversion by 280×, making sub-µW wearables practical without external batteries. Improvements in energy-aware firmware such as adaptive sampling widen functional envelopes while keeping average power budgets under micro-watt thresholds. Consequently, more designers target the sub-10 µW class, elevating unit volumes and reinforcing its dominance within the energy harvesting systems market.
Over time, machine-learning accelerators with 100 TOPS per watt enable local inference at milliwatt levels, blurring boundaries between the mid-range and high-power brackets. Integrators increasingly design boards with power-scalable domains that run in deep sleep at sub-µW yet spike to tens of milliwatts for short compute bursts. This architectural flexibility maximizes harvested-energy utilization and positions the energy harvesting systems market for cross-vertical expansion.
By Application:
Industrial IoT Accelerates Predictive Maintenance AdoptionIndustrial IoT applications advance at a 9.62% CAGR as operators retrofit rotating equipment with sensors that harvest mechanical or thermal energy, eliminating hazardous battery swaps. Building and home automation retained the largest 2025 share at 29.55% because EU regulations compel energy-efficient control systems. Healthcare wearables rely on flexible photovoltaic and RF harvesters to deliver continuous monitoring without user intervention, while transport sectors embed harvesters in rail tracks and aircraft fuselage for structural health analytics. Telefónica Tech’s ATEX-certified thermogenerators now power wireless nodes in explosive gas zones, highlighting cost avoidance in maintenance downtime.
Consumer electronics vendors adopt photovoltaic cells for remote controls that never need replacement batteries, a selling point tied to sustainability goals. Defense programs specify RF and vibration harvesting for autonomous perimeter sensors whose logistics tail cannot support battery resupply. Agriculture deployments link solar harvesters to soil-moisture probes, though energy scarcity in rural RF bands still curbs uptake. Across these verticals, superior total cost of ownership and regulatory alignment underpin sustained expansion of the energy harvesting systems market.
Geography Analysis
APAC Energy Harvesting Systems Market
Asia held 34.70% of 2025 global revenue, benefiting from China’s immense IoT roll-outs and Japan’s leadership in piezoelectric materials through firms such as TDK Corporation tdk.com. Government-backed smart-city programs from Seoul to Shenzhen subsidize sensor infrastructure, while contract manufacturers in Taiwan and Malaysia offer cost-efficient assembly paths that shorten product cycles. South Korea’s semiconductor ecosystem extends bespoke PMIC fabrication, and Singapore’s logistics parks test large-scale ambient IoT arrays that showcase real-world harvester robustness.
Middle East Energy Harvesting Systems Market
The Middle East records the fastest trajectory at a 8.78% CAGR to 2031. Saudi Arabia’s Vision 2030 positions renewable energy at the center of megacity planning, and indoor navigation beacons at the Al-Haram mosque now trial piezo tile flooring that converts pilgrim footsteps into grid power doi.org. Gulf Cooperation Council utilities integrate photovoltaic harvesters into smart-meter housings to avoid truck rolls for battery service. Israel and the United Arab Emirates anchor regional R&D clusters that pair nano-material labs with venture funds, accelerating commercialization timelines for high-efficiency harvesters.
North America and Europe Energy Harvesting Systems Market
North America and Europe show mature yet solid demand tied to regulatory frameworks that emphasize lifecycle sustainability. The United States Department of Energy proposes stricter standby limits for chargers, nudging appliance makers toward ambient power paths. Germany and the United Kingdom equip factories with vibration harvesters for rotating machinery, citing net present value gains over three to five years. Across these economies, engineering teams now quantify carbon abatement when selecting sensor platforms, a trend that channels steady orders into the energy harvesting systems market even where initial capital outlay is higher.

Regulatory Landscape
Energy-harvesting systems for wireless sensors operate under a mix of radio, building-automation, and sustainability requirements that increasingly intersect at the device level. In the European Union, wireless energy-harvesting IoT nodes that incorporate radios fall under the Radio Equipment Directive (Directive 2014/53/EU). This directive remains consolidated as of May 2026, keeping compliance with essential requirements on spectrum use, electromagnetic compatibility, and safety central to EU market entry.
Standardization and circular-economy guidance are also tightening the design envelope for battery-free nodes. CENELEC published CWA 18095:2024 in April 2024, providing guidelines for recyclability of novel and sustainable energy-harvesting systems and technologies used in IoT and wireless sensor networks, and extending end-of-life considerations to materials used in harvesters and storage components. On the interoperability side, IEEE advanced ambient-power communications with the 802.11bp project authorization in March 2024, while home and building systems can reference ISO/IEC 14543-3-10:2020 for protocols optimized for energy-harvesting devices in home electronic systems.
Value Chain Analysis
The value chain begins with material and device inputs for transducers and storage, moves to semiconductor design and fabrication for power-management ICs and ultra-low-power MCUs, and then shifts to module assembly and system integration into sensors, switches, tags, and gateways. Upstream players include specialized harvester and materials companies, such as printed or organic PV and biofuel-cell developers, as well as component manufacturers for thin-film batteries and supercapacitors. Midstream value is concentrated in PMIC and MCU suppliers that support maximum-power-point tracking, buck-boost conversion, and energy-aware firmware. Downstream, OEMs and integrators package these components into certified devices and deploy them through building-automation and IIoT channels.
Ecosystem programs and alliances increasingly shape design-in and commercialization flows. The Ambient IoT Alliance formed in February 2025, with founding members including Atmosic, Infineon Technologies AG, Intel, PepsiCo, Qualcomm, VusionGroup, and Wiliot, indicates more coordinated efforts around battery-free sensor standards and scalable deployments. Commercial collaborations also connect transducer suppliers to label or tracker makers, including Minew working with Epishine and e-peas on a battery-free Bluetooth asset tracker (June 2025) and Linxens collaborating with Dracula Technologies to integrate LAYER organic photovoltaic modules into smart labels (June 2025), which helps move harvesting from component demos into volume-ready form factors.
Competitive Landscape
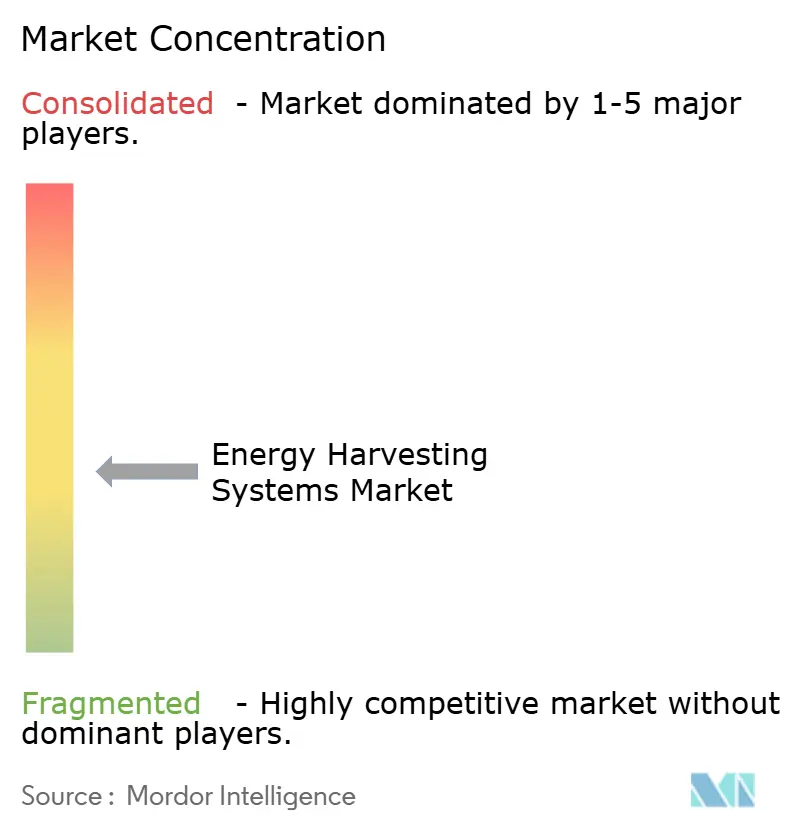
The energy harvesting systems market features moderate fragmentation. Semiconductor majors such as STMicroelectronics, Texas Instruments, and Analog Devices wield manufacturing scale and broad sales channels to bundle harvesters with microcontroller families. Niche innovators like Powercast, EnOcean, and e-peas carve share by offering specialized RF front ends, self-powered Bluetooth Low Energy beacons, and power-management chips tailored for indoor light. Competitive intensity focuses on conversion efficiency, package miniaturization, and design-in support rather than price alone, reflecting mission-critical reliability expectations.
Strategic partnerships continue to shape the field. Powercast and Kyocera AVX pair long-range RF power with super-capacitor storage to extend RFID sensor lifespans. Ambient Photonics aligns with Google to integrate bifacial solar cells into consumer electronics, potentially lifting unit volumes sharply. Emerging entrants explore MXene-polymer composites that promise high capacitance and flexible form factors, while 3D-printed nanocomposites could reduce development iterations. The absence of universal power-management standards leaves room for proprietary ecosystems yet also exposes integrators to vendor lock-in, a duality that savvy suppliers exploit by offering migration pathways between product generations. These dynamics collectively sustain healthy rivalry and innovation across the energy harvesting systems market.
Energy Harvesting Systems Industry Leaders
-
Texas Instruments Inc.
-
Analog Devices Inc.
-
STMicroelectronics N.V.
-
Microchip Technology Inc.
-
TDK Corporation (InvenSense)
- *Disclaimer: Major Players sorted in no particular order
Energy Harvesting Systems Market Companies Covered in this Report
- Microchip Technology Inc.
- STMicroelectronics N.V.
- Texas Instruments Incorporated
- Analog Devices Inc.
- Renesas Electronics Corporation
- NXP Semiconductors N.V.
- onsemi (ON Semiconductor Corp.)
- TDK Corporation (InvenSense)
- Powercast Corporation
- Cymbet Corporation
- EnOcean GmbH
- e-peas S.A.
- ABB Ltd.
- Advanced Linear Devices Inc.
- Cap-XX Limited
- Fujitsu Components America Inc.
- G24 Power Ltd.
- Drayson Technologies Ltd.
- Piezo.com (Mide Technology)
- LORD MicroStrain (Parker Hannifin)
Market Opportunities and Future Outlook
A primary whitespace remains in interoperability-first, battery-free deployments that reduce custom integration across multi-vendor IoT stacks. Without universal power-management standards, engineering teams often maintain multiple design variants, so opportunities cluster around reference designs and platforms that align connectivity and power subsystems. This includes Zigbee Green Power updates from the Connectivity Standards Alliance, which support native energy-harvesting integration within the Zigbee mesh stack. The Ambient IoT Alliance formed in February 2025, bringing together semiconductor, connectivity, and end-user members, also provides a visible mechanism for harmonizing requirements in high-density use cases such as retail and logistics, where battery replacement labor tends to dominate total cost of ownership.
Lifecycle sustainability is increasingly becoming a procurement filter, creating room for suppliers that can document end-of-life pathways alongside performance. CENELEC CWA 18095:2024 adds practical guidance on recyclability and recovery of materials used in energy-harvesting wireless sensor nodes, supporting product roadmaps that combine maintenance-free operation with circular-economy claims. In parallel, higher integration is showing up in industry roadmaps that consolidate harvesting front ends, buck-boost conversion, and control into more integrated PMIC and SoC architectures, aligning with the demand for smaller footprints in smart-building sensors, wearables, and smart labels; commercial partnerships around light-powered Bluetooth tags and battery-free trackers (for example, Paragon ID with Dracula Technologies and Minew with Epishine and e-peas in 2025) illustrate where scale-up activity is already underway.
Recent Industry Developments in Energy Harvesting Systems Market
- April 2026: STMicroelectronics introduced BrightSense image sensors (VD55G4 and VD65G4) designed for ultralow-power, always-on vision in personal electronics. The positioning explicitly supports operation from batteries or energy harvesting systems, which broadens the addressable sensor-node set for ambient-powered edge sensing in wearables, smart building devices, and compact industrial monitors.
- December 2025: Paragon ID and Dracula Technologies expanded their partnership with a multi-year order to scale industrial deployment of XgenTag-L, a battery-free light-powered Bluetooth tag. The move links printed/organic photovoltaic supply with tag manufacturing at larger volumes, reinforcing energy-harvesting adoption in traceability and asset visibility workflows where battery maintenance is a cost and sustainability constraint.
- April 2024: CENELEC published CWA 18095:2024, providing guidelines for the recyclability of novel and sustainable energy-harvesting systems used in IoT and wireless sensor networks. By formalizing end-of-life considerations for harvesters and associated components, the agreement strengthens procurement confidence for large sensor rollouts that must align with circular-economy and waste-reduction objectives.
Energy Harvesting Systems Market Report Scope and Research Methodology
Market Definition and Coverage
This market covers revenue from energy harvesting systems and key supporting parts that capture small amounts of ambient energy (light, vibration, thermal, and RF) and convert it into usable electrical power for low power devices.
Scope exclusions: It excludes bulk renewable power generation equipment and grid scale storage, and it also excludes conventional primary batteries when they are sold without an energy harvesting function.
Segments Covered in This Report
- By Technology
- Light (Solar/Photovoltaic) Energy Harvesting
- Vibration (Piezoelectric and Electromagnetic) Energy Harvesting
- Thermal (Seebeck / Thermoelectric) Energy Harvesting
- RF (Radio-Frequency) Energy Harvesting
- Hybrid / Multi-Source Energy Harvesting
- By Component
- Energy-Harvesting Transducers
- Power-Management ICs
- Energy-Storage Units (Thin-Film Batteries, Supercapacitors)
- Ultra-Low-Power Sensors and MCUs
- By Power Range
- Less than 10 micro W
- 10-100 micro W
- 100 micro W-1 mW
- 1-10 mW
- Greater than 10 mW
- By Application
- Consumer Electronics
- Building and Home Automation
- Industrial IoT and Automation
- Transportation
- Automotive
- Rail
- Aviation
- Healthcare and Wearables
- Defense and Security
- Agriculture and Environmental Monitoring
- By Geography
- North America
- United States
- Canada
- Mexico
- Europe
- Germany
- United Kingdom
- France
- Italy
- Spain
- Nordics (Sweden, Norway, Denmark, Finland)
- Benelux (Belgium, Netherlands, Luxembourg)
- Asia-Pacific
- China
- Japan
- India
- South Korea
- ASEAN (Singapore, Malaysia, Thailand, Indonesia, Philippines, Vietnam)
- South America
- Brazil
- Argentina
- Middle East
- Saudi Arabia
- United Arab Emirates
- Israel
- Turkey
- Africa
- South Africa
- Nigeria
- Kenya
- North America
Data Sources, Market Sizing, and Validation
Desk Research
Desk research was used to set the factual backbone of the model and to keep assumptions realistic across regions. We relied on public sources such as US DOE publications, International Energy Agency materials, NIST references, IEEE and other peer reviewed journals, and customs and trade statistics where available for relevant electronic components.
Along with these, we reviewed company annual reports, investor presentations, product brochures, and standards notes to understand where energy harvesting is being designed in (for example, wireless sensors and wearables). For cross checks on company revenue exposure and product footprints, we also used paid subscriptions focused on company financials, news and financials, and patent databases. The desk sources listed here are illustrative only, and many other public and paid references were used for collection, validation, and clarification.
Primary Interviews and Surveys
Primary work focused on validating where systems are actually shipping and how pricing behaves when designs move from pilots to scaled deployments. We spoke with a mix of component makers, module suppliers, device OEMs, and system integrators across major regions, and we used those inputs to confirm adoption rates, typical bill of material splits, and the practical cutoffs for what is counted as an energy harvesting system.
Distribution of primary research fieldwork respondents
| Company type | Respondent position | Region |
|---|---|---|
| Top tier: 31% | CXOs: 13% | APAC: 44% |
| Mid tier: 55% | Functional/Unit leaders: 43% | EMEA: 29% |
| Smaller Players: 14% | Managers: 44% | Americas: 27% |
Market-Sizing & Forecasting
Sizing starts with a top-down build that reconstructs the addressable demand pool from end use device adoption and the share of those devices that can realistically shift to harvested power. Those totals are then translated into value using system level pricing. Outputs were checked with selective bottom-up approximations, such as sampled ASP times volume for common module types, channel checks on design wins, and supplier revenue splits, which helped correct for over-counting across components.
Key inputs used in the model include the installed base and shipment outlook of wireless sensor nodes and low power IoT devices, penetration of battery-free or battery-assisted designs, average power range mix (for example, sub-10 uW versus 10-100 uW classes), technology mix across light, vibration, thermal, and RF, and the pricing progression of power management ICs and integrated modules. When data was thin for smaller applications, we filled gaps using proxy adoption rates and then re-tested those proxies in follow-up calls so the final totals stayed consistent by region and by use case.
For forecasting, scenario analysis was used because adoption depends heavily on design cycles and policy and sustainability pushes. The scenarios were anchored to a consensus range gathered from expert conversations. Each scenario was translated into yearly penetration curves and price curves, and the final forecast was taken as the most likely pathway after cross-checking with device roadmap timing and manufacturing scale-up expectations.
Data Validation & Update Cycle
Validation was done through several passes of variance checks. We compared model outputs with independent signals such as component shipment trends, patent activity direction, and expected attach rates in target devices. Large jumps were flagged, re-examined for unit or currency issues, and then sent back for analyst review before sign-off.
The study is refreshed on an annual cycle, and interim updates are made when material events affect demand or pricing, such as step-changes in PMIC integration or major regulatory actions tied to battery waste. Before delivery, a final review is performed so the latest public data and any fresh primary feedback are reflected in the numbers clients see.
Mordor Intelligence's Energy Harvesting System Market Size Compared Against Other Published Estimates
Published market sizes for energy harvesting systems can look far apart because researchers do not always count the same things, and they also anchor to different years and pricing bases. The biggest swings usually come from whether the estimate counts only complete systems or also includes adjacent component revenue, and from how fast adoption is assumed to scale across IoT, building automation, industrial sensing, and wearables.
In our checks, the widest gaps were tied to scope and measurement choices, especially around whether power management and storage elements are counted only when sold as part of an energy harvesting system, and how the power-range mix is treated when converting units to dollars. Some estimates also apply aggressive long-range growth curves without re-testing penetration with engineering and procurement voices, while others use older FX timing and do not refresh ASP erosion assumptions frequently, which can distort the current-year value used by buyers and planners.
Benchmark comparison
| Source | Market Size | Gaps in Research Methodology |
|---|---|---|
| Mordor Intelligence | USD 4.38 B (2026) | |
| Global Consultancy A | USD 0.78 B (2026) | Often framed closer to a modules and devices revenue view for low power electronics, with narrower inclusion of supporting components and tighter end-use coverage, which keeps the 2026 value materially smaller. |
| Industry Publisher B | USD 0.74 B (2026) | Typically applies a more restrictive definition that can exclude broader system BOM elements like storage and power conditioning when not sold as an integrated kit, and it may use different currency timing and ASP decline curves. |
The table shows that most of the spread comes from what is counted as a monetized system versus an enabling component stack, plus how pricing is carried forward year to year. By counting transducers, PMICs, and storage only when they are linked to an energy harvesting use case and then re-validating penetration and price steps with repeated expert checks, the larger 2026 total is explained, a consistency rule applied by Mordor Intelligence.
Key Questions Answered in the Report
What is the current size of the energy harvesting systems market?
The energy harvesting systems market size stands at USD 4.38 billion in 2026 and is projected to reach USD 6.06 billion by 2031.
Which technology holds the largest share of the energy harvesting systems market?
Light-based photovoltaic harvesting leads with 41.65% market share in 2025.
Which application segment is growing the fastest?
Industrial IoT and automation is advancing at a 9.62% CAGR through 2031 due to predictive maintenance deployments.
Why is the Middle East an attractive region for suppliers?
Gulf smart-city programs and renewable-energy mandates push demand, driving a 8.78% CAGR for the regional market.
What is the main restraint slowing adoption?
The absence of universal power-management standards creates integration complexity and hampers multi-vendor interoperability.
How are power-management ICs influencing design choices?
High-efficiency PMICs reduce conversion losses and merge harvesting, regulation, and processing into single chips, cutting cost and board area for new products.