
Energy Engineering Services Outsourcing (ESO) Market Size and Share
Market Overview
| Study Period | 2021 - 2031 |
|---|---|
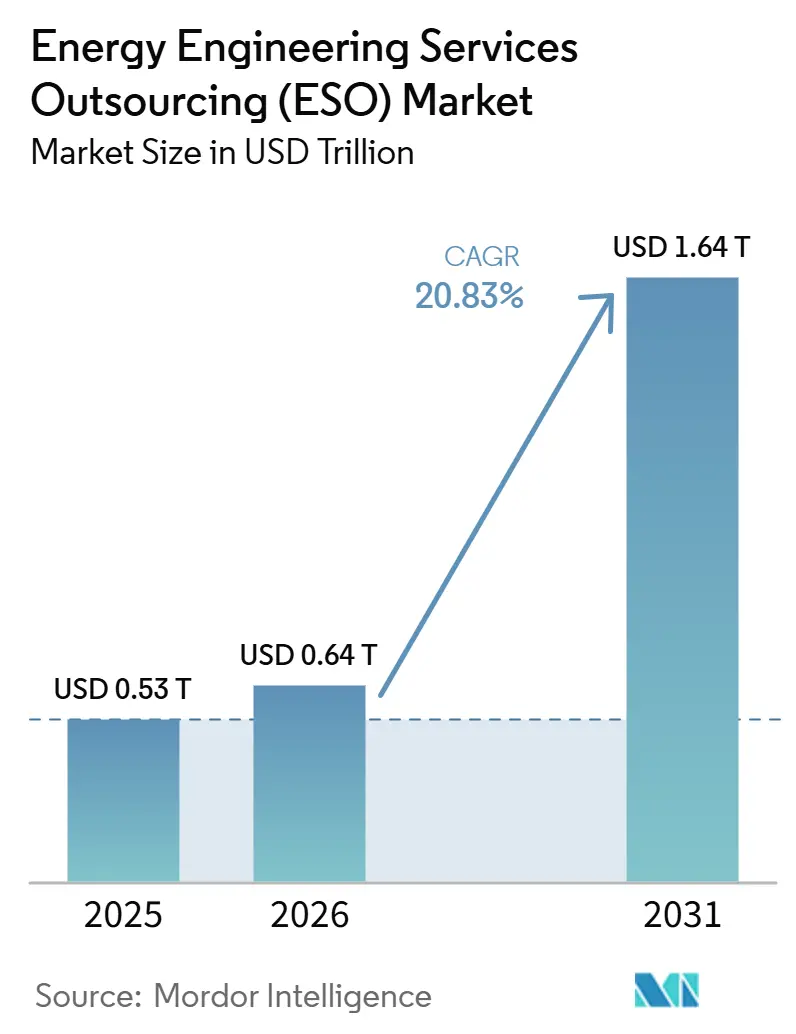
| Market Size (2026) | USD 0.64 Trillion |
| Market Size (2031) | USD 1.64 Trillion |
| Growth Rate (2026 - 2031) | 20.83 % |
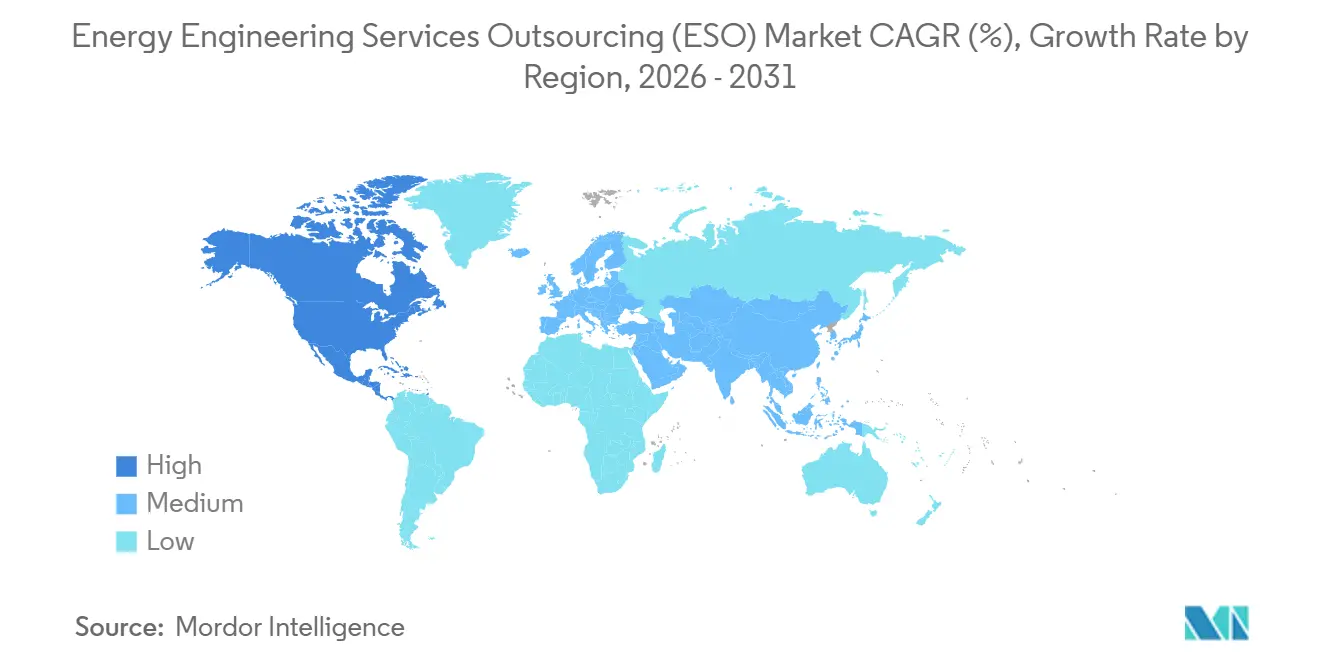
| Fastest Growing Market | North America |
| Largest Market | Asia Pacific |
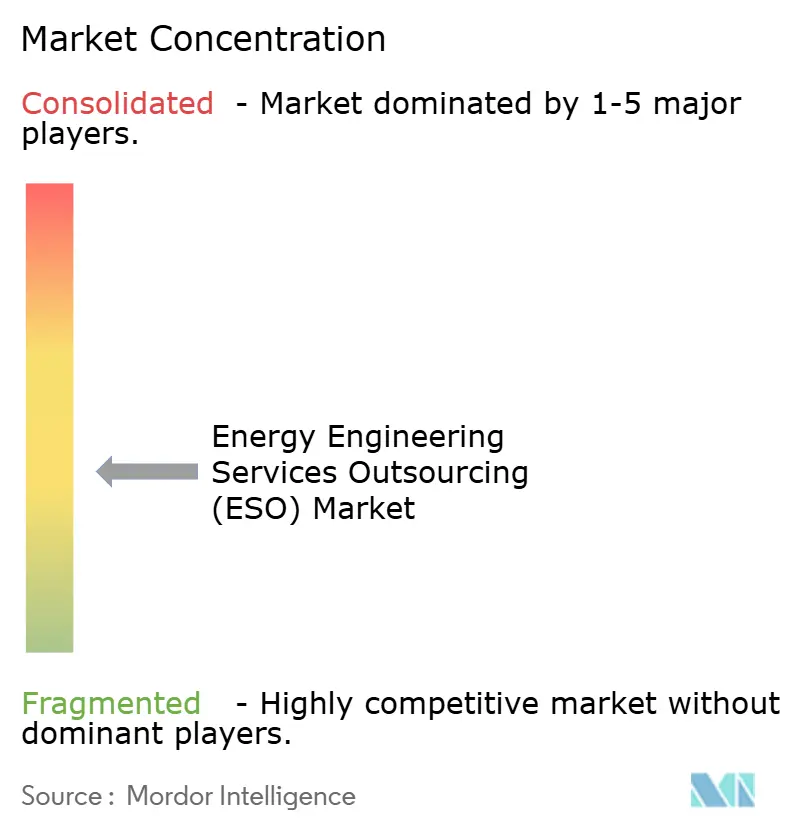
| Market Concentration | Medium |
Major Players *Disclaimer: Major Players sorted in no particular order Image © Mordor Intelligence. Reuse requires attribution under CC BY 4.0. | |
Energy Engineering Services Outsourcing (ESO) Market Analysis by Mordor Intelligence
The Energy Engineering Services Outsourcing Market size is expected to grow from USD 0.53 trillion in 2025 to USD 0.64 trillion in 2026 and is forecast to reach USD 1.64 trillion by 2031 at 20.83% CAGR over 2026-2031. Escalating decarbonization mandates, rising cost pressure on asset owners, and wider adoption of cloud-based design platforms are shifting engineering budgets toward specialist vendors rather than large in-house teams. Hydrogen-ready pipeline retrofits, subsea HVDC cables for offshore wind clusters, and carbon-capture upgrades on legacy power plants each require multidisciplinary skills that utilities rarely maintain in-house. India-based global capability centers provide round-the-clock drafting, instrumentation, and process simulations at labor rates approximately one-third of those in Houston or Aberdeen, making location-agnostic talent pools a structural competitive advantage. At the same time, the Inflation Reduction Act and similar fiscal incentives in Europe and Asia are supporting thousands of megawatts of renewable projects, each requiring front-end studies, environmental filings, and commissioning support that feed directly into the energy engineering services outsourcing market. Market participants therefore view engineering spend not as discretionary overhead but as an enabler of schedule certainty and regulatory compliance.
Key Report Takeaways
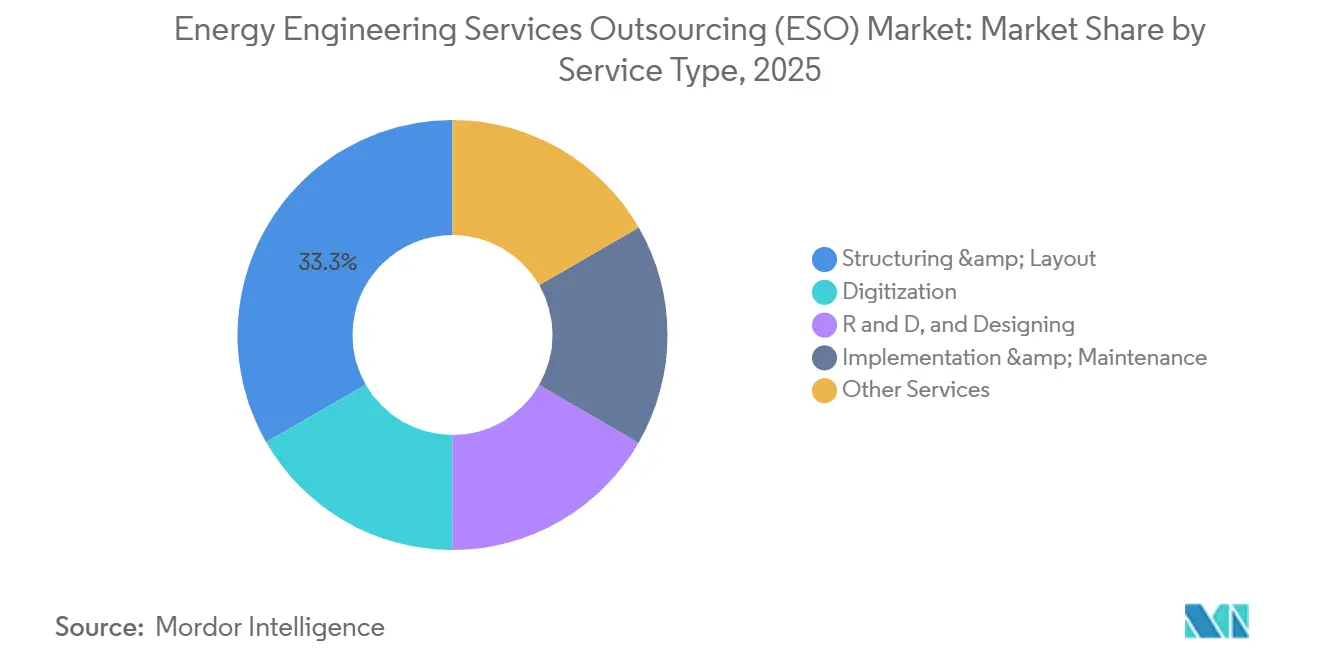
- By service type, Structuring and Layout accounted for 33.3% of the Energy Engineering Services Outsourcing market share in 2025, while Digitization is projected to grow at a CAGR of 25.6% through 2031.
- By deployment model, Onshore projects represented 61.1% of the Energy Engineering Services Outsourcing market size in 2025, and Offshore projects are expected to expand at a CAGR of 22.7% through 2031.
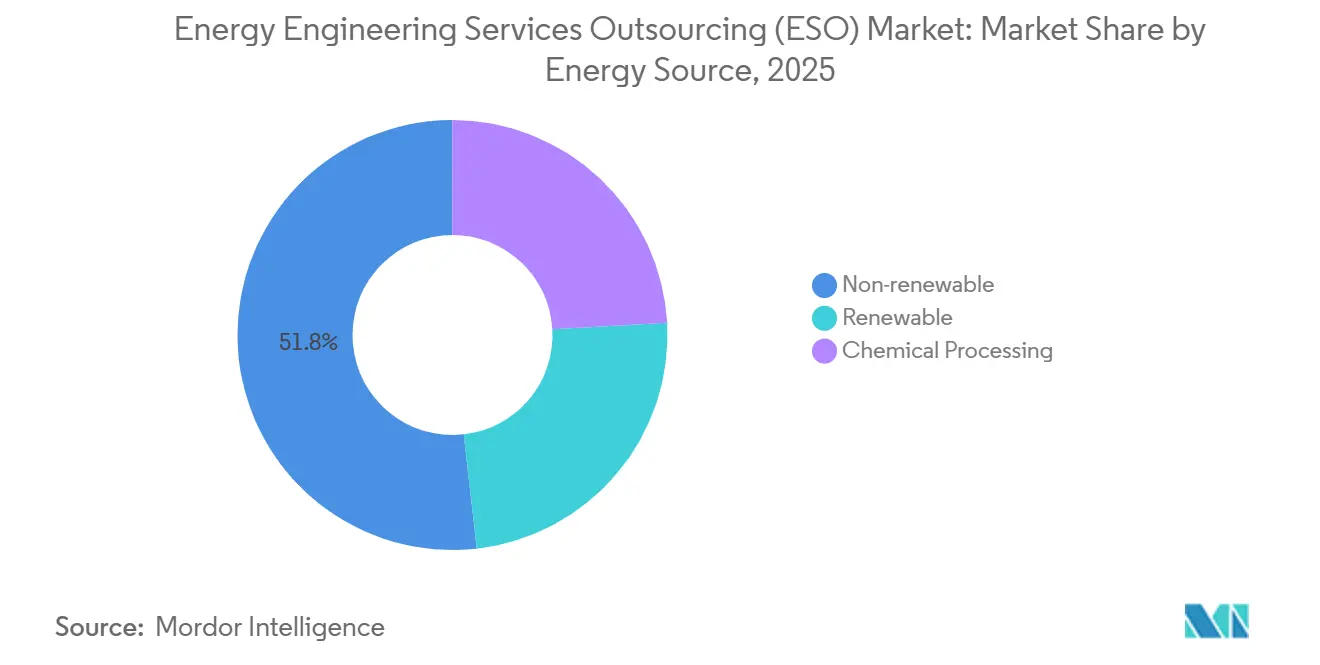
- By energy source, Non-renewable facilities held 51.8% of 2025 revenue, while Renewable outsourcing demand is forecast to grow at a CAGR of 23.3% between 2026 and 2031.
- By geography, Asia-Pacific led with a 43.4% share of 2025 revenue, and North America is the fastest-growing region at a CAGR of 24.9% over the same forecast period.
Note: Market size and forecast figures in this report are generated using Mordor Intelligence’s proprietary estimation framework, updated with the latest available data and insights as of January 2026.
Market Trends and Insights
Drivers Impact Analysis of Energy Engineering Services Outsourcing (ESO) Market*
| Driver | (~) % Impact on CAGR Forecast | Geographic Relevance | Impact Timeline |
|---|---|---|---|
| Decarbonization mandates & renewable integration | +3.80% | Global, with EU and North America leading policy enforcement | Medium term (2-4 years) |
| Cost pressure & need for operational efficiency | +3.20% | APAC core (India captive centers), spill-over to MEA | Short term (≤ 2 years) |
| Digitalization & Industry 4.0 adoption | +4.10% | Global, concentrated in North America and Europe | Medium term (2-4 years) |
| Expansion of LNG & gas infrastructure | +2.90% | North America (U.S. Gulf Coast), Middle East, APAC | Long term (≥ 4 years) |
| Subsea power-cable engineering for offshore wind clusters | +3.50% | Europe (North Sea, Baltic), APAC (China, Taiwan) | Medium term (2-4 years) |
| Hydrogen-ready pipeline retrofit demand | +2.70% | Europe (Germany, Netherlands, Denmark), Middle East | Long term (≥ 4 years) |
| Source: Mordor Intelligence | |||
Decarbonization Mandates Drive Renewable Integration Complexity
Binding climate legislation, such as the European Union Fit for 55 package and the United States Inflation Reduction Act, requires utilities to integrate large volumes of intermittent renewables within compressed timelines.[1]European Commission, “Fit for 55 Package,” europa.eu As grid operators lack in-house skills in power-electronics modeling, harmonics management, and hybrid storage design, they increasingly contract specialist engineering partners to co-design inverter specifications, dynamic line-rating strategies, and advanced energy-management algorithms. The complexity is magnified by the need to retrofit aging substations while maintaining reliability indices. Outsourcing providers now bundle grid-code compliance, protection studies, and commissioning services, creating a one-stop solution that accelerates project approval and reduces schedule risk. Demand is strongest in mature markets where 2030 net-zero targets trigger multibillion-dollar transmission reinforcements and flexible-resource additions.
Cost Pressures Accelerate Operational Efficiency Through Outsourcing
Labor arbitrage remains a key driver of the energy engineering services outsourcing market. In 2025, India hosted 77 energy-focused global capability centers employing approximately 50,000 professionals. Chevron's USD 1 billion Bengaluru hub alone plans to add 600 engineers focused on front-end design for upstream assets. Comparable roles in Houston can cost three times Indian salaries, allowing operators to redeploy domestic staff toward strategic planning while offshore teams working across time zones handle piping isometrics, loop diagrams, and quantity take-offs. Shell's India workforce exceeded 13,000 in 2025, providing LNG terminal engineering and digital support services that reduce cycle times and support margins. Attrition remains a challenge; however, remote tools, standardized design libraries, and automated quality checks help keep unit costs down even as salary inflation rises.
Digital Transformation Enables Advanced Engineering Service Models
Industry 4.0 technologies, including digital twins, AI-driven generative design, 5G-enabled edge analytics, and cloud collaboration, are reshaping how engineering knowledge is created and monetized. Virtual replicas of turbines, substations, and LNG trains enable continuous simulation of operating scenarios, allowing providers to transition from episodic EPC scopes to subscription-based performance services. Real-time condition data fed into predictive models can reduce unplanned downtime by up to 30% and extend asset life. AI optimizers reduce line-route design iterations by 40%, freeing senior engineers for higher-value conceptual work. Remote collaboration removes geographic constraints, enabling domain experts in Houston, Frankfurt, and Bengaluru to resolve design-interface conflicts within shared 3D environments. Providers that embed these tools report win rates 15 percentage points higher in RFPs that score digital maturity.
LNG Infrastructure Expansion Creates Specialized Engineering Demand
More than 170 Mtpa of new LNG export capacity is under construction or sanctioned for startup before 2030, led by projects in Qatar, the United States, and Mozambique.[2]International Energy Agency, “Global LNG Outlook 2025,” iea.org Each terminal projects require cryogenic piping layouts, boil-off gas handling studies, and rigorous hazard and operability analyses that exceed the capabilities of most owner teams. Engineering firms with established FLNG and modular mid-scale project references now command premium day rates. On the downstream side, distributed LNG micro-plants serving island grids and remote mines are creating new micro-FEED opportunities for smaller, specialized consultants.
Restraints Impact Analysis of Energy Engineering Services Outsourcing (ESO) Market*
| Restraint | (~) % Impact on CAGR Forecast | Geographic Relevance | Impact Timeline |
|---|---|---|---|
| Cyber-security & IP concerns in outsourcing | -1.80% | Global, heightened in North America and Europe | Short term (≤ 2 years) |
| Oil-price volatility dampening CAPEX | -2.40% | Global, concentrated in oil-dependent economies | Short term (≤ 2 years) |
| Shortage of niche renewable domain experts | -1.30% | Global, acute in Europe and North America | Medium term (2-4 years) |
| Geopolitical data-transfer restrictions | -0.90% | EU, China, Russia, with spill-over to cross-border projects | Medium term (2-4 years) |
| Source: Mordor Intelligence | |||
Cyber-security Concerns Limit Critical Infrastructure Outsourcing
The 2024 revision of NIST SP 800-82 elevated security baselines for industrial control systems and tightened third-party access provisions.[3]National Institute of Standards and Technology, “SP 800-82 Rev 3 Guide to Industrial Control Systems Security,” nist.gov Utilities now conduct more stringent vendor risk assessments covering supply chain pedigree, zero-trust architectures, and software bill-of-materials disclosure. Intellectual property leakage concerns are significant in advanced control algorithms that underpin renewable curtailment minimization and voltage-ride-through compliance. Some critical national infrastructure owners require onshore engineering centers even at 25-30% cost premiums, which delays award timelines and limits provider pools. Compliance with NERC CIP, ISO 27001, and regional privacy statutes increases transaction costs and slows cross-border file exchange, particularly for multi-cloud model hosting.
Oil Price Volatility Constrains Energy CAPEX Investment
Brent crude is projected to average USD 56 per barrel in 2026, down 19% year on year. In response, Equinor plans to reduce investment by USD 4 billion across 2026-2027. Chevron has revised its 2026 capital expenditure to USD 18–19 billion with reduced exploration budgets, and EOG Resources has indicated flat production guidance while prioritizing free cash flow. Engineering vendors dependent on drilling projects may need to adjust staffing levels, shift to reimbursable contracts, and pursue renewables work to offset cyclical downturns.
*Our forecasts treat driver/restraint impacts as directional, not additive. The impact forecasts reflect baseline growth, mix effects, and variable interactions.
Energy Engineering Services Outsourcing (ESO) Market Segment Analysis
By Service Type:
Digitization Gains MomentumDigitization bookings are forecast to expand at a 25.6% CAGR between 2026 and 2031, outpacing the overall energy engineering services outsourcing market. In 2025, Structuring and Layout dominated with a 33.3% revenue share, as LNG trains, offshore platforms, and utility-scale solar farms required intensive three-dimensional modeling and plot-plan optimization. Digitization now incorporates cloud collaboration, generative design, and predictive analytics into these traditional scopes, reducing change-order cycles and lowering installed costs. For instance, Siemens digital twins prevented 15% of potential clashes before fabrication, while Tata Consultancy Services integrated smart-meter datasets into AI models that helped defer hundreds of millions of USD in distribution upgrades. The energy engineering services outsourcing market size tied to digitization is therefore on a trajectory to match traditional drafting revenue by 2029. Market share metrics will continue to shift toward software-heavy scopes as owners demand faster iterations and lower rework.
R&D and designing services benefit when project developers require feasibility studies and novel material selection. However, they rely on scarce senior talent, so growth remains just below that of digitization. Implementation and maintenance activities scale with the installed asset base, contributing steady fee streams but at a slower growth rate. Environmental and decommissioning services round out the portfolio and are rising in line with stricter emissions regulations. Across these workstreams, energy engineering services outsourcing market dynamics favor vendors that combine domain engineers with data scientists, shortening the path from conceptual model to execution.


By Deployment Model:
Offshore Complexity Commands PremiumsOffshore scopes are projected to grow at a 22.7% CAGR through 2031, outpacing the onshore segment, which accounted for 61.1% of 2025 spending. Floating wind systems in waters deeper than 200 m, subsea HVDC converters, and deepwater oil tie-backs each require hydrodynamic modeling, mooring analysis, and corrosion studies that support rate premiums. Equinor's Hywind Tampen recorded capacity factors above 50%, but only after extensive station-keeping simulations and dynamic-cable fatigue testing. The energy engineering services outsourcing market size for offshore scopes could surpass USD 600 billion by 2031 if announced lease rounds in California, Japan, and South Korea proceed as planned. Onshore solar EPC, gas-fired combined-cycle projects, and substations remain attractive in emerging markets where build-out volumes are high, though margins face pressure from software automation. Energy engineering services outsourcing market participants therefore balance their portfolios: offshore contracts deliver higher profitability but longer bid cycles, while onshore work maintains utilization rates.
By Energy Source:
Renewables Outpace but Oil and Gas Retain ScaleRenewable assignments are projected to grow at a 23.3% CAGR, yet non-renewable infrastructure still represented 51.8% of 2025 revenue. Owners of LNG trains and petrochemical complexes rely on process safety reviews and cryogenic piping expertise that take decades to develop, giving traditional engineering firms a durable niche. The energy engineering services outsourcing market for solar, onshore wind, and battery storage projects is growing rapidly, driven by emerging-market auctions and corporate power-purchase agreements. International Energy Agency data show annual renewable additions exceeding 500 GW, with solar accounting for approximately 60% of that build. Non-renewables will remain relevant for LNG, refinery revamps, and carbon capture on steel or cement plants until policy penalties make unabated emissions uneconomic.
By Sourcing Model (Qualitative Analysis Only)
Captive outsourcing involves establishing wholly owned engineering centers that deliver services exclusively to the parent organization, ensuring greater control over intellectual property, engineering quality, and data security. This model is widely adopted by global energy companies and EPC firms to support engineering design, digitalization, and R&D while optimizing long-term operational costs. For example, Shell, Schneider Electric, and Siemens Energy operate captive engineering centers in countries such as India to support global engineering and energy transition projects, reflecting the growing adoption of this sourcing model.
Geography Analysis
APAC Energy Engineering Services Outsourcing (ESO) Market
Asia-Pacific accounted for 43.4% of 2025 revenue, supported by India's large engineering talent pool, China's offshore wind expansion, and Southeast Asia's LNG import plans. The energy engineering services outsourcing market continues to benefit from wage differences, with average Indian engineering salaries at approximately 35% of U.S. equivalents. China's offshore capacity increased sharply in 2025 and targets at least 120 GW by 2030, sustaining demand for blade design and subsea cable routing. Data sovereignty laws may limit some cross-border collaboration, though near-shore service centers in Malaysia and the Philippines are emerging as alternatives for Western clients.
North America Energy Engineering Services Outsourcing (ESO) Market
North America is projected to grow at a 24.9% CAGR through 2031, driven by renewables tax credits, LNG export terminals, and hydrogen hubs supported by U.S. federal grants. Projects such as Calcasieu Pass 2, Golden Pass LNG, and the Alaska LNG venture collectively exceed USD 70 billion in capital expenditure and support multi-year engineering workstreams. Offshore wind prospects in the New York Bight and California are substantial, though lease moratoriums and procurement cost inflation present risks.
Europe Energy Engineering Services Outsourcing (ESO) Market
Europe's offshore wind market remains a key segment despite permitting timelines of five to seven years. Cable awards to NKT and Prysmian confirm continued spending, while hydrogen-ready pipeline conversions in Germany and Denmark expand downstream scopes. Data protection regulations require in-region data centers, prompting vendors to establish EU-based secure engineering infrastructure.
Middle East Energy Engineering Services Outsourcing (ESO) Market
The Middle East is directing capital into gigawatt-scale green hydrogen, solar-plus-storage, and new LNG hubs. Saudi Arabia's NEOM Green Hydrogen project, with 4 GW of renewable generation and 600 t/d hydrogen output, is among the largest ongoing outsourced engineering programs globally.
South America and Africa Energy Engineering Services Outsourcing (ESO) Market
South America and Africa contribute smaller but strategic workloads. Petrobras’ pre-salt subsea systems and South Africa’s renewables auctions each drive niche demand, though currency volatility and local-content mandates narrow margins for international vendors.

Competitive Landscape
The Energy Engineering Services Outsourcing (ESO) market is moderately fragmented. Worley recorded USD 11.6 billion in revenue in FY 2024, with sustainability-related scopes accounting for 52% of its backlog. IT-focused competitors such as Tata Consultancy Services, Infosys, HCLTech, and L&T Technology Services leverage automation and India's engineering talent base to win digitization contracts. Leidos approximately doubled its energy headcount to around 5,500 following its USD 2.4 billion acquisition of ENTRUST Solutions Group in 2026, reflecting the importance of scale and vertical integration when clients require single-point accountability. Smaller specialists continue to pursue floating wind, hydrogen, and long-duration battery pilot projects, where first-of-a-kind risks discourage larger firms. Compliance with IEC 62443 and ISO 9001 has become a baseline requirement, and vendors without these credentials face qualification barriers. Vendors increasingly differentiate through demonstrated cycle-time reductions and lower levelized cost of energy delivered via digital workflows.
Energy Engineering Services Outsourcing (ESO) Industry Leaders
Wipro
Capgemini Engineering
Jacobs Engineering
L&T Technology Services (LTTS)
Tata Consultancy Services (TCS)
- *Disclaimer: Major Players sorted in no particular order
Energy Engineering Services Outsourcing (ESO) Market Companies Covered in this Report
- AECOM
- AFRY AB
- Alten S.A.
- Altran Technologies S.A.
- AtkinsRealis Group Inc.
- Black & Veatch Holding Company
- Capgemini SE
- Cyient Limited
- HCL Technologies Limited
- Hitachi Energy Ltd.
- Infosys Limited
- Jacobs Solutions Inc.
- Larsen & Toubro Technology Services Limited (LTTS)
- Ramboll Group A/S
- SNC-Lavalin Group Inc.
- Tata Consultancy Services Limited (TCS)
- Tech Mahindra Limited
- Wipro Limited
- Wood plc
- Worley Limited

Recent Industry Developments in Energy Engineering Services Outsourcing (ESO) Market
- March 2026: AtkinsRéalis secured a £98 million contract from Great Western Railway to deliver signalling upgrades on the Wessex rail network and a £100 million eight-year framework from Network Rail for the Transpennine Route Upgrade, expanding its transportation infrastructure portfolio beyond energy
- March 2025: Hitachi Energy committed USD 250 million to expand global transformer manufacturing capacity to ease shortages linked to data-center and AI power demand.
- February 2025: AFRY appointed principal engineering partner for SSAB’s fossil-free steel plant in Luleå, a flagship industrial decarbonization project.
- January 2025: ALTEN completed the acquisition of WORLDGRID from Atos, adding EUR 170 million (USD 187 million) revenue in energy and utilities solutions.


Global Energy Engineering Services Outsourcing (ESO) Market Report Scope
Energy Engineering Services Outsourcing (ESO) involves contracting third-party firms to handle specialized engineering tasks related to energy generation, distribution, and consumption. It allows companies to leverage external expertise for design, modeling, and simulation, improve efficiency, reduce costs by 30-50%, and accelerate project timelines.
The Global Energy Engineering Services Outsourcing (ESO) Market is segmented into service type, deployment model, energy source, and geography. By service type, the market is segmented into structuring and layout, digitization, R&D and designing, implementation and maintenance, and other services. By deployment model, the market is segmented into onshore and offshore. By energy source, the market is segmented into renewable, non-renewable, and chemical processing. The report also covers the market size and forecasts for the energy engineering services outsourcing market in 18 countries across major regions. For each segment, the market sizing and forecasts have been done on the basis of value (USD).
| Structuring & Layout |
| Digitization |
| R&D & Designing |
| Implementation & Maintenance |
| Other Services |
| Onshore |
| Offshore |
| Captive Outsourcing |
| Third-party Outsourcing |
| Renewable |
| Non-renewable |
| Chemical Processing |
| North America | United States |
| Canada | |
| Mexico | |
| Europe | Germany |
| United Kingdom | |
| France | |
| Italy | |
| NORDIC Countries | |
| Russia | |
| Rest of Europe | |
| Asia-Pacific | China |
| India | |
| Japan | |
| South Korea | |
| ASEAN Countries | |
| Rest of Asia-Pacific | |
| South America | Brazil |
| Argentina | |
| Rest of South America | |
| Middle East and Africa | Saudi Arabia |
| United Arab Emirates | |
| South Africa | |
| Egypt | |
| Rest of Middle East and Africa |
| By Service Type | Structuring & Layout | |
| Digitization | ||
| R&D & Designing | ||
| Implementation & Maintenance | ||
| Other Services | ||
| By Deployment Model | Onshore | |
| Offshore | ||
| By Sourcing Model (Qualitative Analysis Only) | Captive Outsourcing | |
| Third-party Outsourcing | ||
| By Energy Source | Renewable | |
| Non-renewable | ||
| Chemical Processing | ||
| By Geography | North America | United States |
| Canada | ||
| Mexico | ||
| Europe | Germany | |
| United Kingdom | ||
| France | ||
| Italy | ||
| NORDIC Countries | ||
| Russia | ||
| Rest of Europe | ||
| Asia-Pacific | China | |
| India | ||
| Japan | ||
| South Korea | ||
| ASEAN Countries | ||
| Rest of Asia-Pacific | ||
| South America | Brazil | |
| Argentina | ||
| Rest of South America | ||
| Middle East and Africa | Saudi Arabia | |
| United Arab Emirates | ||
| South Africa | ||
| Egypt | ||
| Rest of Middle East and Africa | ||


Key Questions Answered in the Report
What revenue is expected by 2031 for Energy engineering services outsourcing?
The value is forecast to reach USD 1.64 trillion by 2031, reflecting a 20.83% CAGR over 2026-2031.
Which region currently generates the largest share of spending?
Asia-Pacific led with 43.4% of 2025 revenue, powered by India’s global capability centers and China’s offshore wind build-out.
Which service line is expanding the fastest?
Digitization workstreams, digital twins, generative design, and cloud collaboration, are advancing at a 25.6% CAGR through 2031.
How does outsourced engineering for offshore projects grow versus onshore?
Offshore scopes, including floating wind and deep-water developments, are rising at 22.7% CAGR, outpacing onshore but starting from a smaller base.
Why are hydrogen-ready pipeline projects gaining momentum?
Retrofitting natural-gas lines to move hydrogen curbs emissions and taps existing rights-of-way, yet needs specialist metallurgical and compressor upgrades usually sourced to external engineers.
Who are the principal vendors to watch?
Key players encompass Worley, Jacobs, Wood, SNC-Lavalin, Tata Consultancy Services, Infosys, HCLTech, L&T Technology Services, and Leidos.
Page last updated on:


 Your data is secure and never sold or shared.


